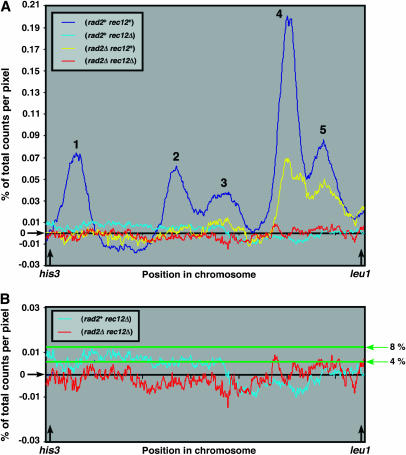
Figure 3.
Quantitation of DSBs in the his3–leu1 interval. For each strain in Figure 2 the amount of radioactive hybridization in each lane was normalized to the same level; the normalized value in the his3–leu1 interval, between the arrows in Figure 2, at 1 hr was subtracted from that at 4 hr and expressed as the percentage of total hybridization in the lane at and below the intact NotI fragment. The amount of breakage in the interval was 23% (GP4207, rad2+ rec12+), 1.3% (GP4899, rad2+ rec12Δ), 6.4% (GP4901, rad2Δ rec12+), and −1.3% (GP4903, rad2Δ rec12Δ). B is an expanded version of a portion of A. The horizontal lines in B indicate the levels of uniformly distributed DSBs in the rad2Δ rec12Δ strain expected under different assumptions (see discussion).

