

Abstract
The gene genealogies of two linked loci in three species are analyzed using a series of Markov chain models. We calculate the probability that the gene tree of one locus is concordant with the species tree, given that the gene tree of the other locus is concordant. We define a threshold value of the recombination rate, r*, to be the rate for which the difference between the conditional probability of concordance and its asymptotic value is reduced to 5% of the initial difference. We find that, although r* depends in a complicated way on the times of speciation and effective population sizes, it is always relatively small, <10/N4, where N4 is the effective size of the species represented by the internal branch of the species tree. Consequently, the concordance of gene trees of neutral loci with the species tree is expected to be on roughly the same length scale on the chromosome as the extent of significant linkage disequilibrium within species unless the effective size of contemporary populations is very different from the effective sizes of their ancestral populations. Both balancing selection and selective sweeps can result in much longer genomic regions having concordant gene trees.
IF one copy of a locus is sampled from each of three species, the ancestry of the sample (the gene tree) may be topologically different from the phylogeny of those species (the species tree) if the internal branch of the species tree is short (Hudson 1983b; Tajima 1983; Neigel and Avise 1986; Takahata 1989; Rosenberg 2002) or if there is balancing selection (Figueroa et al. 1988; Takahata 1990).
Understanding the relationship between gene trees and species trees is important to evolutionary biologists for at least three reasons. First, if a gene tree is not concordant with a species tree, then incorrect inference of the species tree using data from that gene can result. The correct species tree may be inferred if several unlinked genes are studied (Chen and Li 2001), but sufficient data may not be available in all cases. Second, if sequences of several genes are available, they can be used to estimate ancestral population sizes and lengths of internal branches of the species tree, thus providing a more detailed picture of evolutionary history than is available from analyzing data from single genes (Takahata 1986; Rannala and Yang 2003). Third, discordance of a gene tree and species tree can indicate a trans-species polymorphism that provides evidence of balancing selection (Figueroa et al. 1988; Ioerger et al. 1990; Muirhead et al. 2002; Wiuf et al. 2004).
In this article, we assume that one copy of two linked loci is sampled from each of three species. This problem is a special case of that considered by Wiuf et al. (2004), who modeled samples of one or more pairs of genes from each species with the goal of determining when trans-species polymorphism will be found at neutral and overdominant loci. They obtained approximate analytic results that closely fit their simulations. Here we provide an exact solution for the case of one chromosome sampled from each species. We compute the joint probabilities of concordance of the gene trees of both loci with the species tree and examine the dependence of this joint probability on the times of speciation and on the current and past populations sizes. We show that, if the effective population size of all ancestral species is the same and equal to N, the probability of concordance of one locus is essentially independent of the gene tree of the other locus if the product R = 2Nr ≫ 1. This result implies that if past and current effective population sizes are the same, the correlation in gene trees of linked loci decays on the same length scale on the chromosome as the decay of linkage disequilibrium.
THE MODEL
We assume that one chromosome is sampled from each of three species, as illustrated in Figure 1. At time t3 in the past, species S1 and S2 diverged from each other instantaneously. We call their ancestral species S4. At time t2 in the past, species S4 and S3 diverged from each other instantaneously. We call their ancestral species S5. To have as few states as possible in the Markov chains, we denote chromosomes sampled from both S1 and S2 as A–A′ and the chromosome sampled from species S3 as C–C′. The line connecting the two loci indicates that they are on the same ancestral chromosome. The second locus is indicated by a prime (′). The gene tree of the first locus is concordant in topology with the species tree if the two A's coalesce first, and it is not concordant if either A coalesces with C first and similarly for the second locus. Because coalescence of both loci has to occur, there are three possible outcomes: (I) both loci are concordant, (II) one locus is concordant and one not, or (III) neither locus is concordant. Because of the symmetry of the model, it does not matter for outcome II which locus is concordant. The problem is to compute the probabilities that the process reaches outcomes I, II, and III, which we denote by Pr(I), Pr(II), and Pr(III).
Figure 1.

Three-species tree illustrating the notation used in this article. The gene tree of the first locus is concordant in topology with the species tree because the two A's coalesce first. The gene tree of the second locus is not concordant with the species tree because one of the A′'s coalesces with C′ first. Outcome II of the model is illustrated. The times t2 and t3 are the times of divergence of the ancestral species into two descendant species.
In each species, we assume that the joint ancestry of the two loci can be modeled by the neutral coalescent process with recombination in a population of constant size, as first described by Hudson (1983a). The coalescent model assumes that the effective population size is sufficiently large and the recombination rate is sufficiently small that only one event, a coalescent event or a recombination event, occurs in each generation going backward in time. Simonsen and Churchill (1997) showed that this process is equivalent to a Markov chain in which each state represents a different configuration of the set of ancestral chromosomes. Simonsen and Churchill considered the ancestry of one and two chromosomes. Here, we have to model the ancestry of three chromosomes as well.
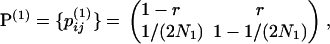
The first step is to consider the ancestry of a single chromosome in S1 and S2 between the present (t = 0) and t3. The ancestry of a single chromosome is modeled by a two-state Markov chain: state 1, ancestral lineages on the same chromosome (denoted by A–A′); and state 2, ancestral lineages on two different chromosomes (denoted by A, A′). Going backward in time, the transition matrix is
 |
(1) |
where the superscript indicates that these are the transition probabilities during the first time period considered, N1 is the effective population size of both S1 and S2, and the  are the elements of the transition matrix. They are the probabilities of being in state j at time t + 1 given state i at time t. Here and later, time is increasing in the past and is in terms of generations. Given state 1 at t = 0, the probabilities of states 1 and 2 at t3 for both S1 and S2 are
 |
(2) |
These probabilities provide the initial condition for S4 in which the ancestors of two chromosomes (one from S1 and the other from S2) are present. For our purposes, there are five states to be distinguished: state 1, two ancestral chromosomes (A–A′, A–A′); state 2, three ancestral chromosomes (A–A′, A, A′); state 3, four ancestral chromosomes (A, A, A′, A′); state 4, coalescence at one locus only; and state 5, coalescence at both loci. The coalescent model is the same as that analyzed by Simonsen and Churchill (1997), but a smaller state space is used here because our concern is only with the number of ancestral chromosomes at t2 and not with the complete pattern of joint ancestry.
The nonzero, off-diagonal elements of the transition matrix for this Markov chain, P(2), are as follows:  ,
, 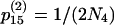 ,
, 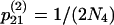 ,
,  ,
, 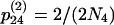 ,
,  ,
,  , and
, and  , where N4 is the effective size of S4. These terms are derived by noting that each chromosome containing two ancestral genes has a probability r of undergoing a recombination event that separates them and each pair of ancestral chromosomes has a probability of 1/(2N4) of coalescing. Here we use the assumption that two events do not occur in a single generation, which means that terms on the order of r2, r/N4, and
  are ignored.
The initial condition for this chain (at t = t3) is obtained by assuming independence of events in S1 and S2:
 |
(3) |
The probability of being in each of the five states at t2 is
 |
(4) |
where  is a row vector.
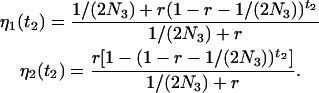
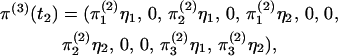
Before t2, when there was a single randomly mating species, S5, we have to consider the ancestry of three chromosomes (one from S1, one from S2, and one from S3). There are three possibilities at t2. First, if both loci have coalesced in S4, then the gene tree of both loci will necessarily be concordant with the species tree (outcome I). That occurs with probability  . Second, if one locus has coalesced in S4 and the other has not [which occurs with probability
  ], then the gene tree of the locus that has coalesced is necessarily concordant with the species tree. Because all three coalescent events in S5 are equally likely, the probability that the other locus is concordant with the species tree is
  and the probability that it is not is
  . In this case, the probability of outcome I is
  and the probability of outcome II is
  . The third possibility is that neither locus has coalesced in S4 [which occurs with probability
 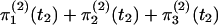 ]. In this case it is necessary to model the ancestry of all three chromosomes in a randomly mating population. We do this by generalizing the approach of Simonsen and Churchill (1997).
The state space is as follows. If there are three ancestral chromosomes and neither locus has coalesced, there are two possibilities: state 1, A–A′, A–A′, C–C′; and state 2, A–C′, A–A′, C–A′. If there are four ancestral chromosomes and neither locus has coalesced, there are five possibilities: state 3, A–A′, C–C′, A, A′; state 4, A–C′, C–A′, A, A′; state 5, A–A′, A–A′, C, C′; state 6, A–A′, C–A′, A, C′; and state 7, A–A′, A–C′, C, A′. If there are five ancestral chromosomes and neither locus has coalesced, there are four possibilities: state 8, A–A′, A, C, A′, C′; state 9, A–C′, A, C, A′, A′; state 10, C–A′, A, A, A′, C′; and state 11, C–C′, A, A, A′, A′. If there are six ancestral chromosomes, there is only one possibility, state 12, A, A, C, A′, A′, C′.
Several coalescent events can occur and each one leads to an absorbing state: state 13, A coalesces with A or A′ with A′; state 14, A coalesces with C or A′ coalesces with C′; state 15, A coalesces with A and A′ coalesces with A′ simultaneously; state 16, A coalesces with A and A′ coalesces with C′ simultaneously or A coalesces with C and A′ coalesces with A′ simultaneously; state 17, A coalesces with C and A′ coalesces with C′ simultaneously. In state 13, the gene tree of one locus is concordant with the species tree and in state 14 the gene tree of one locus is not concordant with the species tree. In both cases, the probability that the gene tree of the other locus is concordant with the species tree is  . In state 15, the gene trees of both loci are concordant with the species tree (outcome I); in state 16, the gene tree of one locus is concordant with the species tree and the other is not (outcome II); and in state 17, the gene trees of both loci are not concordant (outcome III). We can represent the mapping of the five absorbing states onto the three outcomes, I, II, and III, by a 3 × 5 matrix M, with elements mi,j (1 ≤ i ≤ 5, j = I, II, III) being the probabilities of absorbing state i + 12, resulting in outcomes I, II, and III. The nonzero elements of M are m1,I = m2,II =
  ,
,  , and m3,I = m4,II = m5,III = 1.
The nonzero, off-diagonal elements of the transition matrix for the 17-state Markov chain are as follows:
 |
(5) |
where K = 1/(2N5). An examination of the transition matrix reveals that state 6 can be combined with state 7 and state 9 can be combined with state 10, but retaining the 12 states makes the derivation and description of the model slightly easier.
To finish, we separate the transient states (1–12) from the absorbing states (13–17). Let Q be the 12 × 12 transition matrix for the transient states: the elements of Q are  for i, j ≤ 12. Let B be the 12 × 5 matrix of absorption probabilities from the transient states: the elements of B are
  , 1 ≤ i ≤ 12, 1 ≤ j ≤ 5.
The ultimate probability of absorption from each of the transient states can be represented by a 12 × 5 matrix G (with elements gij). The standard theory of Markov chains, summarized in Section 2.12 of Ewens (2004), tells us
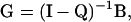 |
(6) |
where I is the 12 × 12 identity matrix and the superscript −1 denotes the matrix inverse.
To calculate the probabilities of absorption in the present case, we need the initial condition, which is obtained by assuming independence of events in S4 and S3. In S3, the probabilities of being in state 1 and state 2 of the two-state Markov chain are given by Equation 2 with t3 replaced by t2 and N1 replaced by N3, the effective size of S3:
 |
(7) |
Assuming independence in S4 and S3 implies that the probability of being in each of the transient states is the product of the appropriate probabilities calculated for S3 and S4 separately,
 |
(8) |
where, for notational convenience, t2 is omitted from the terms on the right-hand side. The vector of probabilities of absorption is  and the vector of probabilities of the three outcomes is
  , which has elements πI, πII, and πIII. To obtain the overall probabilities of the three outcomes, we add the probabilities that one or two coalescent events occurred in S4:
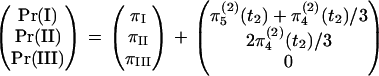 |
(9) |
A Mathematica program that carries out this calculation is available from the Slatkin laboratory web site (ib.berkeley.edu/labs/slatkin/software).
RESULTS
The above procedure is difficult to explain but easy to implement. The results are presented in terms of the conditional probability of concordance of the gene tree of one locus with the species tree, given that the gene tree of the other locus is concordant. This conditional probability, 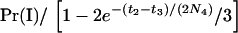 , is denoted by pC(r) to emphasize the dependence on r. The denominator is the unconditional probability of concordance for a single locus (Tajima 1983), which we denote by
  , where the
  indicates unlinked loci. For any combination of effective population sizes and species divergence times, pC(0) = 1, and we can anticipate that pC(r) approaches
  as r increases from 0.
All other conditional and joint probabilities can be derived from pC(r) and  . For example, the joint probability that the gene trees of both loci are not concordant with the species tree is
  . In these and similar expressions, the only dependence on r is through pC(r), so the rate of decrease of all conditional and joint probabilities to their asymptotic values is the same.
A typical result is shown in Figure 2. A convenient way to characterize the rate of decrease of pC(r) is the value of r for which  has decreased to 5% of its initial value. We define r* to be the solution to the equation
  . Roughly speaking, we can say that the probabilities of concordance of the two gene trees are independent if r > r* and not independent if r < r*.
Figure 2.

A typical graph of pC(r) as a function of r. The graph shown is for N1 = N3 = N4 = N5 = 1000, t3 = 500, and t2 = 1000. The asymptotic value,  , is 0.4808 for these parameter values. r* = 0.002 in this case.
We first assume that the effective population sizes are all the same (N). If N is large and r is small, the results depend only on the product R = 2Nr, as is generally the case for neutral alleles at linked loci (Hudson 1983a; Simonsen and Churchill 1997), so the results presented are quite general. If the length of the internal branch of the species tree, T = t2 − t3, is held constant, r* decreases with t3 until t3 is roughly N (Figure 3A). For a given t3, r* generally decreases with T (Figure 3B).
Figure 3.

The dependence of r* on the times of speciation. In all cases, N1 = N3 = N4 = N5 = 1000 and T = t2 − t3.
We then consider the effects of varying each of the effective population sizes separately (Figure 4). There is little dependence on N3 (Figure 4B), somewhat stronger dependence on N1 and N5 (Figure 4, A and D), and much stronger dependence on N4 (Figure 4C).
Figure 4.

The dependence of r* on each effective population size. In all cases, the remaining population sizes are 1000 and t3 = T (implying t2 = 2t3).
DISCUSSION AND CONCLUSIONS
The gene trees of closely linked loci are correlated because few recombination events occur between them before coalescence is complete at both loci. One consequence is that closely linked loci sampled from a single population are expected to be in linkage disequilibrium (LD). Another consequence is that gene genealogies of loci sampled from different species may be correlated with each other yet discordant with the species tree. The above results show that the gene trees of closely linked loci in a three-species clade are correlated to an extent that depends both on the times of speciation (t2 and t3) and on the current and past effective population sizes.
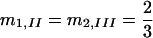
We draw three conclusions from our results. Our first conclusion relates to population genetics theory: the concordance of gene trees of linked loci with the species tree depends somewhat differently on the parameters of the model than does the concordance of a single gene tree with the species tree. The probability of concordance of a single gene tree with the species tree [ in our notation] is a function only of the ratio T/N4 while the joint probability of concordance of the two gene trees depends on the other parameters as well. In particular, the length of the terminal branches (t3) and the effective size of the common ancestral species (N5) are important. In many applications, species are well enough differentiated that the terminal branches can be assumed to be relatively long. If that were not true, their identities as separate species would be in question. The results in Figure 4D show that if the internal branch is sufficiently short, the extent of correlation of the gene trees of closely linked loci can provide information about N5 that would not be available from the analysis of each gene tree separately.
Second, the concordance of gene trees of linked loci is not independent only if the loci are closely linked. This prediction is consistent with the unpublished observations of D. A. Pollard, V. N. Iyer, A. M. Moses and M. B. Eisen that, in the Drosophila melanogaster subgroup, gene trees of linked sites are not correlated beyond ∼8 kb. When population sizes are equal, the results in Figure 3 show that when the internal branch length (T) or the terminal branch lengths (t3) are very small, the probabilities of concordance of gene trees are essentially independent for 2Nr > 20 in all cases. Although that is slightly longer than the length scale associated with LD expected between neutral loci in a population of constant size (Hill and Robertson 1968; Ohta and Kimura 1969), it is still relatively short.
Third, observations of the extent of concordance or discordance of species trees on a chromosome can provide information about past episodes of natural selection. Wiuf et al. (2004) have shown that balancing selection will substantially increase the length of the chromosomal region over which gene trees are concordant or discordant with the species tree. Although the problem has not received formal analysis, it is clear that a selective sweep occurring in the species represented by the internal branch of the species tree (Figure 1, species S4) would have a similar effect. If an allele with selective advantage s is substituted, then loci within a recombination distance of roughly r < s will be likely to coalesce at approximately the same time (Maynard Smith and Haigh 1974; Kaplan et al. 1989), thus ensuring concordance of the gene tree with the species tree. This hitchhiking effect is different from the effect of balancing selection in that it should lead only to concordance of the gene tree with the species tree on a large genomic scale and not to discordance over a comparably large genomic scale, as can balancing selection.
With increased availability of genomic data and the rapidly increasing number of species for which whole-genome sequences are available, it will be possible to examine variation in gene trees across genomes. The fine-scale variation in gene trees can reveal aspects of evolutionary history that are not accessible by other means.
Acknowledgments
We thank D. A. Pollard and M. B. Eisen for discussions that led to the analysis in this article and N. Rosenberg for helpful comments on an earlier version of the manuscript. This research has been supported in part by grant R01-GM40282 to M.S. from the National Institutes of Health.
References
- Chen, F. C., and W. H. Li, 2001. Genomic divergences between humans and other hominoids and the effective population size of the common ancestor of humans and chimpanzees. Am. J. Hum. Genet. 68: 444–456. [DOI] [PMC free article] [PubMed] [Google Scholar]
- Ewens, W. J., 2004. Mathematical Population Genetics: I. Theoretical Introduction. Springer, New York.
- Figueroa, F., E. Gunther and J. Klein, 1988. MHC polymorphism pre-dating speciation. Nature 335: 265. [DOI] [PubMed] [Google Scholar]
- Hill, W. G., and A. Robertson, 1968. Linkage disequilibrium in finite populations. Theor. Appl. Genet. 38: 226–231. [DOI] [PubMed] [Google Scholar]
- Hudson, R. R., 1983. a Properties of a neutral allele model with intragenic recombination. Theor. Popul. Biol. 23: 183–201. [DOI] [PubMed] [Google Scholar]
- Hudson, R. R., 1983. b Testing the constant-rate neutral allele model with protein sequence data. Evolution 37: 203–217. [DOI] [PubMed] [Google Scholar]
- Ioerger, T. R., A. G. Clark and T. H. Kao, 1990. Polymorphism at the self-incompatibility locus in Solanaceae predates speciation. Proc. Natl. Acad. Sci. USA 87: 9732–9735. [DOI] [PMC free article] [PubMed] [Google Scholar]
- Kaplan, N. L., R. R. Hudson and C. H. Langley, 1989. The “hitchhiking effect” revisited. Genetics 123: 887–899. [DOI] [PMC free article] [PubMed] [Google Scholar]
- Maynard Smith, J., and J. Haigh, 1974. The hitch-hiking effect of a favourable gene. Genet. Res. 23: 23–35. [PubMed] [Google Scholar]
- Muirhead, C. A., N. L. Glass and M. Slatkin, 2002. Multilocus self-recognition systems in fungi as a cause of trans-species polymorphism. Genetics 161: 633–641. [DOI] [PMC free article] [PubMed] [Google Scholar]
- Neigel, J. E., and J. C. Avise, 1986. Phylogenetic relationships of mitochondrial DNA under various demographic models of speciation, pp. 515–534 in Evolutionary Processes and Theory, edited by S. Karlin and E. Nevo. Academic Press, New York.
- Ohta, T., and M. Kimura, 1969. Linkage disequilibrium at steady state determined by random genetic drift and recurrent mutation. Genetics 63: 229–238. [DOI] [PMC free article] [PubMed] [Google Scholar]
- Rannala, B., and Z. Yang, 2003. Bayes estimation of species divergence times and ancestral population sizes using DNA sequences from multiple loci. Genetics 164: 1645–1656. [DOI] [PMC free article] [PubMed] [Google Scholar]
- Rosenberg, N. A., 2002. The probability of topological concordance of gene trees and species trees. Theor. Popul. Biol. 61: 225–247. [DOI] [PubMed] [Google Scholar]
- Simonsen, K. L., and G. A. Churchill, 1997. A Markov chain model of coalescence with recombination. Theor. Popul. Biol. 52: 43–59. [DOI] [PubMed] [Google Scholar]
- Tajima, F., 1983. Evolutionary relationship of DNA sequences in finite populations. Genetics 105: 437–460. [DOI] [PMC free article] [PubMed] [Google Scholar]
- Takahata, N., 1986. An attempt to estimate the effective size of the ancestral species common to two extant species from which homologous genes are sequenced. Genet. Res. 48: 187–190. [DOI] [PubMed] [Google Scholar]
- Takahata, N., 1989. Gene genealogy in three related populations: consistency probability between gene and population trees. Genetics 122: 957–966. [DOI] [PMC free article] [PubMed] [Google Scholar]
- Takahata, N., 1990. A simple genealogical structure of strongly balanced allelic lines and trans-species evolution of polymorphism. Proc. Natl. Acad. Sci. USA 87: 2419–2423. [DOI] [PMC free article] [PubMed] [Google Scholar]
- Wiuf, C., K. Zhao, H. Innan and M. Nordborg, 2004. The probability and chromosomal extent of trans-specific polymorphism. Genetics 168: 2363–2372. [DOI] [PMC free article] [PubMed] [Google Scholar]