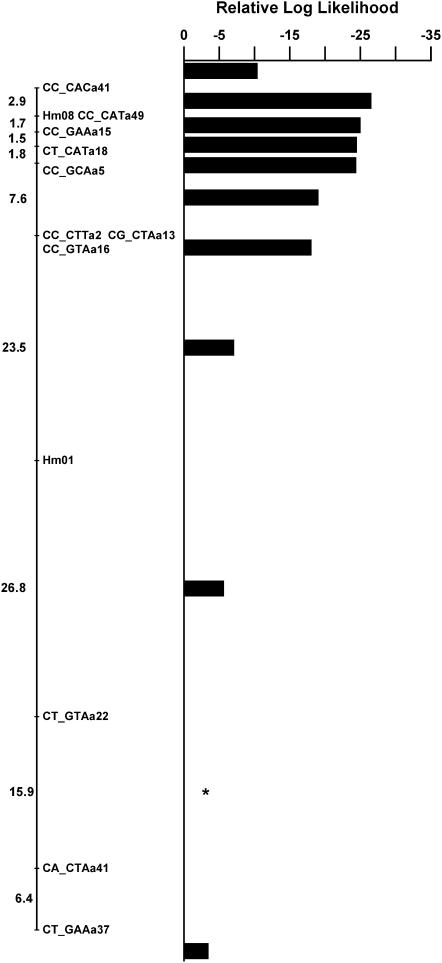
Figure 4.
Placement of the color pattern locus Yb on linkage group 15. The log likelihood is shown for placement of the color pattern locus in each mapping interval along the linkage group, relative to the most likely location that is set at zero and is indicated by a star. Values <−2 indicate a significantly worse fit to the data at ∼95%, so placement of the locus in all intervals except for 2 can be ruled out. The Yb locus therefore must be located in the 22-cM interval between the markers CT_GTAa22 and CT_GAAa37.

