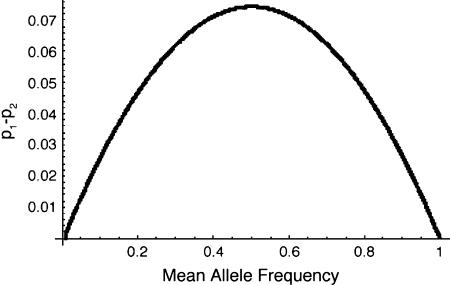
Figure 2.—
The difference in allele frequency between habitats, as a function of the overall mean allele frequency. A positive number for this difference indicates that the deme where the allele is favored has a higher frequency of the allele. For this example, there are two equal, large demes with symmetric migration rate 0.025. s1 = 0.01 and s2 = −0.005. The graph traces the deterministic trajectory from an initial state when the allele is rare in both populations to when the allele has reached global fixation.

