

Abstract
PDGF is a potent chemotactic mitogen and a strong inductor of fibroblast motility. In Swiss 3T3 fibroblasts, exposure to PDGF but not EGF or IGF-1 causes a rapid loss of actin stress fibers (SFs) and focal adhesions (FAs), which is followed by the development of retractile dendritic protrusions and induction of motility. The PDGF-specific actin reorganization was blocked by inhibition of Src-kinase and the 26S proteasome. PDGF induced Src-dependent association between the multifunctional transcription/translation regulator hnRNP-K and the mRNA-encoding myosin regulatory light-chain (MRLC)-interacting protein (MIR), a E3-ubiquitin ligase that is MRLC specific. This in turn rapidly increased MIR expression, and led to ubiquitination and proteasome-mediated degradation of MRLC. Downregulation of MIR by RNA muting prevented the reorganization of actin structures and severely reduced the migratory and wound-healing potential of PDGF-treated cells. The results show that activation of MIR and the resulting removal of diphosphorylated MRLC are essential for PDGF to instigate and maintain control over the actin–myosin-based contractile system in Swiss 3T3 fibroblasts. The PDGF induced protein destabilization through the regulation of hnRNP-K controlled ubiquitin -ligase translation identifies a novel pathway by which external stimuli can regulate phenotypic development through rapid, organelle-specific changes in the activity and stability of cytoskeletal regulators.
Keywords: focal adhesions, hnRNP-K, MIR, PDGF, ubiquitin
Introduction
Changes in cellular morphology and the induction of locomotion in response to extracellular stimuli are mainly determined by concerted reorganization of the actin cytoskeleton, which forms a dynamic structural framework around which cell shape, polarity, motility and mitosis are defined. The organization of the actin filaments is coordinated by a multitude of accessory proteins whose functions are, in turn, regulated by many signals, including the activity of small GTPases, reversible phosphorylation, phosphoinositides, intracellular pH, oxygen radicals and free Ca2+ levels. Controlled spatiotemporal activation of Rho-family GTPases and their regulative interactions control the organization of F-actins and alter motility in many cell types, including fibroblasts. Several studies have identified myosin regulatory light chain (MRLC) and its regulatory molecules as a functional link between Rho and the formation of stress fibers (SFs) (Sellers et al, 1981; Ikebe et al, 1987; Satterwhite et al, 1992; Kimura et al, 1996; Kureishi et al, 1997; Hall, 1998), and phosphoactivation of MRLC is essential for the formation of actin SF and focal adhesion (FA) complexes (Totsukawa et al, 2000).
SFs are bundles of actin filaments with associated myosin filaments and other key proteins of the actin–myosin-based contractile system found in nonmuscle cells. The ends of most SF are anchored to FA complexes, which are established by clustering of integrins and enable the forces generated by actomyosin contractions to be transferred to extracellular structures. While highly organized spatial orientation of the SF provides the cell with solid anchorage within tissue structures, the ability of actin polymers to assemble and disassemble rapidly within the core of retractile surface extensions enables migration.
PDGF is a potent mitogen and a physiological chemotactic factor for fibroblasts. Short-term exposure to PDGF triggers dynamic cytoskeletal changes, including a reduction of SF and FA complexes and the formation of lamellipodia, whereas long-term exposure leads to the induction of motility (Bockus and Stiles, 1984; Ridley and Hall, 1994; Wennstrom et al, 1994). PDGF also suppresses SF and FA promotion induced by other stimuli, such as lysophosphatidic acid and bombesin, in a dose-dependent manner (Rankin and Rozengurt, 1994; Seufferlein and Rozengurt, 1994; Jimenez et al, 2000). Indeed, the ability of PDGF to cause disruption of SF and FA complexes in a variety of cell types is well established, but the regulatory mechanisms have, however, remained elusive (Jimenez et al, 2000).
In the present study, we have investigated the molecular mechanisms activated by PDGF to change actin organization in 3T3 fibroblasts, in concurrence with altered adhesive characteristics and subsequent induction of motility. Specifically, the regulatory pattern and rate of post-translational modifications and turn-over of proteins, induced during both short- and long-term treatment with growth factors individually or in combinations, have been examined.
Results
Treatment with PDGF induces dynamic morphological changes in Swiss 3T3 cells, and dominates over EGF- and IGF-1-induced phenotypes
The sequence and timing of actin cytoskeletal changes induced in Swiss 3T3 fibroblasts during sustained stimulation with PDGF, IGF-1, EGF and combinations thereof were investigated. PDGF induced a unique morphological phenotype, which was characterized by an elongated cell shape, dendritic protrusions and an attenuation of central SF and FA (Figure 1). While PDGF reduced SF and FA within the first 30 min, 12 h of exposure were required for the complete development of the dynamic surface protrusions. The appearance of mature protrusions coincided with a significant enhancement in the motility of PDGF-treated cells (see Supplementary data 1A). Analysis by time-lapse microscopy revealed that the increased motility, characterized by continuous extension and retraction of the dendritic protrusions and changes in cell shape, was sustained for the rest of the observation period (12–22 h). Although stimulation with EGF also increased membrane movements over the same time period, the fibroblasts remained stationary and no forward movement of their nuclei was observed (see Supplementary data 1B). Conversely, long-term stimulation with EGF, IGF-1 or both resulted in moderate increases in SF and FA formation, compared to nonstimulated cells; FA were found in 20% of nonstimulated cells, in 26% of IGF-1 and in 28% of EGF stimulated cells (Figure 1, top graph). EGF and IGF-1 induced a large, flat immotile phenotype and almost doubled the cell surface area compared to that of untreated or PDGF-stimulated cells (Figure 1, bottom graph). The EGF- or IGF-1-induced morphological changes were greatly influenced by cell confluence, whereas the PDGF-induced changes were less affected. This suggested that PDGF receptor signalling may over-ride that induced by cell–cell contacts in Swiss 3T3 cells. Furthermore, costimulation experiments demonstrated that PDGF had a dominant influence on morphology over EGF and IGF-1, resulting in the formation of dendritic protrusions and suppression of SF and FA, even in cells simultaneously exposed to all three GFs (Figure 1). In contrast, costimulation with EGF plus IGF-1 increased the formation of SF and FA in about 25% of the murine fibroblasts.
Figure 1.
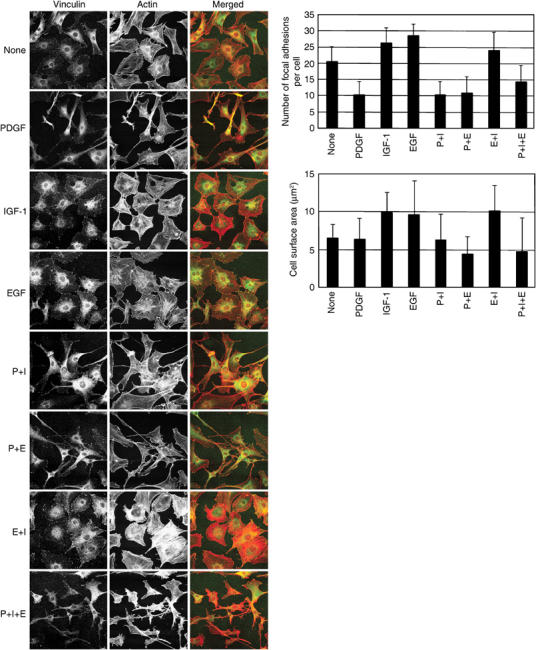
Cytoskeletal changes induced by long-term stimulation with PDGF, IGF-1, EGF and their combinations. Swiss 3T3 cells were stimulated with growth factors for 18 h and stained with α-vinculin antibody and rhodamine–phalloidin. Arrowheads and arrows show FAs and dendritic protrusions, respectively. Note the dominance of PDGF in costimulation experiments, resulting in an elongated cell shape with dendritic protrusions and disruption of SFs and FAs.
PDGF-specific reduction of MRLC expression
A functional proteomic analysis was undertaken to identify changes in the 3T3 fibroblast proteome, which defined the resulting morphological phenotypes. The rate of protein synthesis was monitored by biosynthetic labelling with [35S]-methionine and -cysteine, and GF-induced changes in the expression of proteins were determined by quantitation and comparison of the protein spots' volumes and intensities on fluorescence-stained gel images. The three growth factors induced de novo synthesis of several hundred protein isoforms within the first 6 h of treatment, in addition to the 631, which were radiolabelled in untreated cells (Supplementary Figure 1). While the vast majority of the detected proteins showed similar regulation over time, 21% of the matched spots were differentially regulated by the three GFs. In all, 117 unique gene products were identified by mass spectrometry (ms) analysis of 115 differentially regulated protein features. PDGF stimulation induced the highest overall rate of protein synthesis at any given time, followed by IGF-1 and then EGF, as judged by the total quantity of radioisotope incorporation measured in the 3T3 cells' proteome by autoradiography, following separation on broad pH-range two-dimensional (2D) gels (Supplementary Figure 1). To facilitate identification of proteins whose specific regulation contribute to the establishment of a motile cytoskeleton in 3T3 fibroblasts, we focused on proteins that were dominantly induced or suppressed by PDGF in costimulation experiments.
A newly synthesized 22 kDa acidic protein, which was highly abundant in untreated, and EGF- and IGF-1-treated cells, was strongly and dominantly suppressed by PDGF (Figure 2A, B and D). Mass spectrometry analysis identified the protein as MRLC 2A, a key regulator of the actin–myosin-based contractile system (Fukata et al, 2001). In all, 14 peptides were identified by matrix-assisted laser desorption/ionization analysis, corresponding to 61% of the primary structure of MRLC 2A. De novo sequencing by electrospray ionization–ms/ms analysis confirmed the amino-acid sequence in two of these peptides (data not shown). Of the 23 cytoskeletal regulators, we identified based on GF-specific radiolabelling, only MRLC was dominantly suppressed by both short- and long-term PDGF-stimulation.
Figure 2.
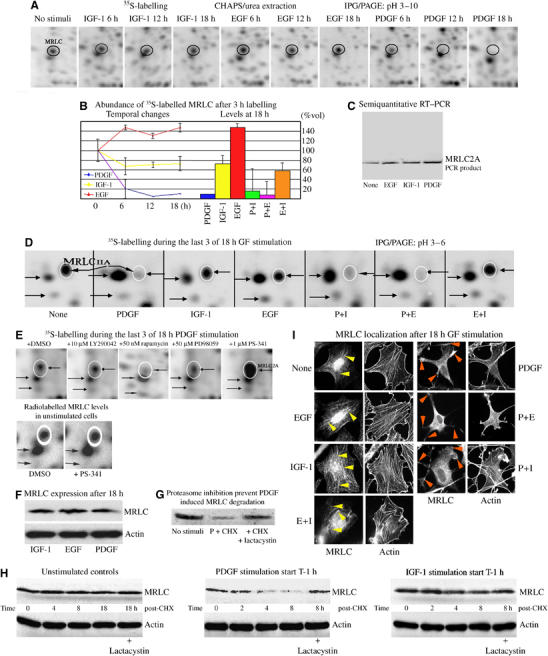
PDGF-specific suppression of MRLC. (A) Abundance of radiolabelled MRLC in growth factor-treated Swiss 3T3 fibroblasts at 6, 12 and 18 h (encircled in black). Protein synthesis was studied by labelling with [35S]-methionine and -cysteine during the last 3 h of stimulation. (B) Changes in the abundance of nascent acidic MRLC induced by PDGF, IGF-1 and EGF (left side of graphs), and the effects of costimulation for 18 h (right). Quantitative data represent average of three independent analyses of cells at different times. (C) Semiquantitative RT–PCR analysis of MRLC 2A gene expression in response to growth factor stimulation. (D) PDGF treatment dominantly suppressed the levels of nascent MRLC in costimulation experiments at 18 h. The acidic isoform is encircled in white, and indicated by horizontal arrow pointing left. (E) Effect of various inhibitors on the acidic MRLC isoform in cells exposed to PDGF for 18 h. DMSO (1 μl/ml), LY294002, rapamycin, PD98059 or PS-341 in DMSO was added 1 h before and the 3 h labelling period. (F) Immunoblots of MRLC after GF stimulation. Staining was performed with anti-MLC and β-actin antibodies from Sigma. (G) MRLC levels in controls and in cells stimulated for 4 h with PDGF in the presence of cycloheximide (CHX) (10 μg/ml) or CHX plus lactacystin (50 μM). (H) Changes in MRLC expression after CHX-chase. Cells were stimulated with GF for 1 h before CHX. Stained with anti-MLC and anti β-actin antibodies as above. (I) Localization of MRLC. Growth factor-treated 3T3 cells were stained with anti-MLC antibody (1:25; Sigma) and rhodamine–phalloidin for visualization of actin. Colocalization with actin SFs is indicated by arrowheads in left images and local concentrations at the termination of the PDGF-specific surface extensions are indicated by arrowheads to the right.
Semiquantitative RT–PCR analysis demonstrated slightly increased MRLC gene expression in PDGF-treated cells compared to the levels detected in EGF- and IGF-1-treated cells (Figure 2C), indicating that the PDGF-specific reduction occurred after transcription.
The abundance of newly synthesized, 35S-labelled MRLC copies in PDGF-stimulated or -costimulated cells was reduced to less than 10% of the levels detected in untreated, and EGF- and IGF-1-treated cells at the 18 h time point (Figure 2A and B). Treatment of cells with both EGF and IGF-1 induced a number of newly synthesized MRLC copies, similar to that detected in cells stimulated with IGF-1 alone (Figure 2B).
Cells treated with PDGF in the presence of 10 μM LY294002 or 50 μM PD98059, inhibitors of phosphatidylinositol-3 kinase (PI3 K) and MAPK kinase (MEK), respectively, showed no increase in isotope labelling of the 22 kDa MRLC form, indicating that the suppressive effects caused by PDGF occurred independently of the pathways regulated downstream of these kinases (Figure 2E). Inhibition of mTOR kinase by treatment with 50 nM rapamycin reduced the abundance of newly synthesized MRLC in PDGF-treated cells further (Figure 2E), suggesting that its translation was under the control of the p70s6 kinase.
PDGF-induced reduction of newly synthesized MRLC in 3T3 cells was, in contrast, reversed completely by treatment with PS-341 (1 μM), a specific inhibitor of the 26S proteasome (Adams et al, 1999) (Figure 2E). While inhibition of the 26S proteasome had no effect on the abundance of radiolabelled MRLC copies in untreated cells (Figure 2E, lower panel), the number of newly synthesized species found in cells treated with PDGF in the presence of a proteasome inhibitor was significantly higher than those detected in untreated, and EGF- and IGF-1-stimulated cells (Figure 2A and E). Immunoblotting of whole-cell extracts showed that the abundance of MRLC in cells stimulated with PDGF was only marginally reduced compared to the levels found in IGF-1- and EGF-treated cells after 18 h (Figure 2F). Taken together, these findings suggest that PDGF augment the turn-over rate of MRLC in Swiss 3T3 fibroblasts by increasing its transcription and translation rates, and promoting its removal via the 26S proteasome.
To investigate this further, the abundance of MRLC at various time points after the cells de novo protein synthesis was blocked by addition of cycloheximide (10 μg/ml) was examined (Figure 2G and H). While the half-life of MRLC was more than 18 h in untreated and IGF-1-stimulated cells, it was significantly shortened by PDGF treatment (Figure 2G). The addition of lactacystin (50 μM), a proteasome-specific inhibitor structurally distinct from PS-341, to the cycloheximide-chase experiments abrogated the enhanced removal of MRLC from PDGF-treated cells, but had no effect on MRLC expression in untreated or IGF-1-stimulated cells (Figure 2G and H). These findings confirmed that the turn-over rate of MRLC is significantly increased in PDGF-treated cells and further support the notion that PDGF targets the actin–myosin regulator for proteasome-mediated degradation.
Immunofluorescent staining showed colocalization of MRLC and actin SFs in nonstimulated, and EGF- and IGF-1-stimulated fibroblasts, and that the concentrations of both proteins were elevated at the base of the adhesion plaques situated at the end of the bundled fibers (yellow arrowheads in Figure 2I). MRLC was also localized in the nuclei of nonstimulated (35%), EGF (31%), IGF-1 (30%) and costimulated (EGF and IGF-1: 32%) cells, whereas in PDGF-stimulated cells, MRLC was found in the cytoplasm and dendritic protrusions, but rarely in the nucleus (<10%) (Figure 2H). Staining for MRLC was additionally found to decorate the arched actin filaments seen in the periphery and at the termination of PDGF-specific surface protrusions (orange arrowheads in Figure 2H). Finally, costimulation with PDGF together with EGF or IGF-1 abolished nuclear presence of MRLC, showing a distribution that could not be distinguished from that generated by PDGF treatment alone (Figure 2H). These findings imply that in addition to shortening the half-life of MRLC, PDGF also dominantly regulates its intracellular distribution in Swiss 3T3 cells.
PDGF-induced degradation of MRLC via the ubiquitin–proteasome system.
Inhibition of 26S proteasome activity, by the addition of 1 μM PS-341 during the last 4 h of a 18 h treatment period, multiplied the abundance of the 22 kDa MRLC form in PDGF-stimulated cells (encircled and indicated by horizontal arrow in Figure 3A). This also caused several high molecular weight (HMW) protein species that were immunologically crossreactive with MRLC, but not found in extracts from cells treated with PDGF alone, to be detected (framed by black rectangles in Figure 3A). The vertical appearance and abundance of these 140–160 kDa, PS-341-sensitive species (indicated by oblique arrow) suggested that the MRLC was polyubiquitinated in response to PDGF.
Figure 3.
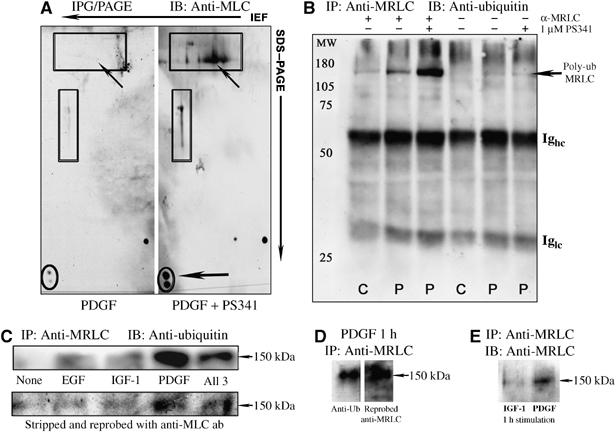
PDGF-specific ubiquitination of MRLC in 3T3 fibroblasts. (A) Cells were treated with PDGF for 18 h and 150 μg of proteins separated by 2DE. MRLC was detected by immunoblotting with a murine IgM mAb (1:200; NEB). The 22 kDa isoform migrating at a pI of 4.55 is encircled in black, and indicated by horizontal arrow at the right. (B) Controls- (C) and PDGF- (P) treated cells were lysed and MRLC isolated by immunoprecipitation (1:25; sc-9448). Immunostaining with anti-ubiquitin antibody (1:1000; Affiniti Research Products, PW8810) demonstrated increased ubiquitination of MRLC in treated cells. The poly-ubiquitin-MRLC form migrated at a molecular weight of approximately 150 kDa, similar to the size of the HMW immunoreactive species indicated by oblique upwards arrows in (A). (C) Polyubiquitinated MRLC was increased by PDGF stimulation for 1 h in the presence of 1 μM PS-341, compared with that in EGF- or IGF-1-treated cells. Costimulation with PDGF also enhanced MRLC ubiquitination. The anti-ubiquitin-stained membrane was subsequently stripped and reprobed with antibody against MRLC (1:200; NEB) (bottom row). (D) The membrane was restained to show clearly the presence of ubiquitinylated MRLC at 150 kDa. (E) The 150 kDa polyubiquitinated MRLC was less abundant in IGF-1- than in PDGF-stimulated cells.
Immunostaining of immunoprecipitated (IP) MRLC with antibody against ubiquitin confirmed that PDGF induced ubiquitination of MRLC (Figure 3B and C). Proteasome inhibition significantly increased the abundance of a 150 kDa, PDGF-induced polyubiquitinylated MRLC form, in agreement with the HMW antigens detected by 2D IB under similar conditions.
Ubiquitination of MRLC occurred at a several-fold higher rate in the PDGF-treated cells than in nontreated, EGF- or IGF-1-treated cells (Figure 3C, top row). Stripping and reprobing of the membrane with an antibody against MRLC and staining of IP samples from IGF-1- and PDGF-treated cells with antibody against MRLC confirmed that the 150 kDa PDGF-specific protein band represented polyubiquitinylated MRLC (Figure 3C–E).
Consistent with the dominant suppressive effect of PDGF, enhanced rates of MRLC ubiquitination were also found in cells costimulated with this growth factor together with EGF and/or IGF-1. The levels of polyubiquitinated MRLC detected in cells, costimulated with all three growth factors for 1 h, was more than fivefold higher than those found in nontreated, EGF- or IGF-1-stimulated cells (Figure 3C). Together, these results demonstrated that PDGF controlled MRLC activity in 3T3 fibroblasts by regulating its expression through targeted degradation.
PDGF-specific induction of the E3-ligase MIR in 3T3 fibroblasts
To identify the mechanism mediating the effects of PDGF on MRLC ubiquitination, the expression of MRLC-interacting protein (MIR), an E3-ligase (Olsson et al, 1999) recently shown to promote ubiquitination of MRLC in N2-A neuroblastoma cells (Bornhauser et al, 2003), was examined. The expression of MIR in 3T3 fibroblasts was strongly upregulated within minutes of exposure to PDGF (Figure 4A). Maximum levels of MIR were observed after 1–2 h stimulation, and its expression remained elevated during sustained exposure (Figure 4A). MIR synthesis was several fold higher in PDGF-stimulated cells than in nontreated fibroblasts and in cells stimulated with IGF-1 or EGF, at all time points (Figure 4A and B). The induction of MIR by PDGF was prevented by pretreating the cells with 2 μM SU6656, a Src-kinase family selective inhibitor (Figure 4B). Intriguingly, MRLC phosphorylated at threonine 18 and serine 19 copurified with MIR in immunoprecipitates from PDGF-stimulated, but not from -untreated cells (Figure 4C). While PDGF induces ubiquitination of diphosphorylated MRLC, it simultaneously increases the abundance of Ser19-phosphorylated MRLC compared to the levels found in untreated and EGF-stimulated 3T3 fibroblasts (Supplementary Figure 2).
Figure 4.
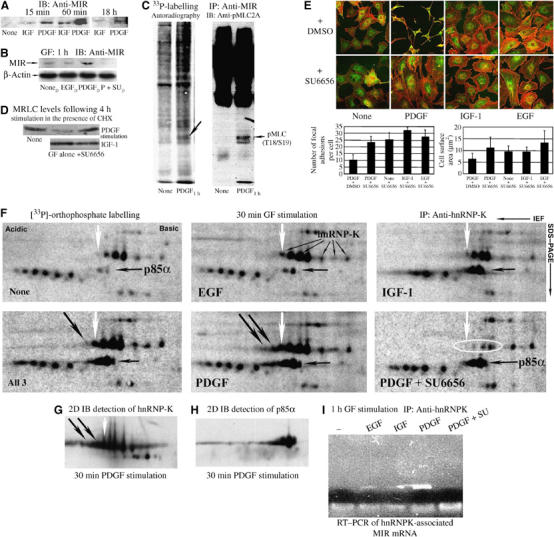
Induction of the MIR E3-ligase by PDGF is abrogated by Src-kinase inhibition. (A) Increase in the 50 kDa MIR ubiquitin-ligase after GF stimulation. Rabbit anti-MIR antiserum was used at 1:3000. The levels were increased at 15 min, with a maximum attained at 1 h after PDGF stimulation. (B) Effects of DMSO, EGF, PDGF or PDGF plus 2 μM SU6656 (all in DMSO) on MIR. (C) Copurification of MIR and phosphorylated MRLC. Cells were labelled with 33P-ortho-phosphate for 6 h before PDGF stimulation and MIR isolated by immunoprecipitation. A 22 kDa phosphoprotein specifically copurified with MIR is indicated by oblique downward arrow in the autoradiogram (left). Subsequent staining of the membrane with the antibody specific for MRLC 2 phosphorylated at Thr18 and Ser19 (no. 3674; Cell Signaling) is shown to the right. (D) Inhibition of Src-kinase activity by SU6656 abolished the PDGF-specific increase in MRLC degradation. (E) Morphology of Swiss 3T3 cells after 18 h GF stimulation in the presence and absence of 2 μM SU6656. (F) 2D autoradiograms of phosphoisotope-labelled proteins immunoprecipitated with a monospecific antibody against hnRNP-K protein (enlarged gel area is shown). The direction of IEF and SDS–PAGE is indicated in the upper right corner, and in all images, the acidic side is to the left. A hnRNP-K phosphoform induced in response to all three GFs, but absent in untreated cells, is indicated by white downward arrows. The position of hnRNP-K was confirmed by immunoblotting (G) and is indicated in the image from EGF-treated cells. Note the increased hnRNP-K phosphorylation in PDGF-stimulated and -costimulated cells, and the appearance of new phosphoforms (oblique downward arrows in PDGF images). A copurified protein (indicated by a horizontal black arrow) migrating slightly lower than hnRNP-K and demonstrating increased phosphorylation in IGF-1- and PDGF-stimulated cells was identified as p85α using a mixture of the mAbs U9 and U14 (H). IGF-1- and PDGF- but not EGF-induced PI3 K activity in the 3T3 cells (see Supplementary Figure 2), and phospho-activation of hnRNP-K-associated p85 coincites with increased PI3 K activity in IGF-1- and PDGF-treated cells, further verifying the specificity of the phosphoisotope labeling procedure. (I) RT–PCR amplification of hnRNP-K associated MIR mRNA isolated by immuno precipitation from samples from nonstimulated and cells exposed to GF for 60 min using the monospecific antibody 54.
Consistent with Src-dependent MIR induction being responsible for the enhanced removal of MRLC from PDGF-treated cells, the presence of 1 μM SU6656 prevented PDGF-specific MRLC degradation in cycloheximide-chase experiments, but had no effect upon its expression in IGF-1-treated cells (Figure 4D). Inhibition of Src activity also blocked the establishment of the elongated motile morphology normally induced by long-term PDGF stimulation, resulting in formation of a flat, immotile cell shape with an enlarged surface area and an abundance of FA typically found in EGF- and IGF-1-stimulated 3T3 cells (Figures 1 and 4E). In contrast, inhibition of Src activity did not affect the flat, immotile morphology induced by EGF and IGF-1. These findings link PDGF-induced, Src-dependent MIR activity to the fate of MRLC and morphological differentiation of fibroblasts, and suggest that the association between the E3-ligase and MRLC is regulated by the phosphorylation status of the substrate.
A recent report suggested that RNA-binding proteins may be involved in the regulation of cell spreading (de Hoog et al, 2004). This analysis of GF-induced phosphosignalling in 3T3 cells showed a strong increase in the phosphorylation of hnRNP-K protein soon after stimulation with PDGF (Figure 4F). Phosphorylation of hnRNP-K by a c-Src-regulated mechanism has previously been shown to regulate translation of hnRNP-K-associated mRNAs (Ostareck-Lederer et al, 2002), and here PDGF treatment dominantly increased hnRNP-K phosphorylation with induction of new specific acidic phosphoforms, one of which was also detected in cells costimulated with all three GFs (oblique downward black arrows in Figure 4F and G). Inhibition of Src-kinase activity strongly reduced the abundance of phosphorylated hnRNP-K forms and abrogated PDGF-specific phosphorylation of the protein, but only marginally affected the phosphorylation status of copurified p85α (Figure 4F and H).
RT–PCR amplification of mRNAs attached to IP hnRNP-K proteins from nonstimulated controls and GF-stimulated 3T3 cells revealed exclusive association between hnRNP-K and mRNA encoding MIR in PDGF-treated cells (Figure 4J). The PDGF-specific interaction between hnRNP-K and MIR transcripts was blocked in cells pretreated with the Src-kinase inhibitor SU6656.
Downregulation of MIR by RNA silencing prevents the effects of PDGF on actin SFs and cytoskeleton, and inhibits cell migration
To further assess the involvement of MIR in the reorganization of actin structures and the induction of a motile phenotype by PDGF, the expression of MIR was suppressed by RNAi-mediated gene muting. In MIR-muted cells, the abundance of MRLC increased (Figure 5A and D). Also, PDGF was prevented from inducing SF disruption and treated cells remained flattened and predominantly immotile (Figure 5B and C). Under control conditions, the fibroblasts responded to PDGF with morphological transformation, disassembly of SF, the development of a narrow elongated shape (Figure 5B, top) and they became motile (Figure 5C). The effects of MIR reduction were specific for PDGF-treated cells, as neither MIR-RNAi nor scramble-oligos induced morphological changes or motility in IGF-1-stimulated cells (Figure 5B, bottom). Rescue experiments using fibroblasts expressing human MIR with two mismatches against the small interference RNA (siRNA) molecules showed that in the presence of siRNA-resistant MIR, the MRLC downregulation was apparent (Supplementary Figure 3). This indicated that the levels of MIR were crucially involved in the regulation of MRLC in these cells. MIR was frequently localized in the nucleus of PDGF-treated, but rarely and at much lower concentrations in the nucleus of IGF-1-treated cells (upwards white arrows in Figure 5B). To substantiate the data, the migration of wild-type and MIR-silenced cells was analyzed in a scratch assay in the presence of PDGF. The results showed that the PDGF-induced migratory and wound-healing potentials of 3T3 fibroblasts were severely affected by downregulation of MIR (Figure 5C and D). This demonstrated that functional MIR protein was required for the specific cytoskeletal reorganization and subsequent mobilization of fibroblasts induced by PDGF.
Figure 5.
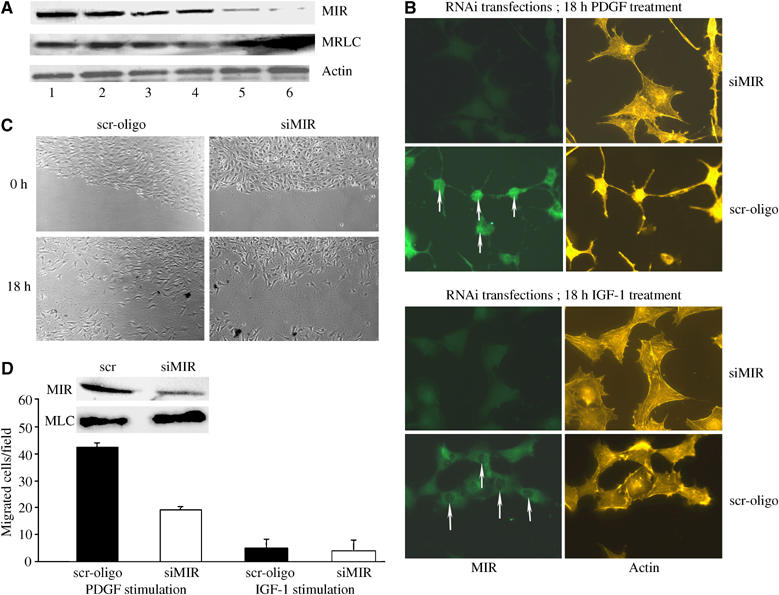
PDGF-induced morphology, migration and wound healing are significantly affected by silencing of MIR E3-ligase. (A) Silencing of MIR by siRNA shown by Western blotting. Lane 1: control, no transfection; lane 2: transfection no siRNA; lane 3: scramble (scr) siRNA; lane 4: MIR siRNA 1; lane 5: MIR siRNA 2; lane 6: MIR siRNA 1+2. Note the additive effect with both siRNAs. (B) Morphological changes after silencing of MIR. Transfection with MIR-specific oligos but not with scramble ones abrogated the changes in morphology induced by PDGF. IGF-1-treated cells were unaffected. Note the nuclear localization of MIR in PDGF and its absence in IGF-1-treated cells (upward white arrows). (C) 3T3 cells with low MIR exhibited decreased migration after PDGF stimulation, as shown using the scratch assay (see Materials and Methods). Cells were photographed at time 0 and 18 h after a scratch. (D) Quantification of data. Note the significant reduced migratory potential of the siMIR-treated cells. Silencing of MIR had no effects on immotile IGF-1-treated fibroblasts. MIR downregulation and total cellular MRLC levels are shown by the immunoblots.
Inhibition of Src-kinase activity or the 26S proteasome block the PDGF-induced downregulation of nuclear MRLC
In accordance with a dependence on ubiquitin-mediated proteolysis, the PDGF-induced morphological transformation, distinguished by the assembly of an elongated motile cytoskeletal with long, contractile dendritic protrusions, was completely blocked by inhibition of the 26S proteasome (Figure 6A). Inhibition of the 26S proteasome or Src-kinase activity both abolished the PDGF-induced suppression of nuclear MRLC, leading to a frequency of intense nuclear MRLC staining and intranuclear MRLC levels similar to those found in untreated, and EGF- and IGF-1-stimulated cells (Figure 6A–D), suggesting that the nuclear pool of MRLC was degraded via the nuclear UPS.
Figure 6.
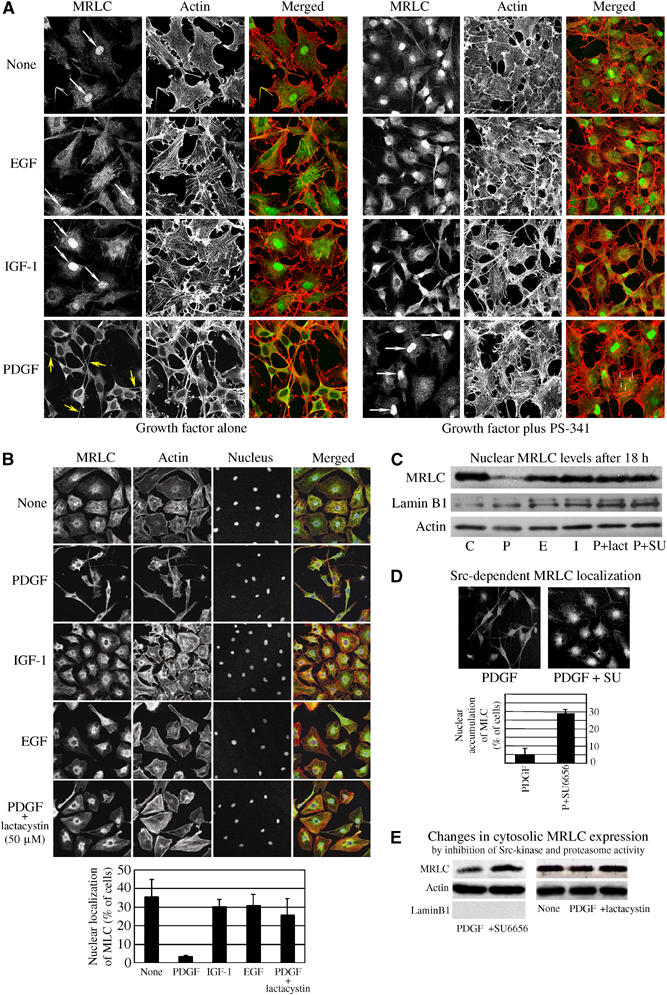
Inhibition of proteasome or Src-kinase activity prevent PDGF-induced differentiation of Swiss 3T3 cells and results in intranuclear accumulation of MRLC. (A) Growth factor induced changes in the localization of MRLC and actin demonstrated by staining with anti-MLC antibody (1:25; Sigma) and by rhodamine–phalloidin staining after 18 h stimulation. (B) Lactacystin (50 μM), inhibiting proteasomes, abolished PDGF-specific morphological changes, resulting in an increase in nuclear MRLC staining similar to that seen in untreated, and EGF- and IGF-1-treated cells. (C) Effects of lactacystin and SU6656 on the nuclear abundance of MRLC in PDGF-stimulated cells. Stained with anti-MLC antibody (1:100; Sigma). Lamin B1 served as nuclear marker. (D) Inhibition of Src-kinase activity by SU6656 abolished PDGF-specific morphologic changes and resulted in resulting in an increase in nuclear MRLC staining similar to that seen in untreated, and EGF- and IGF-1-treated cells. (E) MRLC in cytosolic fractions. Stained with the anti-MRLC 2 antibody (1:200; Santa-Cruz, sc-9448).
PDGF stimulation in the presence of either lactacystin or SU6656 also slightly increased the cytosolic abundance of MRLC compared to the level detected in cells exposed to the GF alone (Figure 6E). The cytosolic effect was however marginal compared to that the two inhibitors instigated on the nuclear abundance of MRLC in PDGF-treated cells.
Discussion
In the present study, a novel regulatory mechanism is identified, through which PDGF induces a sustained suppression of actin SFs and FAs in Swiss 3T3 fibroblasts, involving hnRNP-K activation, MIR induction and degradation of diphosphorylated MRLC through the ubiquitin–proteasome system. These initial effects of PDGF on MIR, MRLC and the actomyosin cytoskeleton are then shown to be essential for the subsequent enhancement of motility and chemotaxis induced by the growth factor.
PDGF increases both the transcription, translation and degradation of MRLC compared to EGF and IGF-1, but maintains an expression level similar to that found in cells stimulated with these GFs. Consistent with the higher overall rate of protein synthesis observed in PDGF-stimulated cells, the de novo synthesis of several ribosomal proteins is found to be upregulated in PDGF-stimulated cells compared to EGF- and IGF-1-stimulated cells. It is likely that this well-developed translational machinery enables PDGF-stimulated cells to amplify a slightly upregulated transcriptional activity, thereby boosting MRLC induction compared to that in untreated, and EGF- and IGF-1-stimulated cells.
The action of Src-kinase is mandatory for PDGF's capability to shorten the half-life of MRLC and to induce reorganization of the actin cytoskeleton as inhibition of Src activity blocked the PDGF-specific induction of the E3-ligase protein MIR, prevents PDGF-induced MRLC degradation and abolishes the establishment of a PDGF-specific motile phenotype in Swiss 3T3 fibroblasts. Downregulation of MIR by RNAi accordingly increases MRLC expression and suppresses phenotypic differentiation by PDGF. The significant functional effects from inhibition of Src-kinase or muting of MIR indicate that a reduced half-life of MRLC is essential for the establishment of a PDGF-specific phenotype.
Consistent with the involvement of the UPS, the 26S proteasome-specific inhibitors, PS-341 or lactacystin, abrogate the change in MRLC half-life and the initial demolition of existent higher order actin structures normally observed in response to PDGF, and the PDGF-induced signaling activity instead results in the development of an EGF- and IGF-1-like morphology, abundant in SF and FA complexes.
The study thus identifies a novel cellular pathway that starts with the activation of the PDGF receptor. This is followed by a Src-dependent translational activation of hnRNP-K-associated MIR mRNA, resulting in enhanced ubiquitination and 26S proteasome-mediated degradation of MRLC. Despite the half-life of MRLC being strongly reduced in PDGF-stimulated cells, its expression level is similar to that found in EGF- and IGF-1-stimulated cells. Consequently, the increased turn-over of MRLC seen in PDGF-stimulated cells is almost certainly achieved by similar increases in the rates of de novo synthesis and proteolysis.
Diphosphorylation of MRLC at Thr18/Ser19 increases actomyosin ATPase activity and significantly stabilizes the filament formation of myosin II in vitro (Ikebe et al, 1988), whereas monophosphorylation at Ser19 promotes the formation of smaller less stable filaments (Komatsu and Ikebe, 2004). Consistent with diphosphorylation of MRLC facilitates the formation of thick stable myosin II filaments, diphosphorylated MRLC is mainly localized to SF in the center of both fibroblasts and COS 7 cells (Totsukawa et al, 2000, Komatsu and Ikebe, 2004). Mono- and diphosphorylated MRLC are differently localized in migrating NIH 3T3 fibroblasts, with monophosphorylated species primarily localized at the membrane ruffle area of the leading edge where rapid reorganization of actin occur and generation of force is required, and diphosphorylated MRLC situated at the posterior tail portion where it is thought to be involved in the maintenance of cell morphology and the retraction of the tail region during migration (Komatsu and Ikebe, 2004).
Here, we show that PDGF localizes MRLC to the cell periphery and increases the abundance of Ser19 phosphorylated MRLC in Swiss 3T3 fibroblasts, and that MIR interacts with MRLC, which is diphosphorylated at the SF-promoting activation sites Thr18 and Ser19.
Taken together, these findings suggest that sustained loss of diphosphorylated MRLC by PDGF-induced, MIR-mediated targeted proteolysis prevents the formation of stable myosin II filaments and that increasingly weakened crosslinkage of actin filaments promotes disassembly of existing SF and their associated FA complexes. The disruption of FA structures is likely to be facilitated by the transient, early reduction in the phosphoactivation of FAK we observed in PDGF-stimulated cells (Supplementary Figure 4). Phosphorylation of MRLC at the PKC sites Ser2 and Thr9 has been shown to decrease its affinity for actin (Bengur et al, 1987). While both EGF and PDGF induce strong, early phosphorylation of PKC, the activation of PKC was only sustained in PDGF-treated cells (Supplementary Figure 4), suggesting that the strong and sustained PKC activation may reduce the interactions between myosin and actin filaments in PDGF-stimulated and -costimulated cells.
The specific induction of the MIR E3-ligase, its targeting of diphosphorylated MRLC and the unidirectional nature of proteolytic degradation may thus explain how PDGF is able to control reorganization of actin, reduce adhesion and induce motility even in cells costimulated with ligands that promotes SF formation by diphosphorylation of MRLC, such as EGF and IGF-1. Consistent with the participation of monophosphorylated, rather than diphosphorylated, MRLC in the dynamic turn-over of peripheral actomyosin filaments that leads to membrane ruffling (Totsukawa et al, 2000; Komatsu and Ikebe, 2004), PDGF induced Ser19 phosphorylation and peripheral localization of MRLC in Swiss 3T3 fibroblasts.
Other interpretations are also possible. For example, if myosin II motor activity controls the intracellular traffic of key cytoskeletal regulators or participates in the regulation of their genes, the morphological changes may be induced by PDGF-specific suppression of nuclear MRLC. The role of nuclear MRLC must therefore be determined, before the functional significance of the PDGF-activated Src-hnRNPK-MIR-MRLC pathway can be fully established. The data presented here does not exclude that reorganization of cytosolic actin structures could be secondary to a reduction in nuclear MRLC activity, but the results demonstrate that MIR-mediated MRLC degradation is critical for the establishment of a PDGF-specific motile phenotype in Swiss 3T3 cells.
Recent studies indicate that the hnRNP-K proteins play an important role in different cellular functions ranging from effects on gene transcription, splicing events and protein translation (Ostareck-Lederer et al, 2002; Bomsztyk et al, 2004). hnRNP-K protein contains three K homology domains that mediate binding of RNA and DNA (Bomsztyk et al, 2004). The interaction with mRNA occurs preferentially to RNA sequences containing clusters rich in cytidines (Thisted et al, 2001; Paziewska et al, 2004), and it is noteworthy that such poly-C clusters are present in the 3′-untranslated region of MIR (data not shown). Although the functional significance of these clusters in mediating MIR mRNA binding to hnRNP-K and in controlling MIR translation remains to be analyzed in more detail, it is likely that the association between MIR mRNA and hnRNP-K may serve to stabilize MIR mRNA or to sequester it for rapid translational activation at a specific site of action.
The PDGF-induced interaction between hnRNP-K and MIR transcripts is blocked in cells treated with the Src inhibitor SU6656, indicating the involvement of a Src-kinase family member in this process. PDGF induces hnRNP-K phosphorylation at sites that are not modified in untreated cells or in response to treatment with EGF or IGF-1. This dominant effect of PDGF is again blocked by SU6656, indicating that a Src-kinase is instrumental for phosphorylation of hnRNP-K and the elevation in MIR activity. In accordance with these results, phosphorylation of hnRNP-K by c-Src has previously been shown to regulate translation of hnRNP-K-associated mRNAs (Ostareck-Lederer et al, 2002).
MRLC was found in about one-fourth of nuclei in cells treated with PDGF in the presence of proteasome inhibitors, which represents a more than fivefold increase in frequency compared to cells treated with growth factors and close to the 34% seen in cultures of nontreated cells. The subcellular localization of proteins is often determined by their phosphorylation status and ubiquitination of proteins is frequently instigated via phosphorylation on specific residues, providing a recognition site for a substrate-specific ubiquitin ligase. The N-terminus of MRLC contains a putative nuclear import sequence KKRP at amino acids 11–14 (nuclear localization signal (NLS)) in close proximity to five putative phosphorylation sites (Thr7 (PKA), Thr9 (PKC), Thr10 (PKC, CK1), Thr18 (MLCK, ZIP kinase, Citron kinase, integrin-linked kinase) and Ser19 (MLCK, ZIP kinase, Citron kinase, integrin-linked kinase, ROCK, H4-PK)), but the primary structure contains no evident nuclear export signal. The multitude of putative phosphorylation sites around the NLS provides prime candidates for both guidance of intracellular traffic and regulation of stability. The lack of a nuclear export signal may explain why MRLC accumulates in the nucleus of cells stimulated with PDGF in the presence of proteasome inhibitor, whereas the cytoplasmic level remains unaltered. These findings also suggest that MRLC mainly, if not solely, is degraded via the nuclear UPS- in PDGF-stimulated cells.
Previous studies have shown the involvement of UPS in the regulation of peripheral actin during migration by targeting RhoA for degradation in tumor cell protrusions (Wang et al, 2003). In the present study, we establish a novel role for the UPS during cytoskeletal reorganization, and identify increased turn-over rate of MRLC, facilitated by MIR-mediated ubiquitination as an essential component in the molecular switch by which PDGF instigates and maintains control over the actin–myosin-based contractile system in Swiss 3T3 fibroblasts. By targeting MRLC, which has been modified at phosphorylation sites critical for the formation of SF, MIR enables PDGF to direct the assembly of an elongated, motile cytoskeleton free from the contractile and adhesive restrictions imposed by central SF and FA while simultaneously increasing the peripheral abundance of monophosphorylated MRLC during induction of migration. In keeping with this, inhibition of MIR inducing Src-kinase activity or downregulation of MIR by siRNA inhibited both the initial disassembly of central actin structures and the induction of cell motility, as well as the increased migration and wound-healing potentials observed in response to PDGF. This shows that MIR is a downstream effector for PDGF and essential for its action on the cytoskeleton during fibroblast activation.
Giving the specificity and aptitude for advanced spatiotemporal activity control presented by the new regulatory pathway we here describe in the PDGF-activated signaling network, it is likely that the transduction of other external stimuli use similar signalling cascades to regulate and fine-tune cellular activities through protein destabilization.
Materials and methods
Cell culture, metabolic labelling and preparation of whole-cell lysates
Swiss 3T3 cells were maintained in Dulbecco's modified Eagle's medium (DMEM) (GIBCO) supplemented with 10% fetal bovine serum (FBS), 100 U/ml of penicillin and 100 μg/ml of streptomycin in 5% CO2 at 37°C. To synchronize cells, the 3T3 fibroblasts were subjected to 18 h of starvation, before metabolic labelling. Subconfluent cells were serum-starved in DMEM supplemented with 0.1% FBS for 18 h, and subsequently stimulated with PDGF (50 ng/ml), IGF-1 (100 ng/ml), EGF (100 ng/ml) (PeproTech) or their combinations.
Cells were routinely labelled with [35S]-methionine and -cysteine (0.2 mCi/ml of Promix; Amersham Pharmacia) during the last 3 h of growth factor stimulation, employing 6, 12 and 18 h stimulation periods. In some experiments, cells were cultured in the presence of various inhibitors (10 μM LY294002, 50 μM PD98059, 20 nM PD184352, 1 μM ML-7, 3 μM Y-27632, 1 μM PS-341, 2 μM SU6656, 50 nM rapamycin, 10 ng/ml actinomycin D, 50 μM lactacystin or 10 μg/ml cycloheximide) during the entire time course, while in others, cells were pretreated with inhibitors for 60 min before GF treatment or metabolic labelling.
For [33P]-orthophosphate labelling, synchronized cells grown to 70% confluence were washed twice in phosphate-free DMEM containing 0.1% FBS, incubated for 1 h in the same media and labelled with 0.1 mCi/ml [33P]-orthophosphate for 6 h before short-term GF stimulations. In long-term stimulation experiments (6–18 h), the cells were either incubated with [33P]-orthophosphate during the entire stimulation period or the radioisotope was added to the culture medium after 6 or 12 h. For analysis of the alterations in phosphorylation patterns induced by inhibition of pathway-specific kinases, the cells were grown in the presence of a specific inhibitor or combination of inhibitors for at least 30 min before growth factor treatment (for most short-term stimulation experiments), or the inhibitor was added to the cell cultures 3 h before termination of the GF treatment.
For 2D gel electrophoresis (2DE), cells were routinely lysed in a solution containing 8 M urea, 2 M thiourea, 4% CHAPS, 65 mM dithiothreitol, protease inhibitor cocktail with EDTA (Boehringer Mannheim) and phosphatase inhibitors (1 μM okadaic acid, 5 μM α-cyano-3-phenoxybenzyl α-(4-chlorophenyl) isovalerate and 5 μM potassium bisperoxo (1,10-phenanthroline) oxovanadate). Protein concentrations were determined by the Bradford assay (Pierce).
For analysis of the ubiquitination status of IP proteins, the cells were lysed in a RIPA buffer (PBS plus 1% NP-40, 0.5% DOC, 0.1% SDS, 0.25 μg/ml ubiquitin-aldehyde, plus the above mentioned protease and phosphatase inhibitors). For isolation of MRLC by IP, an antibody directed against the N-terminus of MRLC 2 (Santa-Cruz, sc-9448) was employed in a 1:25 dilution. Immunoreactive proteins were precipitated with Protein G beads and separated by SDS–PAGE. Electrotransfer and staining of proteins was performed according to standard protocols and antibody binding detected by ECL (Amersham Pharmacia).
Two-dimensional gel electrophoresis
2DE separated radiolabelled proteins were electroblotted onto nitrocellulose or PVDF membranes, and scanned by phosphoimaging on a Molecular Imager FX scanner (Biorad). The membranes were subsequently stained by Coomassie or used for immunoblotting. All experiments were repeated with samples from separately stimulated cell cultures, and a total of more than 400 2D gels were processed. Gel image analysis and protein identification by mass spectrometry were performed as described previously (Nagano et al, 2004).
Immunofluorescence
For immunofluorescence, cells were grown on coverslips (Wojciak-Stothard et al, 1998) or in multiwell culture dishes (Entwistle and Noble, 1994). Specimens were visualized with an LSM 510 confocal microscope using a × 40 NA 1.3 Neofluar objective (Zeiss, UK) aligned as described previously (Entwistle and Noble, 1994) or with a Coolview 12 integrating cooled CCD camera (Photonic Science, East Sussex, UK) mounted over an Axiophot microscope fitted with a × 63 NA 1.4 oil-immersion objective (Zeiss, UK). For time-lapse analysis, cells were grown on 35 mm plastic tissue culture dishes and image data sets collected once every 4 min for a period of 22 h with a KP-M1 monochrome video camera (Hitachi Denshi, London, UK) mounted on the side port of an Axiovert 135 microscope (Zeiss, UK) and using Tempus image acquisition software (Kinetic Imaging, Merseyside, UK).
Analysis of hnRNP-K protein-associated MIR-mRNA
Analysis of protein–RNA interaction was essentially performed as described by Klimek-Tomczak et al (2004). Briefly, Swiss 3T3 cells were treated with the different growth factors in the presence or absence of kinase inhibitors. After cell lysis, hnRNP-K protein and associated mRNAs were isolated by immunoprecipitation with anti-hnRNP-K antibody in combination with Protein A beads. Following extensive washing, RNA was eluted from the beads with 100 mM NaCl, 1% (w/v) SDS at 65° for 10 min, phenol purified and ethanol precipitated. RNA that precipitated together with hnRNP-K was then reverse transcribed to cDNA using the Stratascript first-strand synthesis system (Stratagene) and PCR amplified using MIR-specific primers. For control, actin primers were employed with negative result.
Gene silencing by siRNA treatment
siRNAs were generated using the Silencer siRNA construction kit from Ambion. Two siRNAs were synthesized (according to nucleotides 235–255 and 1148–1168 of the mouse sequence of MIR). In addition, scramble constructs were constructed and used as controls. The siRNAs were transfected together into 3T3 fibroblasts using siPORT Amine from Ambion. After incubation for 3 days, the cells were serum starved overnight, and incubated with growth factors as indicated for 18 h. The cells were fixed with 4% PFA, permeabilized with 0.05% Triton-X-100 and stained using anti-MIR antibodies combined with Cy-2-tagged goat-anti-rabbit antibodies and phalloidin–rhodamine. Signals were analyzed with a Zeiss Axioplan2 microscope.
Wound-healing and migration assay
Fibroblasts were transfected either with siMIR or the scramble construct and grown to near confluence. Using a P200 pipette tip, a scratch was made by scraping across the cell layer. A grid was drawn with a pen on the bottom of the plate to facilitate orientation and to ensure that the same areas were evaluated before and after the scratch. Cells were stimulated with PDGF, incubated for 18 h and photographs were made using the grid as orientation. The extent of migration was analyzed by counting the number of cells migrated into the scratched area after 18 h.
Supplementary Material
Legends to Supplementary Figures and data
Supplementary Figures
Supplementary data 1A
Supplementary data 1B
Acknowledgments
We warmly thank Mrs Akunna Akpan, Dr Sarah L. White and Mr Nick Totty for technical assistance, Dr Jerzy Ostrowski for providing antibody against hnRNP K and Drs Julian Adams and Peter J Elliott for providing PS-341. The study was supported by Cancerfonden, Uppsala University and Minerva.
References
- Adams J, Palombella VJ, Sausville EA, Johnson J, Destree A, Lazarus DD, Maas J, Pien CS, Prakash S, Elliott PJ (1999) Proteasome inhibitors: a novel class of potent and effective antitumor agents. Cancer Res 59: 2615–2622 [PubMed] [Google Scholar]
- Bengur AR, Robinson EA, Apella E, Sellers JR (1987) Sequence of the sites phosphorylated by PKC in the smooth muscle myosin light chain. J Biol Chem 262: 7613–7617 [PubMed] [Google Scholar]
- Bockus BJ, Stiles CD (1984) Regulation of cytoskeletal architecture by platelet-derived growth factor, insulin and epidermal growth factor. Exp Cell Res 153: 186–197 [DOI] [PubMed] [Google Scholar]
- Bomsztyk K, Denisenko O, Ostrowski J (2004) hnRNP K: one protein multiple processes. Bioessays 26: 629–638 [DOI] [PubMed] [Google Scholar]
- Bornhauser BC, Olsson P-A, Lindholm D (2003) MSAP is a novel MIR-interacting protein that enhances neurite outgrowth and increases myosin regulatory light chain. J Biol Chem 278: 35412–35420 [DOI] [PubMed] [Google Scholar]
- de Hoog CL, Foster LJ, Mann M (2004) RNA and RNA binding proteins participate in early stages of cell spreading through spreading initiation centers. Cell 117: 649–662 [DOI] [PubMed] [Google Scholar]
- Entwistle A, Noble M (1994) Optimising the performance of confocal laser scanning microscopes over the full field of view. J Microsc 175: 238–251 [Google Scholar]
- Fukata Y, Amano M, Kaibuchi K (2001) Rho-Rho-kinase pathway in smooth muscle contraction and cytoskeletal reorganization of non-muscle cells. Trends Pharmacol Sci 22: 32–39 [DOI] [PubMed] [Google Scholar]
- Hall A (1998) Rho GTPases and the actin cytoskeleton. Science 279: 509–514 [DOI] [PubMed] [Google Scholar]
- Ikebe M, Hartshorne DJ, Elzinga M (1987) Phosphorylation of the 20,000-Dalton light chain of smooth muscle myosin by the calcium-activated, phospholipid-dependent protein kinase. Phosphorylation sites and effects of phosphorylation. J Biol Chem 262: 9569–9573 [PubMed] [Google Scholar]
- Ikebe M, Koretz J, Hartshorne DJ (1988) Effects of phosphorylation of light chain residues threonine 18 and serine 19 on the properties and conformation of smooth muscle myosin. J Biol Chem 263: 6432–6437 [PubMed] [Google Scholar]
- Jimenez C, Portela RA, Mellado M, Rodriguez-Frade JM, Collard J, Serrano A, Martinez-A C, Avila J, Carrera AC (2000) Role of the PI3 K regulatory subunit in the control of actin organization and cell migration. J Cell Biol 151: 249–262 [DOI] [PMC free article] [PubMed] [Google Scholar]
- Kimura K, Ito M, Amano M, Chihara K, Fukata Y, Nakafuku M, Yamamori B, Feng J, Nakano T, Okawa K, Iwamatsu A, Kaibuchi K (1996) Regulation of myosin phosphatase by Rho and Rho-associated kinase (Rho-kinase). Science 273: 245–248 [DOI] [PubMed] [Google Scholar]
- Klimek-Tomczak K, Wyrwicz LS, Jain S, Bomsztyk K, Ostrowski J (2004) Characterization of hnRNP K protein–RNA interactions. J Mol Biol 342: 1131–1141 [DOI] [PubMed] [Google Scholar]
- Komatsu S, Ikebe M (2004) ZIP kinase is responsible for the phosphorylation of myosin II and necessary for cell motility in mammalian fibroblasts. J Cell Biol 165: 243–254 [DOI] [PMC free article] [PubMed] [Google Scholar]
- Kureishi Y, Kobayashi S, Amano M, Kimura K, Kanaide H, Nakano T, Kaibuchi K, Ito M (1997) Rho-associated kinase directly induces smooth muscle contraction through myosin light chain phosphorylation. J Biol Chem 272: 12257–12260 [DOI] [PubMed] [Google Scholar]
- Nagano K, Masters JR, Akpan A, Yang A, Corless S, Wood C, Hastie C, Zvelebil M, Cramer R, Naaby-Hansen S (2004) Differential protein synthesis and expression levels in normal and neoplastic human prostate cells and their regulation by type I and II interferons. Oncogene 23: 1693–1703 [DOI] [PubMed] [Google Scholar]
- Olsson P-A, Korhonen L, Mercer EA, Lindholm D (1999) MIR is a novel ERM-like protein that interacts with myosin regulatory light chain and inhibits neurite outgrowth. J Biol Chem 274: 36288–36292 [DOI] [PubMed] [Google Scholar]
- Ostareck-Lederer A, Ostareck DH, Cans C, Neubauer G, Bomsztyk K, Superti-Furga G, Hentze MW (2002) c-Src-mediated phosphorylation of hnRNP K drives translational activation of specifically silenced mRNAs. Mol Cell Biol 22: 4535–4543 [DOI] [PMC free article] [PubMed] [Google Scholar]
- Paziewska A, Wyrwicz LS, Bujnicki JM, Bomsztyk K, Ostrowski J (2004) Cooperative binding of the hnRNP K three KH domains to mRNA targets. FEBS Lett 577: 134–140 [DOI] [PubMed] [Google Scholar]
- Rankin S, Rozengurt E (1994) Platelet-derived growth factor modulation of focal adhesion kinase (p125FAK) and paxillin tyrosine phosphorylation in Swiss 3T3 cells. Bell-shaped dose response and cross-talk with bombesin. J Biol Chem 269: 704–710 [PubMed] [Google Scholar]
- Ridley AJ, Hall A (1994) Signal transduction pathways regulating Rho-mediated stress fibre formation: requirement for a tyrosine kinase. EMBO J 13: 2600–2610 [DOI] [PMC free article] [PubMed] [Google Scholar]
- Satterwhite LL, Lohka MJ, Wilson KL, Scherson TY, Cisek LJ, Corden JL, Pollard TD (1992) Phosphorylation of myosin-II regulatory light chain by cyclin-p34cdc2: a mechanism for the timing of cytokinesis. J Cell Biol 118: 595–605 [DOI] [PMC free article] [PubMed] [Google Scholar]
- Sellers JR, Pato MD, Adelstein RS (1981) Reversible phosphorylation of smooth muscle myosin, heavy meromyosin, and platelet myosin. J Biol Chem 256: 13137–13142 [PubMed] [Google Scholar]
- Seufferlein T, Rozengurt E (1994) Lysophosphatidic acid stimulates tyrosine phosphorylation of focal adhesion kinase, paxillin, and p130. Signaling pathways and cross-talk with platelet-derived growth factor. J Biol Chem 269: 9345–9351 [PubMed] [Google Scholar]
- Thisted T, Lyakhov DL, Liebhaber SA (2001) Optimized RNA targets of two closely related triple KH domain proteins, heterogeneous nuclear ribonucleoprotein K and alphaCP-2KL, suggest distinct modes of RNA recognition. J Biol Chem 276: 17484–17496 [DOI] [PubMed] [Google Scholar]
- Totsukawa G, Yamakita Y, Yamashiro S, Hartshorne DJ, Sasaki Y, Matsumura F (2000) Distinct roles of ROCK (Rho-kinase) and MRLCK in spatial regulation of MRLC phosphorylation for assembly of stress fibers and focal adhesions in 3T3 fibroblasts. J Cell Biol 150: 797–806 [DOI] [PMC free article] [PubMed] [Google Scholar]
- Wang HR, Zhang Y, Ozdamar B, Ogunjimi AA, Alexandrova E, Thomsen GH, Wrana JL (2003) Regulation of cell polarity and protrusion formation by targeting RhoA for degradation. Science 302: 1775–1779 [DOI] [PubMed] [Google Scholar]
- Wennstrom S, Hawkins P, Cooke F, Hara K, Yonezawa K, Kasuga M, Jackson T, Claesson-Welsh L, Stephens L (1994) Activation of phosphoinositide 3-kinase is required for PDGF-stimulated membrane ruffling. Curr Biol 4: 385–393 [DOI] [PubMed] [Google Scholar]
- Wojciak-Stothard B, Entwistle A, Garg R, Ridley AJ (1998) Regulation of TNF-alpha-induced reorganization of the actin cytoskeleton and cell-cell junctions by Rho, Rac, and Cdc42 in human endothelial cells. J Cell Physiol 176: 150–165 [DOI] [PubMed] [Google Scholar]
Associated Data
This section collects any data citations, data availability statements, or supplementary materials included in this article.
Supplementary Materials
Legends to Supplementary Figures and data
Supplementary Figures
Supplementary data 1A
Supplementary data 1B