

Abstract
Fourier-transform infrared microspectroscopy (FTIRM) allows analysis of mineral content, mineral crystal maturity and mineral composition at ∼10-μ spatial resolution. Previous FTIRM analyses comparing 4-μ thick sections from non-decalcified iliac crest biopsies from women with post-menopausal osteoporosis, as contrasted with iliac crest tissue from individuals without evidence of metabolic bone disease, demonstrated significant differences in average mineral content (decreased in osteoporosis) and mineral crystal size/perfection (increased in osteoporosis). More importantly, these parameters, which vary throughout the tissue in relation to the tissue age in healthy bone, showed no such variation in bone biopsies from patients with osteoporosis. The present study compares the spatial and temporal variation in mineral quantity and properties in trabecular bone in high- and low-turnover osteoporosis. Specifically, six biopsies from women (n=5) and one man with high-turnover osteoporosis (age range 39–77) and four women and two men with low turnover osteoporosis (age range 37–63) were compared to ten “normal” biopsies from three men and seven woman (age range: 27–69). “High turnover” was defined as the presence of increased resorptive surface, higher than normal numbers of osteoclasts and greater than or equal to normal osteoblastic activity. “Low turnover” was defined as lower than normal resorptive surface, decreased osteoclast number and less than normal osteoblastic activity. Comparing variations in FTIR-derived values for each of the parameters measured at the surfaces of the trabecular bone to the maximum value observed in multiple trabeculae from each person, the high-turnover samples showed little change in the mineral: matrix ratio, carbonate: amide I ratio, crystallinity and acid phosphate content. The low-turnover samples also showed little change in these parameters, but in contrast to the high-turnover samples, the low-turnover samples showed a slight increase in these parameters, indicative of retarded, but existent resorption and formation. These data indicate that FTIR microspectroscopy can provide quantitative information on mineral changes in osteoporosis that are consistent with proposed mechanisms of bone loss.
Keywords: FTIR microspectroscopy, High-turnover osteoporosis, Low-turnover osteoporosis, Mineral content, Mineral crystallinity, Trabecular bone
Introduction
Bone quality has been defined as the “material, architectural, and mechanical characteristics which in addition to bone mass contribute to bone strength” [1]. Among the material properties that must be considered are the amount and characteristics of both the organic matrix and the mineral [2, 3, 4, 5]. Fourier transform infrared microspectroscopy (FTIRM) and infrared imaging (FTIRI) have been used to characterize the changes that occur in the mineral and matrix components of iliac crest biopsies obtained from post-menopausal osteoporotic woman and normal controls [6, 7, 8, 9, 10]. According to published studies using FTIR, in control, non-osteoporotic tissues there is a reproducible pattern of mineral maturation, increasing from the center to the periphery of a cortical osteon and from the surface to the deeper region of individual trabeculae. However, in osteoporotic tissues, these variations are not generally seen [6, 7]. Furthermore, the average mineral content is decreased in the osteoporotic trabeculae [7], while the mineral crystallinity and collagen maturity are increased [7, 8, 9, 10].
The rapid bone loss in high-turnover osteoporosis (due to estrogen deficiency or to prolonged steroid therapy [11]) may result in different changes in mineral composition than the slower, low-turnover osteoporosis such as that seen in prolonged disuse [12], in older men [13] or in inherited variants. The purpose of this study was to test the hypothesis that the spatial and temporal variations in mineral characteristics in individuals with low- and high-turnover osteoporosis are distinct and may contribute to the reported differences in the bone mineral density, the risk of multiple fractures and the response to therapies in these two forms of osteoporosis [14, 15].
Materials and methods
Materials
Under an IRB-approved protocol, 16 PMMA-embedded iliac crest bone biopsies from osteoporotic patients and normal controls were selected randomly from the Histomorphometry Data Base at the Hospital for Special Surgery. Six additional biopsies provided by Dr. Dempster (Helen Hayes Hospital, N.Y.) from blocks used in a previously published study [16] were used for the analyses. These biopsied tissues had been diagnosed as “high” or “active” osteoporosis (n=6) and “low” or “inactive” osteoporosis (n=6) or as normal (n=10) based on a combination of histological and histomorphometric parameters evaluated at the time of initial diagnostic assessment. Biopsy samples considered to be high-turnover were defined as showing increased remodeling activity as demonstrated by the presence of increased resorptive activity (increased resorptive surface and a higher than normal number of osteoclasts) and the presence of normal or increased osteoblastic activity. There were six patients in this group, five women (age range 39–77) and one male (age 40). Biopsy samples considered to be low-turnover were defined as showing reduced remodeling activity as demonstrated by the presence of reduced resorptive activity (decreased resorptive surface, increased inactive eroded surface and decreased osteoclast number) and lower than normal osteoblastic activity. There were also six patients in this group, four female (age range 52–63) and two males (ages 37 and 40). None of the patients had been treated with anti-resorptive therapies. The control samples came from seven females (ages 27–61) and three males (age range 44–69). All the osteoporotic patients had sustained at least one fracture, but the total number of fractures and the fracture site(s) were not retrievable from the data base.
Specimens of high and low turnover osteoporosis and normal controls were assigned code numbers and analyzed in a blinded fashion. The specimens had been processed (undecalcified) by being embedded in polymethyl methacrylate (PMMA). Although this resin absorbs in the IR region (1,080 and 1,040 cm−1), previous studies have indicated that penetration into mineralized tissue is minimal [17], but there is extensive penetration into soft tissues. In an earlier study [6] the spectral contribution of PMMA to the mineral phosphate band was minimized by dissolving the PMMA in acetone, resulting in loss of trabecular bone in osteoporotic cases. Thus, for the present study, the PMMA was not removed. Instead, spectral subtraction was used to correct for the contribution of PMMA [17]. Approximately 15 sections (3–5-um thick) were cut from each block. Every third section was used for analysis. Since the site of most active bone loss in osteoporosis is in the trabeculae, only trabeculae were examined in this study. Based on an earlier investigation in which 15 spectra were collected from 3 trabeculae [7] in osteoporotic and control patients a power study was used to estimate that 5 trabeculae per patient should be examined to detect differences among the three groups.
Methods
Acquisition of spectra and analysis of interferrograms
Sections were placed on barium fluoride windows (SpectraTec, Ardsley, N.Y.) for spectral acquisition. Spectra were recorded either with a UMA 500 Fourier transform infrared microscope with a motorized xy stage, coupled to an FTS-40 spectrometer (both from Bio-Rad Inc., Cambridge, Mass.) or a Perkin-Elmer Spot-Light Imaging Spectrometer (Shelton, Conn.) at a resolution of 4 cm−1, 1,024 scans, in the transmission mode. The areas of each spectroscopic analysis were 20×20 μm2 for the BioRad analyses and 25×25 μm2 for the Perkin-Elmer analyses. Trabecular bone was analyzed through the acquisition of serial overlapping spectra in 10-μm steps, both parallel and perpendicular to the long axis of each trabecula. At least 10 spectra were collected from 5 trabeculae per block and were analyzed based on previous studies in which 15 spectra from 3 sections were found to give reproducible data with significant differences between osteoporotic and normal cases [7]. IR interference from vapor in the spectrometer and residual embedding agent in the samples was removed by spectral subtraction using a reference spectrum of PMMA collected from spatial regions adjacent to the tissue. The 1,024 interferograms collected per site were co-added at 4 cm−1 spectral resolution, fast Fourier transformed, ratioed against a background spectrum and converted to absorbance. Data were calculated using a combination of software (GRAMS-386, Galactic Industries Corporation, Salem, N.H.), Win-IR Pro (BioRad), ORIGIN (Microcalc Software, Northampton, Mass.) and public domain software from the University of Toronto.
Parameters generated from FTIRM
Following data acquisition, the spectra were baseline-corrected, and the following parameters calculated: mineral: matrix ratios (integrated areas of the phosphate and amide I peaks, respectively); carbonate: phosphate and carbonate: amide I ratios [integrated areas of the carbonate v2 band (855–890 cm−1) to the phosphate v1, v3 or amide I band], mineral crystallinity (based on curve fitting of the base-lined phosphate peak and calculation of the ratio of the 1,030 to 1,020 cm−1 sub-band areas) [6, 7, 8, 9]. In brief, the phosphate peak was baseline-corrected and second derivative spectra were calculated in an effort to isolate the underlying peaks that constitute the broad, relatively featureless contour of this peak. The peak positions in the second derivative spectra were recorded and utilized as initial input. The output of this analysis was expressed as relative peak area and peak position. Additionally, the percent area of the 1,120 cm−1 subband was used to estimate acid phosphate content (expressed as 1,120 cm−1/960 cm−1 ratio). This parameter was validated using a series of apatites synthesized at different pH values in which the splitting of the phosphate v2 peak was used to determine the actual acid phosphate contribution [16].
Data analysis and statistics
Univariate analyses of all parameters were performed using Instat Software (Graphpad Instat, Carlsbad, Calif.). Mean and standard deviations for each parameter in multiple sections from each subject were tabulated. Comparisons of means using ANOVA were performed with significance as P≤0.05. The coefficient of variation (standard deviation/mean) was calculated for each parameter in each individual and the data summarized as the mean and standard deviations for each group. Since sample size was small and could not be assumed to be Gaussian, non-parametric tests (Kruskal-Wallis) were used to compare the average values from multiple patients. Because trabeculae vary in size, shape and thickness, data were normalized for each patient by calculating the percentage change in any given parameter between 20–25 um from the formative edge (identified as the minimum value of mineral: matrix ratio) to the maximum.
Results
A typical processed infrared spectrum obtained from the center of a trabecula in a high-turnover sample and indicating the peaks used for the analyses in these studies is presented in Fig. 1. The contributions of PMMA (based on the spectrally isolated PMMA C=O mode near 1,728 cm−1) and water vapor have been spectrally subtracted from the spectrum.
Fig. 1.
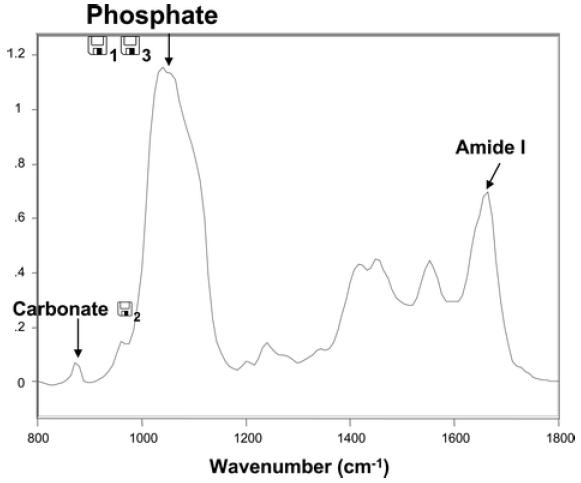
FTIRM of trabecular bone in high osteoporosis. The protein amide I, phosphate v1, v3 and carbonate v2 bands used for the analyses described in the paper are indicated
The integrated areas of the phosphate v1, v3 and amide I bands were used to calculate the mineral-to-matrix ratios at each site sampled in the biopsies. Figure 2a compares these values across four trabeculae in the same biopsy of one of the controls. As can be seen, the absolute values for mineral: matrix are different; however, for each there is a significant increase going from the edge of the trabeculae towards the center. When the percent difference from 20 um to the maximum was calculated for the six trabeculae examined in this case, the variations were in good agreement. Figure 2b presents similar data from trabeculae in a high-turnover sample that showed little such variation, and Fig. 2c shows data from a low-turnover sample. Similar variations were found for each of the parameters examined. Figure 2e-g shows the variation in the in the crystallinity parameter, and Fig. 2h-j the variations in the carbonate: amide I ratio for the three representative cases.
Fig. 2.
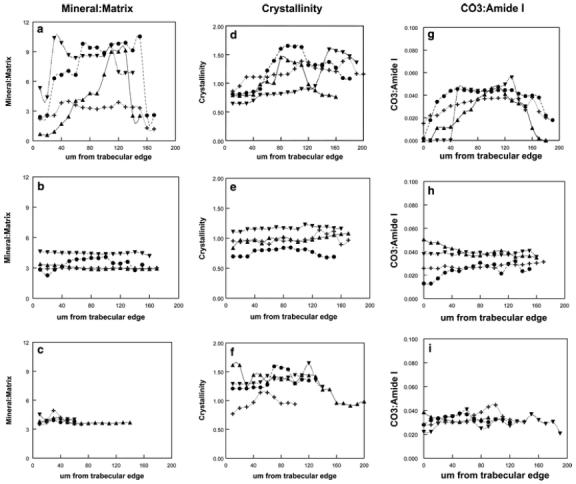
Linear variations in individual trabeculae of a single biopsy showing changes in mineral properties along the center of the trabeculae for mineral: matrix, carbonate: amide I and crystallinity. In the three groups studied: A normal; B high turnover; C low turnover
Global averages for the IR parameters measured in each biopsy were calculated and are included in Table 1. When all the data for each group of cases were compared relative to the normal samples, the mean mineral: matrix ratio was significantly reduced for high-turnover samples (P<0.01), but not for the low-turnover ones; the mean carbonate: amide I or carbonate: phosphate data were not significantly different, the mean crystallinity was significantly increased in both low- and high-turnover cases, and the mean acid phosphate content was not significantly different.
Table 1.
Global averages of FTIR parameters
| Parameter | Normal | SD | High Turnover | SD | Low Turnover | SD |
|---|---|---|---|---|---|---|
| (n=10) | (n=6) | (n=6) | ||||
| Mineral: matrix | 3.95 | 0.52 | 2.91 | 0.35** | 3.67 | 0.27 |
| Carbonate: phosphate | 0.0097 | 0.005 | 0.0105 | 0.0019 | 0.0094 | 0.0017 |
| Carbonate: amide I | 0.034 | 0.018 | 0.0300 | 0.006 | 0.0350 | 0.0005 |
| 1,030:1,020 peak area ratio | 1.069 | .091 | 1.585 | 0.18** | 1.313 | 0.270* |
| 1,112:960 peak area ratio | 3.82 | 1.70 | 4.94 | 1.6 | 3.32 | 1.20 |
The data from individual spectra in all tissues examined for each patient (n) were averaged and compared by one-way ANOVA. The parameters differ significantly from the normal data (*P<0.05, **P<0.01) using a Dunnett's test. The 1,030:1,020 peak area ratio indicates crystallinity (particle size and perfection), the 1,112:960 peak area ratio is related to acid phosphate content
Because of the heterogeneity within and between individual trabeculae, we calculated the coefficient of variation (SD/mean) for each individual (rather than for the global average), and these data are presented as the mean ± SD for each parameter in each diagnosis group in Fig. 3a. Additionally, because some of the heterogeneity was related to where the lines were drawn across the trabeculae, the mean percent changes in each series of spectra across the trabeculae from the surface to the maximum value for all parameters for the high-turnover, low-turnover and control cases are compared in Fig. 3b. In the case of mineral: matrix ratio, controls showed a variation of 46%, whereas the low turnover cases were 16% and the high-turnover 5%. The differences between the mineral: matrix ratio between the normal and the osteoporotic samples were highly significant (P<0.001), while there was only a non-significant trend for the high-turnover samples to show smaller differences than the low-turnover samples (P=0.06). The variations for mineral crystallinity, defined as the peak area ratio of subbands at 1,030 and 1,020 cm−1, respectively, showed a similar pattern. Carbonate: amide I and carbonate: phosphate (not shown) ratio variations again were greatest in the normal controls and smallest in the high-turnover samples. The same was true for the acid phosphate content.
Fig. 3.
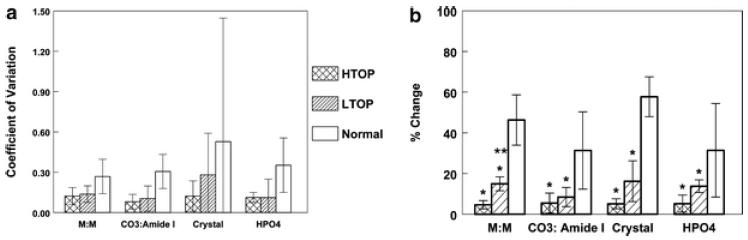
Variation in spectroscopic parameters in normal, high-turnover (HTOP) and low-turnover (LTOP) osteoporotic samples is demonstrated by A coefficient of variation for each of the parameters measured; M:M = mineral/matrix ratio, CO3/amide I = carbonate substitution normalized per total protein; crystal =1,030/1,020 intensity ratio, an index of crystallinity, and HPO4 = acid phosphate content. Each bar shows the mean value ± SD for all patients in each group or B percent change from 20 um from the forming edge to the maximum value for each parameter: the same parameters. In B, *comparisons to control are significant at P<0.05; ** comparison to HTOP has P>−0.06
To validate the acid phosphate ratio as a measure of acid content, synthetic hydroxyapatite prepared at different pHs were analyzed as KBr pellets and the v4 phosphate band curve-fit to determine acid phosphate content [18], and this was compared to the 1,112/960 ratio (Fig. 4).
Fig. 4.
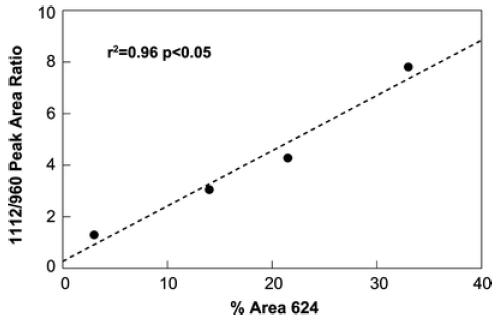
Validation of the curve-fit 1,112 cm−1/960 cm−1 peak area ratio using synthetic calcium phosphates: the ratio is compared to curve-fit data for the phosphate v2 band
To determine the correlation of IR parameters and see how they varied with mineral: matrix ratio for each case, parameters obtained in each of the individual spectra were each plotted against this ratio. Data for high-turnover, low-turnover and normal groups are plotted with different symbols, but the regression parameters were similar. The carbonate: amide I was highly correlated with mineral content (r=0.86) (Fig. 5a); crystallinity was also correlated (r=0.62) (Fig. 5b), but the correlation with acid phosphate content was weak (r=0.48) (Fig. 5c). However, all these correlations were significant (P<0.05).
Fig. 5.
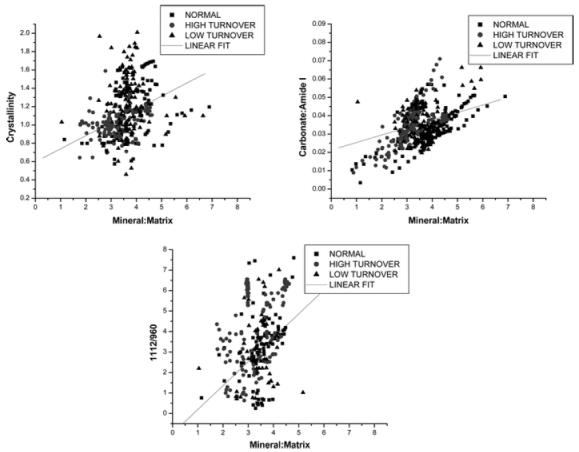
Several mineral parameters are highly correlated with mineral: matrix ratio. Closed circles are normals, open circles are high-turnover cases, and open triangles are low-turnover cases
Discussion
It is generally understood that the amount of bone an individual has is determined by the balance between the activity of the osteoclasts and the osteoblasts. In all cases of osteoporosis, the resultant decrease in the amount of bone stems from the fact that resorptive (osteoclastic) activity occurs at a rate that cannot be matched by the formative (osteoblastic) activity, regardless of the degree of formative activity. As implied by the name, “high turnover” or active osteoporosis is characterized by rapid loss of bone due to increased osteoclastic activity regardless of the activity of the osteoblasts, which may be normal or even increased. It is for this reason that therapies directed at suppressing osteoclastic activity or accelerating osteoclastic apoptosis such as the use of bisphosphonates or calcitonin may be effective in cases of osteoporosis that are characterized by increased osteoclastic activity [14, 19], while leaving the osteoblasts to act on their own without specific intervention in the expectation that they will be able to lay down new bone matrix, which might mineralize properly. Low-turnover osteoporosis (or inactive osteoporosis) is characterized by reduced formative activity, with usually reduced resorptive activity as well, resulting in the failure to maintain an appropriate matrix. In this reduced metabolic state, fewer new crystals are formed, and those present in the tissue on average are larger because of the decreased rate of removal of existing bone. It is for this reason that therapeutic agents directed at stimulating the formative activity of osteoblasts are generally used in these low-turnover states [19, 20], and that agents designed to reduce resorptive activity appear to have little effect [20].
Given that the result of both types of osteoporosis (high-turnover and low-turnover or active and inactive) is reduced bone mass and given the shift in emphasis away from a simple assessment of the bone mass and toward bone quality, it seems reasonable to suspect that the bone present in the two accepted “types” of osteoporosis differ from each other and from normal bone in ways that do not strictly correspond to the amount of bone present. It is for this reason that we chose to apply the techniques of FTIRM to the study of these two conditions.
This study demonstrated tissue-age-dependent changes in all measured parameters progressing from the surface into the deeper regions of the trabeculae in the normal samples. In contrast, only slight changes in all parameters were found in the osteoporotic samples. While there were detectable changes in low-turnover biopsies, in high-turnover biopsies changes were minimal. In addition, the average sizes of crystals from all measured regions were greatest in the high-turnover cases, smaller in the low-turnover cases and smallest in the normal biopsies, consistent with the view that the high-turnover bone is older on average than the other samples. This is in agreement with our recent report [10] that collagen maturity is also greatest in the high-turnover cases, again indicating that this is the oldest bone. Larger crystals, decreased collagen flexibility (associated with increased cross-linking) and decreased mineral content are qualities of bone that are time-dependent, changing in relation to the age and “maturity” of the deposited matrix, and all play a role in making the bone more fragile [5, 21]. We speculate that the differences between samples from normal individuals and from cases of both types of osteoporosis can be explained by the variations in the rates of formation and resorption apparent in the normal and abnormal biopsies. In the normal individual, bone formation and bone resorption are coupled and balanced, leading to maintenance of bone mass. This consistent balanced remodeling results in a broad “age” distribution of the mineral and matrix properties because, in a normally remodeling skeleton, the formation of new bone, with its lower mineral content, smaller crystals and lesser carbonate content, and the removal of bone of any age, results in a consistent pattern for the “age” distribution of these matrix qualities.
In the cases of osteoporosis, whether high- or low-turnover, the rate of removal always exceeds the rate of formation, which is itself rarely increased. This imbalance toward reduced production of “younger” bone matrix in favor of increased removal of more “mature” matrix narrows the tissue-age distribution and results in a higher proportion of “mature” matrix in both conditions, explaining why there is less difference between the two types of osteoporosis and a greater difference between them both and normal tissue. It is further suggested that a broad distribution of these matrix qualities, as is seen in normal healthy bone, results in a less fragile structure
It is important to comment on the correlations that were observed among the FTIR parameters from multiple spectra in all bones. As the mineral content increased in both osteoporotic and normal samples, the relative amount of carbonate substitution increased. This implies that the carbonate incorporation into the apatite lattice is increasing; the acid phosphate content changed very little, increasing slightly, suggesting that in the older mineral there are few carbonate substitutes for acid phosphate [18]. This is in agreement with Raman imaging data on developing bone [23] and infrared data on subchondral bone in monkeys with osteoarthritis [21]. The positive correlations between mineral content and crystallinity and crystallinity and collagen maturity were previously for mouse bone [24].
In conclusion, this study, while based on a small and heterogeneous collection of biopsies, has demonstrated that infrared microspectroscopy can distinguish not only between normal and osteoporotic bone when biopsies from similar sites are compared, but also that high- and low-turnover osteoporosis can be compared. While this information is also obtainable from bone markers [19, 20], in the future when selecting therapies, infrared analyses of pre-treatment biopsies may provide additional insight into the disease mechanism, allowing investigators to target drugs to suppress osteoclasts or stimulate osteoblasts. To validate the speculations about the importance of bone having a broad distribution of mineral and matrix properties to provide optimal mechanical strength, larger sample sizes and parallel mechanical evaluation will be required.
Acknowledgments
This study was supported by NIH grants AR 041325 and AR046505. This investigation was conducted in a facility constructed with support from Research Facilities Improvement Program Grant C)6-RR12538 from the National Center for Research Resources, NIH. The authors would like to thank the staff of the Pathology Department at the Hospital for Special Surgery for their assistance in obtaining the biopsies.
Contributor Information
E. Paschalis, Mineralized Tissue Laboratory Program in Musculoskeletal Integrity, Hospital for Special Surgery, 535 East 70th Street, New York, NY 10021, USA Hanusch Krankhause, Vienna, Austria.
E. DiCarlo, Department of Pathology, Hospital for Special Surgery, New York, NY, USA
Richard Mendelsohn, Department of Chemistry, Rutgers University, Newark, NJ, USA.
References
- 1.Sherman S, Hadley EC. Aging and bone quality: an under explored frontier. Calcif Tissues Int. 1993;53:S1. doi: 10.1007/BF01673392. [DOI] [PubMed] [Google Scholar]
- 2.Burstein AH, Zika JM, Heiple KG, Klein L. Contribution of collagen and mineral to the elastic-plastic properties of bone. J Bone Joint Surg. 1975;57A:956–961. [PubMed] [Google Scholar]
- 3.Martin RB, Ishida J. The relative effects of collagen fiber orientation, porosity, density, and mineralization on bone strength. J Biomech. 1989;22:419–426. doi: 10.1016/0021-9290(89)90202-9. [DOI] [PubMed] [Google Scholar]
- 4.Currey JD. Effects of differences in mineralization on the mechanical properties of bone. Phil Tran R Soc London. 1984;B304:509–518. doi: 10.1098/rstb.1984.0042. [DOI] [PubMed] [Google Scholar]
- 5.Chatterji S, Wall JC, Jeffrey JW. Age-related changes in the orientation and particle size of the mineral phase in human femoral cortical bone. Calcif Tissue Int . 1981;33:567–574. doi: 10.1007/BF02409493. [DOI] [PubMed] [Google Scholar]
- 6.Paschalis EP, Betts F, DiCarlo E, Mendelsohn R, Boskey AL. FTIR microspectroscopic analysis of human iliac crest biopsies from untreated osteoporotic bone. Calcif Tissues Int. 1997;61:487–492. doi: 10.1007/s002239900372. [DOI] [PubMed] [Google Scholar]
- 7.Gadeleta SJ, Boskey AL, Paschalis E, Carlson C, Menschik F, Baldini T, Peterson M, Rimnac CM. A physical, chemical, and mechanical study of lumbar vertebrae from normal, ovariectomized, and nandrolone decanoate-treated cynomolgus monkeys (Macaca fascicularis) Bone. 2000;27:541–550. doi: 10.1016/s8756-3282(00)00362-8. [DOI] [PubMed] [Google Scholar]
- 8.Paschalis EP, Boskey AL, Kassem M, Eriksen EF. Effect of hormone replacement therapy on bone quality in early postmenopausal women. J Bone Mineral Res. 2003;18:955–959. doi: 10.1359/jbmr.2003.18.6.955. [DOI] [PubMed] [Google Scholar]
- 9.Ou-Yang H, Paschalis EP, Boskey AL, Mendelsohn R. Chemical structure-based 3D reconstruction of human cortical bone from 2D-IR images. Appl Spectrosc. 2002;56:419–422. [Google Scholar]
- 10.Paschalis EP, Shane E, Lyritis G, Skarantavos G, Mendelsohn R, Boskey A. Bone fragility and collagen cross-links. J Bone Min Res. 2004;19:2000–2004. doi: 10.1359/JBMR.040820. [DOI] [PMC free article] [PubMed] [Google Scholar]
- 11.Aringer M, Vierhapper H, Graninger MT, Bernecker P, Smolen JS, Pietschmann P. Successful treatment of high turnover osteoporosis in a patient with adrenocortical insufficiency. Wien Klin Wochenschr. 2000;112:334–337. [PubMed] [Google Scholar]
- 12.Wronski TJ, Morey-Holton ER. Skeletal response to simulated weightlessness : a comparison of suspension techniques. Aviat Space Environ Med. 1987;58:63–68. [PubMed] [Google Scholar]
- 13.Delichasios HK, Lane JM, Rivlin RS. Bone histomorphometry in men with spinal osteoporosis. Calcif Tissue Int. 1995;56:359–363. doi: 10.1007/BF00301602. [DOI] [PubMed] [Google Scholar]
- 14.De Leo V, Ditto A, la Marca A, Lanzetta D, Massafra C, Morgante G. Bone mineral density and biochemical markers of bone turnover in peri- and postmenopausal women. Calcif Tissue Int. 2000;66:263–267. doi: 10.1007/s002230010053. [DOI] [PubMed] [Google Scholar]
- 15.Coco M, Glicklich D, Faugere MC, Burris L, Bognar I, Durkin P, Tellis V, Greenstein S, Schechner R, Figueroa K, McDonough P, Wang G, Malluche H. Prevention of bone loss in renal transplant recipients: a prospective, randomized trial of intravenous pamidronate. J Am Soc Nephrol. 2003;14:2669–2676. doi: 10.1097/01.asn.0000087092.53894.80. [DOI] [PubMed] [Google Scholar]
- 16.Parisien M, Cosman F, Morgan D, Schnitzer M, Liang X, Nieves J, Forese L, Luckey M, Meier D, Shen V, Lindsay R, Dempster DW. Histomorphometric assessment of bone mass, structure, and remodeling: a comparison between healthy black and white premenopausal women. J Bone Miner Res. 1997;12:948–957. doi: 10.1359/jbmr.1997.12.6.948. [DOI] [PubMed] [Google Scholar]
- 17.Aparicio S, Doty SB, Camacho NP, Paschalis EP, Spevak L, Mendelsohn R, Boskey AL. Optimal methods for processing mineralized tissues for Fourier transform infrared microspectroscopy. Calcif Tissue Int. 2002;70:422–429. doi: 10.1007/s00223-001-1016-z. [DOI] [PubMed] [Google Scholar]
- 18.Rey C, Collins B, Goehl T, Dickson IR, Glimcher MJ. The carbonate environment in bone mineral: a resolution-enhanced Fourier transform infrared spectroscopy study. Calcif Tissue Int. 1989;45:157–164. doi: 10.1007/BF02556059. [DOI] [PubMed] [Google Scholar]
- 19.Mehl B, Delling G, Schlindwein I, Heilmann P, Voia C, Ziegler R, Nawroth P, Kasperk C. Do markers of bone metabolism reflect the presence of a high- or low-turnover state of bone metabolism? Med Klin (Munich) 2002;97:588–594. doi: 10.1007/s00063-002-1199-8. [DOI] [PubMed] [Google Scholar]
- 20.Christiansen P. The skeleton in primary hyperparathyroidism: a review focusing on bone remodeling, structure, mass, and fracture. APMIS. 2001;102(Suppl):1–52. [PubMed] [Google Scholar]
- 21.Miller LM, Novatt JT, Hamerman D, Carlson CS. Alterations in mineral composition observed in osteoarthritic joints of cynomolgus monkeys. Bone. 2004;35:498–506. doi: 10.1016/j.bone.2004.03.034. [DOI] [PubMed] [Google Scholar]
- 22.Xu HH, Eichmiller FC, Barndt PR. Effect of fiber length and volume fraction on the reinforcement of calcium phosphate cement. J Mater Sci Mater Med. 2001;12:57–65. doi: 10.1023/a:1026753020208. [DOI] [PubMed] [Google Scholar]
- 23.Tarnowski CP, Ignelzi MA, jr, Morris MD. Mineralization of developing mouse calvaria as revealed by Raman microspectroscopy. J Bone Miner Res. 2002;17:1118–1126. doi: 10.1359/jbmr.2002.17.6.1118. [DOI] [PubMed] [Google Scholar]
- 24.Blank RD, Baldini TH, Kaufman M, Bailey S, Gupta R, Yershov Y, Boskey AL, Coppersmith SN, Demant P, Paschalis EP. Spectroscopically determined collagen Pyr/deH-DHLNL cross-link ratio and crystallinity indices differ markedly in recombinant congenic mice with divergent calculated bone tissue strength. Connect Tissue Res. 2003;44:134–142. doi: 10.1080/03008200390223918. [DOI] [PubMed] [Google Scholar]