

Abstract
Large-scale genome arrangement plays an important role in bacterial genome evolution. A substantial number of genes can be inserted into, deleted from, or rearranged within genomes during evolution. Detecting or inferring gene insertions/deletions is of interest because such information provides insights into bacterial genome evolution and speciation. However, efficient inference of genome events is difficult because genome comparisons alone do not generally supply enough information to distinguish insertions, deletions, and other rearrangements. In this study, homologous genes from the complete genomes of 13 closely related bacteria were examined. The presence or absence of genes from each genome was cataloged, and a maximum likelihood method was used to infer insertion/deletion rates according to the phylogenetic history of the taxa. It was found that whole gene insertions/deletions in genomes occur at rates comparable to or greater than the rate of nucleotide substitution and that higher insertion/deletion rates are often inferred to be present at the tips of the phylogeny with lower rates on more ancient interior branches. Recently transferred genes are under faster and relaxed evolution compared with more ancient genes. Together, this implies that many of the lineage-specific insertions are lost quickly during evolution and that perhaps a few of the genes inserted by lateral transfer are niche specific.
Gene insertions and deletions, together with gene inversions and translocations, play important roles in shaping bacterial genomes (Itaya 1997; Brunder and Karch 2000; Tillier and Collins 2000; Liu et al. 2002; Kuwahara et al. 2004; Cerdeno-Tarraga et al. 2005), and gene insertions and deletions, in particular, are essential driving forces that influence gene content (Ochman and Jones 2000; Kunin and Ouzounis 2003; Mirkin et al. 2003). It is clear that a large number of insertions/deletions can be observed in many bacterial species (Mirkin et al. 2003; Hao and Golding 2004) even though they may be comparatively rare in some endosymbiotic bacteria (Silva et al. 2003). The portion of insertions and deletions in a genome, therefore, varies among different species (Garcia-Vallvé et al. 2000).
Gene insertions and deletions can be inferred by examining the presence or absence of a gene (or a gene family) on a phylogenetic tree. In some recent studies, the parsimony method has been used to infer insertions/deletions (Daubin et al. 2003a, b; Mirkin et al. 2003; Hao and Golding 2004). Gene insertions have been distinguished as gene genesis (birth) or lateral gene transfers (LGT), and insertions/deletions have been tested with varying penalties for LGTs in different methodologies (Snel et al. 2002; Kunin and Ouzounis 2003; McLysaght et al. 2003). However, the inference of insertions/deletions is difficult because of the possibility of parallel deletions and insertions on multiple branches (Copley and Dhillon 2002; Snel et al. 2002; Stoebel 2005) and because of variable evolutionary rates of change on different branches (Hao and Golding 2004). Furthermore, the parsimony method is well known to underestimate the number of events in phylogeny reconstruction (Galtier and Boursot 2000; Dean et al. 2002; Felsenstein 2004).
Likelihood analysis has been successfully used to reconstruct phylogenies using sequence data since its first application by Neyman (Neyman 1971; Felsenstein 1988, 1989, 2004; Gu 2001). Maximum likelihood analyses have also been applied to the study of genome content (Gu and Zhang 2004; Huson and Steel 2004), and the phyletic pattern of gene presence/absence has been used to reconstruct evolutionary history in a Markov analysis (Lake and Rivera 2004). In this study, a maximum likelihood method is used to infer insertion/deletion rates on the phylogeny of the Bacillaceae group of Gram-positive bacteria. An advantage of this group is the large number of genomes that have been completely sequenced.
For the likelihood analysis, the insertion rate was assumed to be equal to the deletion rate on each branch, but insertion/deletion rates could vary among different branches or in different parts of the phylogeny. These results suggest that recently transferred genes are more common. If this is to be an evolutionarily stable situation, it suggests that many laterally transferred genes are more likely to have a high propensity of being deleted quickly after transfer. The rates of insertion/deletion from the maximum likelihood analysis were compared to observed nucleotide substitution rates and found to be of a comparable or larger rate; the rates inferred increase at the tips of the phylogeny.
Results
The maximum likelihood analysis used the phylogeny of concatenated DNA sequences from the genes gmk, glpF, and pycA (Fig. 1) and inferred the relative insertion/deletion rates by assuming that individual insertion and deletion events occur independently (this model also assumes that genes can be regained multiple times after having been deleted). Initially, a single constant insertion/deletion rate was assumed on the phylogeny (Case 1 in Fig. 2) using the observed gene presence/absence patterns (Table 1). The likelihood function for this model is a simple continuous function for the chosen parameter ranges, and there is a smooth continuous change of the likelihood as the insertion/deletion rates change (Fig. 3). The insertion/deletion rate that gives the maximum likelihood value in this case is 0.51.
Figure 1.

Bayesian tree obtained for the concatenated sequence of gmk, glpF, and pycA genes. The abbreviations are (Ba1) Bacillus anthracis Ames; (Ba2) Bacillus anthracis “Ames Ancestor”; (Ba3) Bacillus anthracis Sterne; (Bt) Bacillus thuringiensis; (Bc1) Bacillus cereus ZK; (Bc2) Bacillus cereus ATCC 10,987; (Bc3) Bacillus cereus ATCC 14,579; (Gk) Geobacillus kaustophilus; (Bl) Bacillus licheniformis; (Bs) Bacillus subtilis; (Bk) Bacillus clausii; (Bh) Bacillus halodurans; and (Oi) Oceanobacillus iheyensis.
Figure 2.

Different insertion/deletion rates were assumed on the phylogeny. The rate on the branches of the Bc group is α (boxed), the rate on the branch leading to the Bc group is γ (in black), the rate on the remaining branches is β (hatched). Case 1: a single constant rate throughout the phylogeny (α = β = γ). Case 2: two rates differentiate the Bc group (α, β = γ). Case 3: three rates differentiate the Bc group and the branch leading to this group (α, β, γ).
Table 1.
The phyletic patterns with most genes in all members of the Bacillaceae group
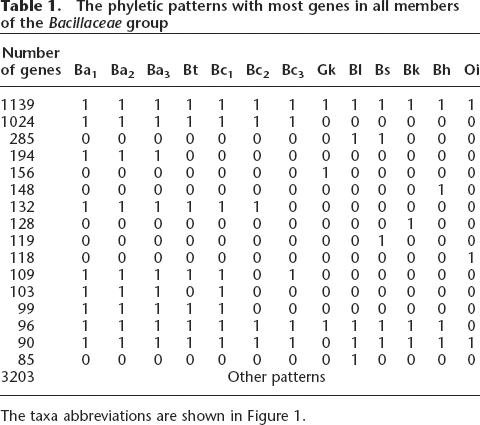
The taxa abbreviations are shown in Figure 1.
Figure 3.

An example of the likelihood surface with different rates of insertion and deletion. The likelihood value shows a continuous pattern of change as the insertion/deletion rate changes.
The strains from Bacillus anthracis, Bacillus cereus, and Bacillus thuringiensis are closely related and have been suggested to form the B. cereus group (the Bc group) (Priest et al. 2004). Two different insertion/deletion rates were assumed on the two parts of the phylogeny (Case 2 in Fig. 2). The branches among the Bc group have an insertion/deletion rate α, while the remaining branches have an insertion/deletion rate β. Fitting the maximum likelihood model to this scenario suggests that the rate α is 4.42, while the rate β is 0.35 (Fig. 3). It is striking that the rate α is much greater than the rate β and also much larger than 1, which is the evolutionary time period required to observe one substitution per nucleotide site. Hence, during the evolutionary time period required for one substitution per site, an entire gene could possibly have been inserted/deleted about five times in the Bc group. There are more gene movements observed relative to evolutionary branch length by comparing more closely related strains, and hence, there are more gene movements inferred at the tips of phylogeny.
As can be observed in Figure 2, there is a divergence in the genome size between the Bc group and the genome size of the other Bacillaceae. The branch leading to the Bc group was therefore separated from the other branches with a distinct rate γ (Case 3 in Fig. 2). The application of the maximum likelihood analysis to this model indicates that the rate α is 3.92, the rate β is 0.28, and the rate γ is 1.23. The rate γ is approximately five times greater than the rate β. However, the rate α among the Bc group measuring rates closer to the tips of the phylogeny is still much greater than either the rate β or γ.
In addition to the above likelihood analysis, an analysis was performed with the assumption that genes cannot be regained after having been deleted. These results yield insertion/deletion rates that are similar to those under the assumption that genes can be regained after deletion (Table 2). However, in every case, the likelihood value is much lower. With a single constant insertion/deletion rate, the MLE is 0.48. In the case of two separate rates, the rate α is 4.48 among the Bc group and the rate β is 0.33. When the rate on the branch leading to the Bc group was also considered distinct, the rate γ was estimated at 1.08 and the rate β as 0.28. Both rates β and γ are much smaller than the rate α at 3.90.
Table 2.
Insertion/deletion rates inferred from the maximum likelihood analysis using different models as shown in Figure 2
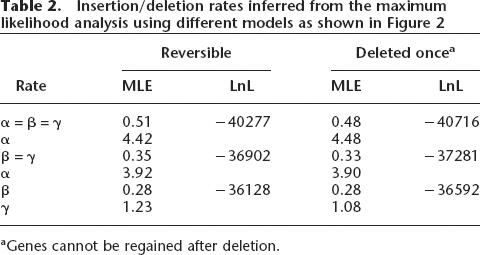
aGenes cannot be regained after deletion.
Finally, the rate on internal branches in the Bc group was separated from that on external branches in the likelihood estimation (boxed portion of the phylogeny in Fig. 2). This shows that the insertion/deletion rate on external branches is higher than that on internal branches under both models of gene transfer (4.42 vs. 3.62 and 5.34 vs. 2.78, respectively) (Table 3). If the branch leading to the three B. anthracis strains is treated as an external branch in the likelihood estimation because of the close evolutionary relationship of the B. anthracis strains, the rate difference between external branches and internal branches becomes more dramatic (7.19 vs. 0.91 and 7.63 vs. 0.81, respectively) (Table 3). This again confirms that more gene insertions/deletions take place at the tips of the phylogeny.
Table 3.
Insertion/deletion rates inferred on external branches (α1) and internal branches (α2) in the Bc group (boxed in Fig. 2)

aThe branch leading to Ba1, Ba2, and Ba3 is treated as an external branch.
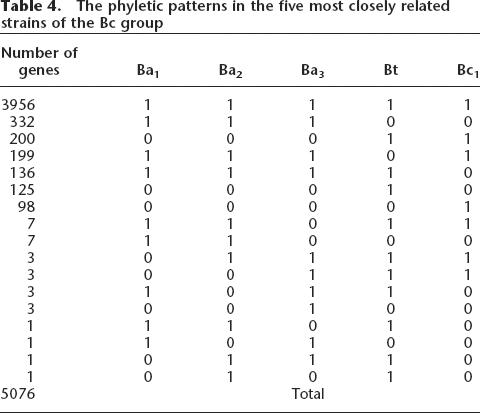
To explore among the most closely related taxa, five strains from the Bc group; B. anthracis Ames (Ba1), B. anthracis Ames “ancestor” (Ba2), B. anthracis Sterne (Ba3), B. thuringiensis (Bt), and B. cereus ZK (Bc1) were analyzed separately. The comparison of homologs shows that >96% of the genes present in all five strains share at least 90% sequence identity with each other in their protein sequences. Therefore, the substitutions between homologs among these five strains should be considered as relatively limited. All phyletic patterns of these five strains are shown in Table 4. Of the 5076 gene families, there are only 3956 present in all five strains. Hence, 22.1% of the genes are not shared by all five strains, even though these five strains are believed to represent one species (Helgason et al. 2000) and to have diverged very recently.
Table 4.
The phyletic patterns in the five most closely related strains of the Bc group
To determine the rates of evolution in the recently transferred genes, the tree lengths for the Bc-group-specific genes were measured (Fig. 4A) and compared with the tree lengths of genes present in all 13 strains (Fig. 4B). In both cases, only the branch lengths within the Bc group of taxa were measured. This comparison indicates that the genes that are strain specific within the Bc group have much faster rates of evolution than do more ancestral genes present in the other taxa.
Figure 4.

Rapid evolution in the Bc group specific genes. (A) Tree length for the Bc taxa as indicated by genes that are present only within this group of taxa; (B) tree length for the Bc taxa as indicated by genes that are present in all 13 strains.
The rates of nonsynonymous (Ka) and synonymous (Ks) substitutions were estimated for the genes present only within the Bc group and compared to genes that are more broadly distributed within the Bacillaceae group. Again, only changes that have occurred within the Bc group are measured with the genes categorized by their breadth of distribution. Both the Ks and Ka rates are elevated in the Bc group (Supplemental material), but the Ka values are most strongly affected. The Ka/Ks ratios for genes limited to the Bc group are shown in Figure 5A. It is clear that the Bc-group-specific genes have elevated Ka/Ks ratios. Genes present only within the Bc group have larger Ka/Ks ratios than genes present within the Bc group, Geobacillus kaustophilus, Bacillus licheniformis, and Bacillus subtilis or within the Bc group, G. kaustophilus, B. licheniformis, B. subtilis, Bacillus clausii, and Bacillus halodurans, or in all taxa (Fig. 5, A vs. B,C,D). The genes more recently transferred appear to contribute to a higher Ka/Ks ratio.
Figure 5.

Ka/Ks ratio of different group-specific genes. Data are measured using the genes present in the Bc group (Ba1, Bt, and Bc1). (A) Genes present in the Bc group; (B) Genes present in Bc, Gk, Bl, and Bs; (C) genes present in Bc, Gk, Bl, Bs, Bk, and Bh; (D) genes present in all 13 strains.
Discussion
To determine the patterns of LGT, it is useful to examine closely related but fully sequenced genomes. A complete genome sequence is necessary to eliminate the possibility of a hidden paralog or of a genome rearrangement masking a homolog. Closely related taxa help to determine the number of genes that might have been laterally transferred. To this end, we have examined the gene content from 13 completely sequenced genomes from the Bacillaceae group.
The results demonstrate that LGT occurs rapidly and extensively between strains of the same species. A phylogeny was constructed to measure the rate of LGT relative to nucleotide substitutions. The concatenated DNA sequences of gmk, glpF, and pycA genes rather than ribosomal RNA sequences were used to reconstruct the phylogeny in this study. It is difficult to reconstruct the phylogenetic relationship within the Bc group owing to their remarkably similar rRNA sequences (Ash et al. 1991) and the divergence of rRNA sequences in genomes with multiple rrn operons (Klappenbach et al. 2001; Acinas et al. 2004). The gmk, glpF, pycA, tpi, ilvD, pta, and pur genes have been studied in the past as tools for reconstructing the evolutionary history of the B. cereus group. It was found that gmk, glpF, pycA, and tpi genes strongly conform to the concatenated tree of all seven genes (Priest et al. 2004). (Note that the topological position of Oceanobacillus iheyensis in the concatenated phylogeny is different from that in a 16S rRNA-based phylogeny [Hao and Golding 2004].)
When maximum likelihood estimates of the rates of insertion/deletion are mapped onto this phylogeny, it suggests that there are more genes coming in and going out at the tips of phylogeny. This is clear even if one looks at the table of gene presence/absence (Table 1) and observes that differences in gene content between taxa that are considered a single species are among the most common patterns observed. If this is an evolutionarily stable situation, then most of the laterally transferred genes must be lost shortly after their insertion during evolution. Genome annotation can be an error-prone task (Kyrpides and Ouzounis 1999). As a result, all of the predicted ORFs that are present in only one genome and that do not have homologs detectable by BLAST were removed from this study. Since many of these may be proper and functional genes (Siew and Fischer 2003, 2004), this method tends to further underestimate the events on external branches. Not surprisingly, a maximum likelihood estimation including the uniquely present ORFs further inflates the rates at the tips of phylogeny (data not shown).
It has been suggested that B. anthracis, B. cereus, and B. thuringiensis are one species (Helgason et al. 2000). A close evolutionary relationship among these strains is inferred by comparing substitutions in the concatenated sequences (Fig. 1) and from the protein similarity among five of the most closely related members from the Bc group. On the other hand, >22% of the genes are not present in all five strains (Table 4). Together this shows that gene insertions/deletions have a role in the evolution of these strains equal to or greater than the role of changes at the sequence level. This compares favorably to the results of Lynch and Conery (2003) that the rate of gene duplications is also of the same order of magnitude as base substitutions. The maximum likelihood analysis within the Bc group was performed by optimizing separate insertion/deletion rates on internal branches and external branches. It shows that the tips of the phylogeny have greater insertion/deletion rates (Table 3). Nor can the high insertion/deletion rates in these genomes be simply explained by a highly mobile feature of genomes such as pathogenicity islands. Although three pathogenicity/genomic islands have been reported in B. cereus ATCC 14,579 (Bc3) in a previous study (Zhang and Zhang 2003), most of the annotated ORFs in these islands have been excluded from this study since they do not have homologs in completed genomes from other bacteria. Additionally, while the Bc3 strain-specific genes in this study are not located in these three islands, they too are excluded as they lack known homologs in other species. It is plausible that the ORFs in the strain-specific pathogenicity islands, if they are real genes and not annotation errors or pseudogenes, might contribute to an even higher turnover rate than that found in this study. Indeed, it has been shown that islands can have high numbers of insertions, deletions, and pseudogenes (Ullrich et al. 2005). High rates on external branches are observed in this study, and therefore, the addition of strain-specific genes or unique genes on pathogenicity islands would further inflate the rate at the tips of phylogeny.
In the maximum likelihood estimation, the insertion rate is assumed to be equal to the deletion rate. This assumption was made to ensure that in the long term, genome sizes would not tend to zero or infinity. In the short term, this assumption is unlikely to be correct, and Thompson et al. (2005) have shown that even within closely related bacterial populations, the genome content may change. The model of gene insertion/deletion can be improved by assuming unequal rates of insertion/deletion, fixed numbers of genes that are not deleted, variation in indel rate among genes, and so on. But the increased rate at the tips of the phylogeny is not likely to be an artifact of genome size variation or the limitations of the likelihood model. Firstly, the members of the Bc group have larger genome size than the non-Bc group taxa, but, while the indel rate on the branch leading to the Bc group shows a higher rate, it is still much smaller than the rate within the Bc group. Secondly, the seven members of the Bc group have similar genome sizes, and an estimation using only the members of the Bc group again shows (Table 3) higher indel rates at the tip of phylogeny. Genome size variation is well known as a problem in genome content phylogeny reconstruction, but it has been noted that phylogeny, rather than phenotype or LGT, is the major quantitative determinant of gene content (Snel et al. 1999).
The more recently transferred genes have longer tree length (with P < 0.001 in a Wilcoxon rank test) (Fig. 4), suggesting that the recently transferred genes are evolving faster than ancient genes. The Ka/Ks ratio study suggests that, in general, more recently transferred genes have less functional constraints (Fig. 5). The different subfigures show the Ka/Ks ratio in genes with increasing depth in the phylogeny. Those genes that are inferred to have arisen recently via LGT in the phylogeny have a higher ratio than those that were transferred somewhat more distantly (Fig. 5, A vs. B is P ≈ 0.003954). As the length of time that the genes have been resident within the host increases, the Ka/Ks ratio continues to go down (Fig. 5, B vs. D is P ≈ 0.001618). Hence, genes that have been recently transferred into these hosts have a higher percentage of nonsynonymous substitutions. Together, the recently transferred genes not only have faster evolutionary change but also have higher Ka/Ks ratios. Similarly, a previous study reported that orphans in Escherichia coli have relatively high Ka/Ks ratios (Daubin and Ochman 2004).
This study demonstrates that more recently transferred genes are under relaxed and faster evolution compared with the genes that have had a longer residence time. There are several possible reasons for this. It is possible that the laterally transferred genes with a higher rate are more prone to being laterally transferred. This is unlikely, as genes with a slightly longer residence time should not show the observed reduced rates of evolution. It has also been suggested that genes inserted into a new host will undergo amelioration of their sequence (Lawrence and Ochman 1997). In this process, the codon and base content bias of a new gene will mutate to more closely resemble the inherent bias within the new host. It is therefore plausible to explain the higher rates of evolution in recently transferred genes compared to the completely ameliorated/native genes (Fig. 4). It is more difficult to see how amelioration could also cause an increase in the nonsynonymous/synonymous ratio. Amelioration is unlikely to be the main force increasing the Ka/Ks ratio in recently transferred genes since nonsynonymous sites should be affected more slowly than synonymous sites. In addition, the ratio hides the fact that the Ka value itself is much larger in many recently transferred genes (Supplemental material), again suggesting that simple amelioration is unlikely to be the cause.
Alternatively, the genes that have been recently transferred might be adapting to a new and local environment found in the new host. In this regard, it should be noted that several genes have a very large Ka/Ks ratio, suggesting directional selection. The recently transferred genes might also be evolving quickly as they are not required in their new hosts, offer minimal selective advantage, and could be in the process of being lost. This is in accord with the observation that genes come and go rapidly within closely related genomes. It is also in concordance with the very high tree lengths in Figure 4 that suggest genes change very rapidly. A recent study concluded that transferred genes are adaptive to specific environments (Pal et al. 2005) and not deleterious or nonfunctional as suggested previously (Kurland et al. 2003; Taoka et al. 2004). The data presented here suggests that the true story is probably a mixture of directional selection to adapt in some genes and neutral mutations destroying function in others. Some recently transferred genes probably only function within the organism’s current niche and will be deleted upon a change of the organism’s niche. In this way, gene movement in bacteria should be considered as a result of the dynamic process of passive uptake and of quick selection on those genes appropriate for the current bacterial niche or their rapid elimination.
Methods
To gain a better concept of genome evolution in closely related bacteria, a group of bacteria with an abundance of completely sequenced congeneric species was selected. Thirteen complete Bacillaceae genome sequences were obtained from NCBI (http://www.ncbi.nlm.nih.gov/) to carry out the analysis. They are B. anthracis Ames, B. anthracis “Ames ancestor,” B. anthracis Sterne, B. thuringiensis, B. cereus ZK, B. cereus ATCC 10,987, B. cereus ATCC 14,579, Geobacillus kaustophilus, B. licheniformis, B. subtilis, B. clausii, B. halodurans, and Oceanobacillus iheyensis. It has been argued that B. anthracis, B. cereus, and B. thuringiensis might be one species (Helgason et al. 2000) as the ribosomal RNA sequences from these strains are remarkably similar (Ash et al. 1991). Therefore, the seven strains from B. anthracis, B. cereus, and B. thuringiensis are hereafter referred to as the B. cereus group (the Bc group) as suggested by Priest et al. (2004).
The evolutionary history of the Bc group has been reconstructed using the nucleotide sequences of the gmk, glpF, and pycA genes (Priest et al. 2004) because the rRNA sequences are too similar to provide reliable evolutionary relationships. In this study, the concatenated DNA sequences of these three genes from each genome were used to reconstruct a phylogeny using Mr.Bayes (Huelsenbeck and Ronquist 2001) (200,000 generations sampled every 100 generations with a gamma distribution model and invariant class). The method to identify members of a gene family has been described in Hao and Golding (2004). In short, potential homologs were measured according to sequence similarities, and all paralogs in each genome were clustered as a single gene family and only one member was retained for further analysis. Non-annotated proteins in a genome were identified by carrying out a TBLASTN search against the DNA sequence of each genome and using all annotated proteins from other Bacillaceae genomes as query sequences. Potential taxon species genes are determined by searching against all completed bacterial genomes. (The GenBank accession numbers are given as Supplemental information at http://evol.biology.mcmaster.ca/∼weilong/likelihood.) The phyletic patterns (gene presence or absence in each genome) of all genes were used for the maximum likelihood analysis.
The gene families present in the Bc group were used to conduct tree length and Ka/Ks ratio (ω) analyses using the PAML package (Yang 1997). The tree length was calculated as the sum of the branch lengths for the taxa only with the Bc group, using the maximum likelihood method from the PAML package. The tree length gives the expected number of substitutions per site along all branches in the phylogeny. Genes were categorized into four groups based on their presence/absence in different taxa (and hence on the inferred time period when the genes were transferred). The four groups are characterized by genes present only in the Bc group; genes present in Bc, Gk, Bl, and Bs; genes present in Bc, Gk, Bl, Bs, Bk, and Bh; and genes present in all 13 taxa. A single Ka/Ks ratio was assumed throughout the length of each sequence in this study. To avoid the effects of duplication during evolution (Gu et al. 2002; Zhang et al. 2003), any paralogs of gene families were excluded from the tree length and Ka/Ks ratio analyses. Protein sequences and their corresponding DNA sequences were extracted from the annotated genomes. Protein sequences were aligned using ClustalW (Thompson et al. 1994), and nucleotide sequence alignments were created from the protein alignments by replacing each amino acid with its corresponding codon.
To evaluate the likelihood of the observed phyletic patterns, a simple model of gene evolution was chosen. This model assumes that individual genes are inserted or deleted at constant rates. This model does not include a consideration of increasing or decreasing numbers of genes but, rather, a constant number of gene places that may or may not be occupied at any one time. All events are assumed to be independent. Let ν be the rate of gene insertion, and let μ be the rate of gene deletion. Let t be the length of time that separates a taxon from its ancestor. Let P indicate the gene presence, and let A indicate its absence. Then the probability of gene presence in the descendant taxon (d) can be calculated given knowledge of the state in the ancestral taxon (a). Thus,
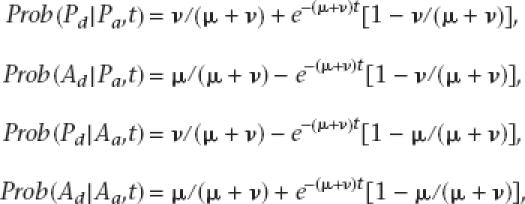 |
The likelihood that gene i is present at node x, with descendants y and z separated by t1 and t2 generations, is then calculated as
For a given gene phyletic pattern i, we assume that ancestral gene presence and absence at the root of the phylogeny contribute equally to the probability of the observed pattern. Thus, the likelihood of the gene phyletic pattern i at the last common ancestral node x will be
 |
The results must also be corrected for missing data. Those genes absent in all of the taxa are unobservable. Following Felsenstein (1992), we have made a correction for the missing data in the same way as was used for missing restriction sites, and the results then are conditional on observing the gene present in at least one species. This is
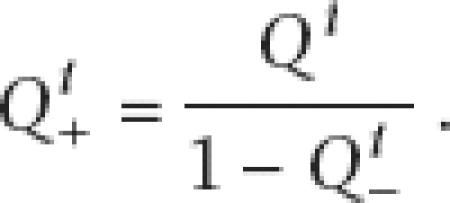 |
where Q−i is the likelihood of gene i being absent in all taxa. For a given phylogenetic relationship, Q−i will have the same value for all i.
All observed patterns were used to calculate the overall likelihood at the last common ancestral node by multiplying individual likelihoods together. The overall likelihood for a total of n patterns will be
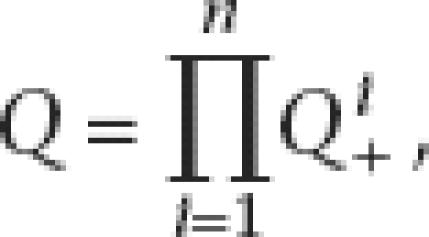 |
and after taking logs,
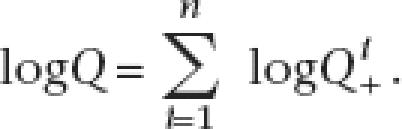 |
The deletion rate μ and the insertion rate ν were assumed to be equal (μ = ν) on each individual branch, but the overall rate of indels could vary among branches of the phylogeny. Hence, while the insertion and deletion rates were always equal, they could vary in magnitude on each branch. To estimate the maximum likelihood, the branch specific rates were optimized to find those rates that maximized the likelihood of observing the gene patterns (Table 1).
Acknowledgments
This work was supported by an NSERC grant to G.B.G. The authors wish to thank R. Morton for his suggestions on earlier versions of this manuscript and to thank the reviewers for their helpful suggestions.
Footnotes
[Supplemental material is available online at www.genome.org.]
Article is online at http://www.genome.org/cgi/doi/10.1101/gr.4746406.
References
- Acinas S.G., Marcelino L.A., Klepac-Ceraj V., Polz M.F., Marcelino L.A., Klepac-Ceraj V., Polz M.F., Klepac-Ceraj V., Polz M.F., Polz M.F. Divergence and redundancy of 16S rRNA sequences in genomes with multiple rrn operons. J. Bacteriol. 2004;186:2629–2635. doi: 10.1128/JB.186.9.2629-2635.2004. [DOI] [PMC free article] [PubMed] [Google Scholar]
- Ash C., Farrow J.A., Dorsch M., Stackebrandt E., Collins M.D., Farrow J.A., Dorsch M., Stackebrandt E., Collins M.D., Dorsch M., Stackebrandt E., Collins M.D., Stackebrandt E., Collins M.D., Collins M.D. Comparative analysis of Bacillus anthracis, Bacillus cereus, and related species on the basis of reverse transcriptase sequencing of 16S rRNA. Int. J. Syst. Bacteriol. 1991;41:343–346. doi: 10.1099/00207713-41-3-343. [DOI] [PubMed] [Google Scholar]
- Brunder W., Karch H., Karch H. Genome plasticity in Enterobacteriaceae. Int. J. Med. Microbiol. 2000;290:153–165. doi: 10.1016/S1438-4221(00)80084-3. [DOI] [PubMed] [Google Scholar]
- Cerdeno-Tarraga A.M., Patrick S., Crossman L.C., Blakely G., Abratt V., Lennard N., Poxton I., Duerden B., Harris B., Quail M.A., Patrick S., Crossman L.C., Blakely G., Abratt V., Lennard N., Poxton I., Duerden B., Harris B., Quail M.A., Crossman L.C., Blakely G., Abratt V., Lennard N., Poxton I., Duerden B., Harris B., Quail M.A., Blakely G., Abratt V., Lennard N., Poxton I., Duerden B., Harris B., Quail M.A., Abratt V., Lennard N., Poxton I., Duerden B., Harris B., Quail M.A., Lennard N., Poxton I., Duerden B., Harris B., Quail M.A., Poxton I., Duerden B., Harris B., Quail M.A., Duerden B., Harris B., Quail M.A., Harris B., Quail M.A., Quail M.A., et al. Extensive DNA inversions in the B. fragilis genome control variable gene expression. Science. 2005;307:1463–1465. doi: 10.1126/science.1107008. [DOI] [PubMed] [Google Scholar]
- Copley S.D., Dhillon J.K., Dhillon J.K. Lateral gene transfer and parallel evolution in the history of glutathione biosynthesis genes. Genome Biol. 2002;3:0025.1–0025.16. doi: 10.1186/gb-2002-3-5-research0025. [DOI] [PMC free article] [PubMed] [Google Scholar]
- Daubin V., Ochman H., Ochman H. Bacterial genomes as new gene homes: The genealogy of ORFans in E. coli. Genome Res. 2004;14:1036–1042. doi: 10.1101/gr.2231904. [DOI] [PMC free article] [PubMed] [Google Scholar]
- Daubin V., Lerat E., Perriere G., Lerat E., Perriere G., Perriere G. The source of laterally transferred genes in bacterial genomes. Genome Biol. 2003a;4:R57. doi: 10.1186/gb-2003-4-9-r57. [DOI] [PMC free article] [PubMed] [Google Scholar]
- Daubin V., Moran N.A., Ochman H., Moran N.A., Ochman H., Ochman H. Phylogenetics and the cohesion of bacterial genomes. Science. 2003b;301:829–832. doi: 10.1126/science.1086568. [DOI] [PubMed] [Google Scholar]
- Dean A.M., Neuhauser C., Grenier E., Golding G.B., Neuhauser C., Grenier E., Golding G.B., Grenier E., Golding G.B., Golding G.B. The pattern of amino acid replacements in α/β-barrels. Mol. Biol. Evol. 2002;19:1846–1864. doi: 10.1093/oxfordjournals.molbev.a004009. [DOI] [PubMed] [Google Scholar]
- Felsenstein J. Phylogenies from molecular sequences: Inference and reliability. Annu. Rev. Genet. 1988;22:521–565. doi: 10.1146/annurev.ge.22.120188.002513. [DOI] [PubMed] [Google Scholar]
- Felsenstein J. PHYLIP (phylogeny inference package). Version 3.2. Cladistics. 1989;5:164–166. [Google Scholar]
- Felsenstein J. Phylogenies from restriction sites: A maximum- likelihood approach. Evolution Int. J. Org. Evolution. 1992;46:159–173. doi: 10.1111/j.1558-5646.1992.tb01991.x. [DOI] [PubMed] [Google Scholar]
- Felsenstein J. Inferring phylogenies. Sinauer Associates Inc.; Sunderland, MA.: 2004. [Google Scholar]
- Galtier N., Boursot P., Boursot P. A new method for locating changes in a tree reveals distinct nucleotide polymorphism vs. divergence patterns in mouse mitochondrial control region. J. Mol. Evol. 2000;50:224–231. doi: 10.1007/s002399910025. [DOI] [PubMed] [Google Scholar]
- Garcia-Vallvé S., Romeu A., Palau J., Romeu A., Palau J., Palau J. Horizontal gene transfer in bacterial and archaeal complete genomes. Genome Res. 2000;10:1719–1725. doi: 10.1101/gr.130000. [DOI] [PMC free article] [PubMed] [Google Scholar]
- Gu X. Maximum-likelihood approach for gene family evolution under functional divergence. Mol. Biol. Evol. 2001;18:453–464. doi: 10.1093/oxfordjournals.molbev.a003824. [DOI] [PubMed] [Google Scholar]
- Gu X., Zhang H., Zhang H. Genome phylogenetic analysis based on extended gene contents. Mol. Biol. Evol. 2004;21:1401–1408. doi: 10.1093/molbev/msh138. [DOI] [PubMed] [Google Scholar]
- Gu Z., Nicolae D., Lu H.H., Li W.H., Nicolae D., Lu H.H., Li W.H., Lu H.H., Li W.H., Li W.H. Rapid divergence in expression between duplicate genes inferred from microarray data. Trends Genet. 2002;18:609–613. doi: 10.1016/s0168-9525(02)02837-8. [DOI] [PubMed] [Google Scholar]
- Hao W., Golding G.B., Golding G.B. Patterns of bacterial gene movement. Mol. Biol. Evol. 2004;21:1294–1307. doi: 10.1093/molbev/msh129. [DOI] [PubMed] [Google Scholar]
- Helgason E., Økstad O.A., Caugant D.A., Johansen H.A., Fouet A., Mock M., Hegna I., Kolstø A.-B., Økstad O.A., Caugant D.A., Johansen H.A., Fouet A., Mock M., Hegna I., Kolstø A.-B., Caugant D.A., Johansen H.A., Fouet A., Mock M., Hegna I., Kolstø A.-B., Johansen H.A., Fouet A., Mock M., Hegna I., Kolstø A.-B., Fouet A., Mock M., Hegna I., Kolstø A.-B., Mock M., Hegna I., Kolstø A.-B., Hegna I., Kolstø A.-B., Kolstø A.-B. Bacillus anthracis, Bacillus cereus, and Bacillus thuringiensis—One species on the basis of genetic evidence. Appl. Environ. Microbiol. 2000;66:2627–2630. doi: 10.1128/aem.66.6.2627-2630.2000. [DOI] [PMC free article] [PubMed] [Google Scholar]
- Huelsenbeck J.P., Ronquist F., Ronquist F. MRBAYES: Bayesian inference of phylogenetic trees. Bioinformatics. 2001;17:754–755. doi: 10.1093/bioinformatics/17.8.754. [DOI] [PubMed] [Google Scholar]
- Huson D.H., Steel M., Steel M. Phylogenetic trees based on gene content. Bioinformatics. 2004;20:2044–2049. doi: 10.1093/bioinformatics/bth198. [DOI] [PubMed] [Google Scholar]
- Itaya M. Physical map of the Bacillus subtilis 166 genome: Evidence for the inversion of an approximately 1900 kb continuous DNA segment, the translocation of an approximately 100 kb segment and the duplication of a 5 kb segment. Microbiology. 1997;143:3723–3732. doi: 10.1099/00221287-143-12-3723. [DOI] [PubMed] [Google Scholar]
- Klappenbach J.A., Saxman P.R., Cole J.R., Schmidt T.M., Saxman P.R., Cole J.R., Schmidt T.M., Cole J.R., Schmidt T.M., Schmidt T.M. rrndb: The Ribosomal RNA operon copy Number Database. Nucleic Acids Res. 2001;29:181–184. doi: 10.1093/nar/29.1.181. [DOI] [PMC free article] [PubMed] [Google Scholar]
- Kunin V., Ouzounis C.A., Ouzounis C.A. The balance of driving forces during genome evolution in prokaryotes. Genome Res. 2003;13:1589–1594. doi: 10.1101/gr.1092603. [DOI] [PMC free article] [PubMed] [Google Scholar]
- Kurland C.G., Canback B., Berg O.G., Canback B., Berg O.G., Berg O.G. Horizontal gene transfer: A critical view. Proc. Natl. Acad. Sci. 2003;100:9658–9662. doi: 10.1073/pnas.1632870100. [DOI] [PMC free article] [PubMed] [Google Scholar]
- Kuwahara T., Yamashita A., Hirakawa H., Nakayama H., Toh H., Okada N., Kuhara S., Hattori M., Hayashi T., Ohnishi Y., Yamashita A., Hirakawa H., Nakayama H., Toh H., Okada N., Kuhara S., Hattori M., Hayashi T., Ohnishi Y., Hirakawa H., Nakayama H., Toh H., Okada N., Kuhara S., Hattori M., Hayashi T., Ohnishi Y., Nakayama H., Toh H., Okada N., Kuhara S., Hattori M., Hayashi T., Ohnishi Y., Toh H., Okada N., Kuhara S., Hattori M., Hayashi T., Ohnishi Y., Okada N., Kuhara S., Hattori M., Hayashi T., Ohnishi Y., Kuhara S., Hattori M., Hayashi T., Ohnishi Y., Hattori M., Hayashi T., Ohnishi Y., Hayashi T., Ohnishi Y., Ohnishi Y., et al. Genomic analysis of Bacteroides fragilis reveals extensive DNA inversions regulating cell surface adaptation. Proc. Natl. Acad. Sci. 2004;101:14919–14924. doi: 10.1073/pnas.0404172101. [DOI] [PMC free article] [PubMed] [Google Scholar]
- Kyrpides N.C., Ouzounis C.A., Ouzounis C.A. Whole-genome sequence annotation: ‘Going wrong with confidence.’. Mol. Microbiol. 1999;32:886–887. doi: 10.1046/j.1365-2958.1999.01380.x. [DOI] [PubMed] [Google Scholar]
- Lake J.A., Rivera M.C., Rivera M.C. Deriving the genomic tree of life in the presence of horizontal gene transfer: Conditioned reconstruction. Mol. Biol. Evol. 2004;21:681–690. doi: 10.1093/molbev/msh061. [DOI] [PubMed] [Google Scholar]
- Lawrence J.G., Ochman H., Ochman H. Amelioration of bacterial genomes: Rates of change and exchange. J. Mol. Evol. 1997;44:383–397. doi: 10.1007/pl00006158. [DOI] [PubMed] [Google Scholar]
- Liu G.R., Rahn A., Liu W.Q., Sanderson K.E., Johnston R.N., Liu S.L., Rahn A., Liu W.Q., Sanderson K.E., Johnston R.N., Liu S.L., Liu W.Q., Sanderson K.E., Johnston R.N., Liu S.L., Sanderson K.E., Johnston R.N., Liu S.L., Johnston R.N., Liu S.L., Liu S.L. The evolving genome of Salmonella enterica serovar Pullorum. J. Bacteriol. 2002;184:2626–2633. doi: 10.1128/JB.184.10.2626-2633.2002. [DOI] [PMC free article] [PubMed] [Google Scholar]
- Lynch M., Conery J.S., Conery J.S. The evolutionary demography of duplicate genes. J. Struct. Funct. Genomics. 2003;3:35–44. [PubMed] [Google Scholar]
- McLysaght A., Baldi P.F., Gaut B.S., Baldi P.F., Gaut B.S., Gaut B.S. Extensive gene gain associated with adaptive evolution of poxviruses. Proc. Natl. Acad. Sci. 2003;100:15655–15660. doi: 10.1073/pnas.2136653100. [DOI] [PMC free article] [PubMed] [Google Scholar]
- Mirkin B.G., Fenner T.I., Galperin M.Y., Koonin E.V., Fenner T.I., Galperin M.Y., Koonin E.V., Galperin M.Y., Koonin E.V., Koonin E.V. Algorithms for computing parsimonious evolutionary scenarios for genome evolution, the last universal common ancestor and dominance of horizontal gene transfer in the evolution of prokaryotes. BMC Evol. Biol. 2003;3:2. doi: 10.1186/1471-2148-3-2. [DOI] [PMC free article] [PubMed] [Google Scholar]
- Neyman J.1971. Molecular studies of evolution: A source of novel statistical problems. In Statistical decision theory and related topics (eds. S.S. Gupta and J. Yackel) pp. 1–27. Academic Press; New York [Google Scholar]
- Ochman H., Jones I.B., Jones I.B. Evolutionary dynamics of full genome content in Escherichia coli. EMBO J. 2000;19:6637–6643. doi: 10.1093/emboj/19.24.6637. [DOI] [PMC free article] [PubMed] [Google Scholar]
- Pal C., Papp B., Lercher M.J., Papp B., Lercher M.J., Lercher M.J. Adaptive evolution of bacterial metabolic networks by horizontal gene transfer. Nat. Genet. 2005;37:1372–1375. doi: 10.1038/ng1686. [DOI] [PubMed] [Google Scholar]
- Priest F.G., Barker M., Baillie L.W., Holmes E.C., Maiden M.C., Barker M., Baillie L.W., Holmes E.C., Maiden M.C., Baillie L.W., Holmes E.C., Maiden M.C., Holmes E.C., Maiden M.C., Maiden M.C. Population structure and evolution of the Bacillus cereus group. J. Bacteriol. 2004;186:7959–7970. doi: 10.1128/JB.186.23.7959-7970.2004. [DOI] [PMC free article] [PubMed] [Google Scholar]
- Siew N., Fischer D., Fischer D. Analysis of singleton ORFans in fully sequenced microbial genomes. Proteins. 2003;53:241–251. doi: 10.1002/prot.10423. [DOI] [PubMed] [Google Scholar]
- Siew N., Fischer D., Fischer D. Structural biology sheds light on the puzzle of genomic ORFans. J. Mol. Biol. 2004;342:369–373. doi: 10.1016/j.jmb.2004.06.073. [DOI] [PubMed] [Google Scholar]
- Silva F.J., Latorre A., Moya A., Latorre A., Moya A., Moya A. Why are the genomes of endosymbiotic bacteria so stable? Trends Genet. 2003;19:176–180. doi: 10.1016/S0168-9525(03)00041-6. [DOI] [PubMed] [Google Scholar]
- Snel B., Bork P., Huynen M.A., Bork P., Huynen M.A., Huynen M.A. Genome phylogeny based on gene content. Nat. Genet. 1999;21:108–110. doi: 10.1038/5052. [DOI] [PubMed] [Google Scholar]
- Snel B., Bork P., Huynen M.A., Bork P., Huynen M.A., Huynen M.A. Genomes in flux: The evolution of archaeal and proteobacterial gene content. Genome Res. 2002;12:17–25. doi: 10.1101/gr.176501. [DOI] [PubMed] [Google Scholar]
- Stoebel D.M. Lack of evidence for horizontal transfer of the lac operon into Escherichia coli. Mol. Biol. Evol. 2005;22:683–690. doi: 10.1093/molbev/msi056. [DOI] [PubMed] [Google Scholar]
- Taoka M., Yamauchi Y., Shinkawa T., Kaji H., Motohashi W., Nakayama H., Takahashi N., Isobe T., Yamauchi Y., Shinkawa T., Kaji H., Motohashi W., Nakayama H., Takahashi N., Isobe T., Shinkawa T., Kaji H., Motohashi W., Nakayama H., Takahashi N., Isobe T., Kaji H., Motohashi W., Nakayama H., Takahashi N., Isobe T., Motohashi W., Nakayama H., Takahashi N., Isobe T., Nakayama H., Takahashi N., Isobe T., Takahashi N., Isobe T., Isobe T. Only a small subset of the horizontally transferred chromosomal genes in Escherichia coli are translated into proteins. Mol. Cell. Proteomics. 2004;3:780–787. doi: 10.1074/mcp.M400030-MCP200. [DOI] [PubMed] [Google Scholar]
- Thompson J.D., Higgins D.G., Gibson T.J., Higgins D.G., Gibson T.J., Gibson T.J. CLUSTAL W: Improving the sensitivity of progressive multiple sequence alignment through sequence weighting, position-specific gap penalties and weight matrix choice. Nucleic Acids Res. 1994;22:4673–4680. doi: 10.1093/nar/22.22.4673. [DOI] [PMC free article] [PubMed] [Google Scholar]
- Thompson J.R., Pacocha S., Pharino C., Klepac-Ceraj V., Hunt D.E., Benoit J., Sarma-Rupavtarm R., Distel D.L., Polz M.F., Pacocha S., Pharino C., Klepac-Ceraj V., Hunt D.E., Benoit J., Sarma-Rupavtarm R., Distel D.L., Polz M.F., Pharino C., Klepac-Ceraj V., Hunt D.E., Benoit J., Sarma-Rupavtarm R., Distel D.L., Polz M.F., Klepac-Ceraj V., Hunt D.E., Benoit J., Sarma-Rupavtarm R., Distel D.L., Polz M.F., Hunt D.E., Benoit J., Sarma-Rupavtarm R., Distel D.L., Polz M.F., Benoit J., Sarma-Rupavtarm R., Distel D.L., Polz M.F., Sarma-Rupavtarm R., Distel D.L., Polz M.F., Distel D.L., Polz M.F., Polz M.F. Genotypic diversity within a natural coastal bacterioplankton population. Science. 2005;307:1311–1313. doi: 10.1126/science.1106028. [DOI] [PubMed] [Google Scholar]
- Tillier E.R., Collins R.A., Collins R.A. Genome rearrangement by replication-directed translocation. Nat. Genet. 2000;26:195–197. doi: 10.1038/79918. [DOI] [PubMed] [Google Scholar]
- Ullrich S., Kube M., Schubbe S., Reinhardt R., Schuler D., Kube M., Schubbe S., Reinhardt R., Schuler D., Schubbe S., Reinhardt R., Schuler D., Reinhardt R., Schuler D., Schuler D. A hypervariable 130-kilobase genomic region of Magnetospirillum gryphiswaldense comprises a magnetosome island which undergoes frequent rearrangements during stationary growth. J. Bacteriol. 2005;187:7176–7184. doi: 10.1128/JB.187.21.7176-7184.2005. [DOI] [PMC free article] [PubMed] [Google Scholar]
- Yang Z. PAML: A program package for phylogenetic analysis by maximum likelihood. Comput. Appl. Biosci. 1997;13:555–556. doi: 10.1093/bioinformatics/13.5.555. [DOI] [PubMed] [Google Scholar]
- Zhang R., Zhang C.T., Zhang C.T. Identification of genomic islands in the genome of Bacillus cereus by comparative analysis with Bacillus anthracis. Physiol. Genomics. 2003;16:19–23. doi: 10.1152/physiolgenomics.00170.2003. [DOI] [PubMed] [Google Scholar]
- Zhang P., Gu Z., Li W.H., Gu Z., Li W.H., Li W.H. Different evolutionary patterns between young duplicate genes in the human genome. Genome Biol. 2003;4:R56. doi: 10.1186/gb-2003-4-9-r56. [DOI] [PMC free article] [PubMed] [Google Scholar]