

Abstract
We have systematically examined the correlation between transcriptional expression pattern and the physical layout of gene pairs in the genome of Caenorhabditis elegans using a public tissue-specific SAGE library data set. We find a strong positive correlation in the expression patterns of neighboring gene pairs that are close together and transcribed in the same direction as well as for neighboring pairs that are located on opposing strands and transcribed in divergent directions. Coupling between members of nonoverlapping neighboring gene pairs is independent of operons and decreases to background levels as the distance increases beyond 10 kb. These findings suggest the existence of regional transcriptional domains in the C. elegans genome. In contrast, genes that are on opposing strands and transcribed in convergent directions are less transcriptionally coupled than the genome-wide background, suggesting a mutual inhibition mechanism. We have also examined the conservation and functional consequences of extreme cases of topological entanglement in the C. elegans genome, in which two or more genes physically overlap in their UTRs or coding regions. We have found that overlapping gene pairs are more conserved and are enriched in essential genes and genes that cause various defined phenotypes revealed by RNAi trials. SAGE analysis indicates that genes that are on the same strand, physically overlap, and transcript at the same directions are very highly correlated in gene expression, while overlapping gene pairs in which one member of the pair resides within an intron of the other are weakly, if at all, coupled, similar to convergent overlapping genes.
Genes are not randomly distributed in the genome and the distribution of genes on the chromosomes has been implicated in gene-expression regulation (Hurst et al. 2004). In species ranging from bacteria to human, neighboring genes have been demonstrated to have correlated expression patterns (Cohen et al. 2000; Kruglyak and Tang 2000; Lercher et al. 2003; Williams and Bowles 2004). However, the mechanisms controlling the coexpression of neighboring genes are largely unknown except in a few cases. In prokaryotes, functionally related genes are grouped into polycistronic operons that direct the synthesis of multiple translation products (Reznikoff 1972). Another type of operon has been described in the nematode Caenorhabditis elegans, where genes within a polygenic transcript are trans-spliced into independent transcripts before translation (Blumenthal 2004). For those species that do not have operons and to explain the correlation between the expression of genes on opposite strands, the existence of shared cis-regulatory regions have been hypothesized, but rarely documented (Cho et al. 1998; Cohen et al. 2000; Kruglyak and Tang 2000; Lercher et al. 2003; Hurst et al. 2004). It is also an unanswered question as to whether the coexpression of neighboring genes is a result of selection—that is, there is functional significance to this pattern—or whether it is a side effect of the way genes evolve by tandem duplication, which tends to create localized clusters of evolutionarily related paralogs.
The extreme cases of neighboring genes are those whose transcribed regions physically overlap in their coding or untranslated regions (3′ and 5′ UTRs). Cases of overlapping genes have been widely observed in many species ranging from the bacteriophage ϕX174 (Sanger et al. 1977), bacteria (Fukuda et al. 2003), and fruit fly (Spencer et al. 1986; Misra et al. 2002) to mammals (Veeramachaneni et al. 2004). Although it has been suggested that overlapping topologies play a role in regulating gene expression (Vanhee-Brossollet and Vaquero 1998), the characteristics and mechanism of such correlated gene regulation remains obscure, and the extent of conservation of the overlapping gene topology has been controversial. In terms of conservation, for example, some overlapping gene pairs have been shown to be conserved for >200 million years from therapsid reptiles to mammals (Shintani et al. 1999), while other reports suggest that overlapping gene pairs are not more or less conserved than other genes in the same mammalian genome (Veeramachaneni et al. 2004). Overlapping gene pairs exist in the C. elegans genome, but they have not been systematically examined.
In this report, we will systematically dissect the impact of various types of genomic arrangement of gene pairs including overlapping gene pairs in the whole genome of C. elegans using the new functional genomic data sets that have become available recently to gain insight into the structural and functional significance of these gene-organizing topologies and to resolve existing controversies.
Results
We began our work by exploring whether genes that are located in the same genomic neighborhood are transcriptionally coupled. We then examined the possible functional significance of the physically overlapping genes.
Expression coupling of neighboring gene pairs
To explore transcriptional coupling among different types of neighboring genes, we generated 24 sets of C. elegans gene pairs distinguished by their orientation relative to each other and the distance between their coding regions. The gene pairs picked for analysis were not necessarily adjacent, but could have intervening genes on either the same or opposite strands. Gene pairs were classified as “parallel neighboring gene pairs” if they were on the same DNA strand and transcribed in the same direction, as “divergent neighboring gene pairs,” if they were on opposite DNA strands and were transcribed in directions away from each other, and “convergent neighboring gene pairs” if they were on opposite DNA strands and transcribed in directions toward each other. Pairs were further stratified based on the separation between their closest coding regions; gene pair separation distances ranged from 200 to 50,000 bp. For this analysis, we ignored UTR annotations because of their variability and excluded any genes that were thought to be part of an operon structure or genes annotated as transposons.
To examine the expression pattern correlation among the gene pairs, we used eight tissue-specific genome-wide SAGE library data sets. For each gene pair, we calculated the pairwise Pearson correlation coefficient using the SAGE tag frequency values. Gene pairs were only included in the analysis if both members of the pair had high-quality SAGE tags (see Methods). For comparison, we calculated Pearson correlation coefficient values for gene pairs randomly selected from the same (cis) and different (trans) chromosomes, as well as from gene pairs selected from within the same operon.
Table 1 summarizes the number of genes in each test set, the median Pearson correlation coefficient, and the upper and lower quartiles of the distribution. Of note is that at the smallest separation distance of <200 bp, we found many fewer divergent gene pairs (105) than either convergent (726) or parallel pairs (251). Figure 1A shows an overview of correlation in gene expression for genes on chromosome I ranging from 1 to 2 Mb genomic regions. As observed in yeast (Cohen et al. 2000), large blocks of neighboring genes are positively correlated as indicated by the clustering of many red squares along the diagonal direction (Fig. 1A). As illustrated in Figure 1B, density curves of the Pearson correlation coefficients for random gene pairs, whether in cis or in trans, are all close to 0 and are slightly skewed toward positive correlation coefficient values (0.15 for both cases) (Fig. 1B, thick horizontal line), suggesting a basal-positive coupling in gene expression for any pair of genes within the genome. Such basal-positive coupling is likely due to the ubiquitous expression of housekeeping genes in multiple tissues, a phenomenon also observed in yeast (Cohen et al. 2000; Kruglyak and Tang 2000) and Arabidopsis thaliana (Williams and Bowles 2004). In marked contrast, the Pearson correlation coefficients of divergent neighboring gene pairs located within 1000 bp of each other were markedly shifted toward positive correlations, as were the coefficients for closely separated parallel neighboring gene pairs (Fig. 1B). The positive correlation in gene expression for parallel and divergent neighboring gene pairs is consistent with that observed previously in yeast (Cohen et al. 2000). In C. elegans, positive gene expression correlation for neighboring gene pairs has been attributed primarily to the positive correlation for operon genes in addition to some positive correlation for neighboring gene pairs that reside on different strands and transcribe at divergent directions (Lercher et al. 2003). Here, we demonstrated that parallel neighboring gene pairs remain positively correlated in gene expression (Fig. 1B) when known operons are excluded. Indeed, the density curve for parallel neighboring gene pairs is similar to that for known operon gene pairs, but is somewhat less marked. In marked contrast to parallel and divergent genes, we found no correlation of expression for convergent neighboring gene pairs, even at very close distances.
Table 1.
Expression coupling of neighboring genes

Figure 1.

Correlation in gene expression. (A) A heat map that shows the correlation in gene expression for genes within the region 1–2 Mb on chromosome I. Each small box represents a pairwise Pearson correlation coefficient value that indicates the level of gene expression. (B) Distribution of Pearson correlation coefficient values calculated based on tissue-specific SAGE tags. (Parallel) Parallel gene pairs with distance between closest coding exons ≤1000 bp; (Divergent) divergent neighboring gene pairs with distance between closest coding exons ≤1000 bp; (Convergent) convergent neighboring gene pairs between closest coding exons ≤1000 bp; (Operon) gene pairs within operons; (Random cis) random gene pairs within same chromosomes; (Random trans) random gene pairs in which two genes are from different chromosomes.
As the separation distance between parallel and divergent neighboring gene pairs increases, the amount of correlation decreases. Figure 2 shows the median correlation coefficient among all gene pairs with parallel, divergent, and convergent neighboring topologies. The distance effect is particularly marked for parallel neighboring genes and extends to roughly 10 kb, after which point the median correlation coefficient becomes indistinguishable from the background coupling of randomly selected gene pairs. Strikingly, at shorter separation distances, the convergent genes are less correlated than background, but never become negatively correlated. As with parallel genes, this effect diminishes as the separation interval increases and becomes indistinguishable from background levels at about 10-kb separation.
Figure 2.

Distance-dependent correlation in gene expression. x-axis is the distance between neighboring genes and y-axis is the Pearson correlation coefficient values. (Parallel) Parallel gene pairs; (Divergent) divergent neighboring gene pairs; (Convergent) convergent neighboring gene pairs. Each point in the figure represents a median value for the Pearson correlation coefficient for each group. Pearson correlation coefficient values for cis- and trans-random gene pairs are essentially the same and are represented by a horizontal line.
Expression coupling of overlapping gene pairs
To test what happens to gene expression correlation as the distance between neighboring genes is reduced to zero, we next examined physically overlapping genes. Following previous definitions (Cohen et al. 2000; Misra et al. 2002; Celniker and Rubin 2003; Fukuda et al. 2003; Veeramachaneni et al. 2004), overlapping genes are defined as gene pairs in which any parts of their gene models (introns, coding exons, and terminal exons or UTRs) overlap with other genes. Alternatively spliced transcripts were counted as single genes. We divided such pairs into six groups (Fig. 3). (1) “Nested gene pairs,” also named “embedded genes” (Veeramachaneni et al. 2004) or “genes within genes” (Misra et al. 2002), are gene pairs in which the entire gene structure of one gene nested within a single intron of the second gene of the pair. There are two arrangements for nested gene pairs, in which two genes of a pair reside either on the same strands (also called “same-strand nested gene pairs”) (Fig. 3A, Supplemental Fig. 1) or on opposite strands (also called “opposite-strand nested gene pairs”) (Figs. 3A, 4A). (2) “Gene pairs with overlapping coding exons” are pairs in which the coding exon(s) of one gene overlaps with the coding exon(s) of the other gene. There is only one arrangement for this type, i.e., the two genes reside on the opposite strands (Fig. 3B, Supplemental Fig. 2). Transcripts on the same strand and sharing coding sequences are considered alternative splicing isoforms of the same gene. (3) “Interleaved gene pairs” are those in which the exons of one gene are nested within different introns of another gene (Celniker and Rubin 2003) (Fig. 3C, Supplemental Fig. 3). There are also two arrangements for this category of overlapping genes, one in which both genes reside on the same DNA strand (“same-strand interleaved gene pairs”) and another in which these two genes reside on the opposite strands (“opposite-strand interleaved gene pairs”). (4) “Piggyback gene pairs,” also called “tandem gene pairs” (Cohen et al. 2000; Misra et al. 2002), and “unidirectional gene pairs” (Fukuda et al. 2003), are defined here as gene pairs in which the two genes reside on the same strand and partially overlap at their terminal exons (Figs. 3D, 4B). We prefer the term “piggyback gene pair,” since the term “tandem gene pair” does not usually imply an overlapping relationship. (5) “Convergent overlapping gene pairs” (Cohen et al. 2000; Fukuda et al. 2003), also known as “tail to tail gene pair” (Veeramachaneni et al. 2004), are a gene pair in which two genes reside on the opposite strands and overlap between their 3′ UTRs and/or coding exons (Figs. 3E, 4C). (6) “Divergent overlapping gene pairs” (Cohen et al. 2000; Fukuda et al. 2003), also called “head to head gene pair” (Veeramachaneni et al. 2004), are gene pairs in which two genes reside on the opposite strands and overlap at their terminal exons (Fig. 3F, Supplemental Fig. 4).
Figure 3.

Types of overlapping. Six types of overlapping genes in C. elegans. (A) Nested gene pair, same strand. Each pair of nested gene consists of a flanking gene (outer gene) and a nested gene (inner gene). (B) Gene-pair group with overlapping exon, opposite strand. (C) Same-strand and opposite-strand interleaved gene pairs. (D) Piggyback gene pair. (E) Convergent overlapping gene pair. (F) Divergent overlapping gene group.
Figure 4.

(A–C) Examples of overlapping genes. Generic genome browser (Stein et al. 2002) snapshots taken from the WormBase Web site. Six tracks are shown, i.e., Gene Models, Operons, Trans-splice acceptor, ESTs aligned by BLAT (best), RNAs aligned by BLAT (best), and ORFeome sequence tags (best). (A) Opposite-strand nested gene pairs; (B) Piggyback gene pair; (C) Convergent overlapping gene pairs.
We mined the C. elegans genome database to find a total of 1190 overlapping gene pairs (Table 2). Overlapping gene pairs that involve putative transposable elements were excluded from further analysis. The numbers of gene pairs in these six categories were not evenly distributed but were strongly biased toward the nested overlapping gene pairs (547) and convergent overlapping gene pairs (455) categories (Table 2). Since there were only five overlapping exon gene pairs and only 18 interleaved gene pairs, these two categories were excluded from further analysis.
Table 2.
Types of overlapping genes in C. elegans
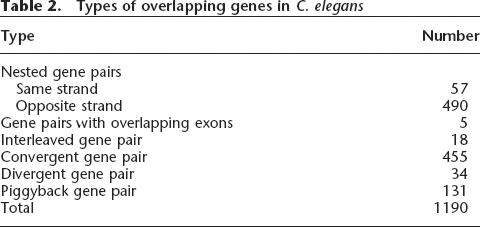
There are interesting biases in the number and other aspects of different types of overlapping genes. Of the 547 nested gene pairs, for example, the majority (490, or 88%) were opposite-strand nested gene pairs (Table 1). Also, for the genes that reside on the opposite strands, there are many more convergent overlapping genes than divergent overlapping genes. There is also a striking difference in the gene lengths of the nested genes and the flanking genes that surround them. The average encoded protein length for nested genes is 323 amino acids, while the flanking genes are 819 amino-acids long on average. A flanking gene can, in some cases, contain multiple nested genes. An extreme such case is the one in which the flanking gene T12A2.1 spans nine genes (T12A2.9, T12A2.10, T12A2.11, T12A2.12, T12A2.13, C18F10.4, C18F10.5, C18F10.6, and C18F10.8) in one of its introns (Supplemental Fig. 5).
Interestingly, we found that many (∼40%) piggyback gene pairs resided within the same annotated operons in the version of WormBase from which we performed our initial analysis. In more recent versions of WormBase, the number of operons has been revised upward due to new experimental evidence (Hwang et al. 2004; Chen et al. 2004; Rual et al. 2004). After updating our operon lists, we found that 82% (89/109) of piggyback gene pairs shared the same operons (Fig. 4B). This suggests that all piggyback gene pairs are potentially operon genes.
Conservation of overlapping genes
We next asked whether overlapping genes are particularly subject to selective evolutionary constraints, which might indicate some functional significance to their overlapping topologies. There are two aspects to this question. Are individual genes involved in overlapping gene pairs more conserved than nonoverlapping genes? Is the overlapping gene topology itself more conserved than we would expect by chance?
To address the first question, we first calculated the amino-acid sequence percentage identity between proteins encoded by overlapping C. elegans genes and their corresponding Caenorhabditis briggsae orthologs. For genes with alternative isoforms, the longest isoform is used to represent the gene. We identified 16,551 pairs of orthologs using the BLAST-based program InParanoid (O’Brien et al. 2005) and compared the percentage identity of the proteins encoded by overlapping genes to the genome-wide average. The percentage identities for almost all types of overlapping genes are significantly higher than the genome-wide average of 71.82 ± 10.23% (P < 0.05 by the Kolmogorov-Smirnov test, P-values for each category are shown in Table 3). The same-strand nested gene pairs are the single exception to this rule and do not show a statistically significant difference from the genome wide average, likely due to the small number (n = 11) of such gene pairs. Figure 5A shows the distribution patterns of amino-acid conservation for the flanking genes of opposite-strand nested gene pairs, convergent overlapping gene pairs, and piggyback gene pairs. Although the peak is at roughly the same position for the overlapping genes and genome-wide average, the genome-wide set has a population of more highly diverged genes than the overlapping genes (Fig. 5A). The overlapping gene sets also contain larger populations of genes with high-percentage identity to their C. briggsae orthologs.
Table 3.
Conservation of overlapping genes in C. elegans
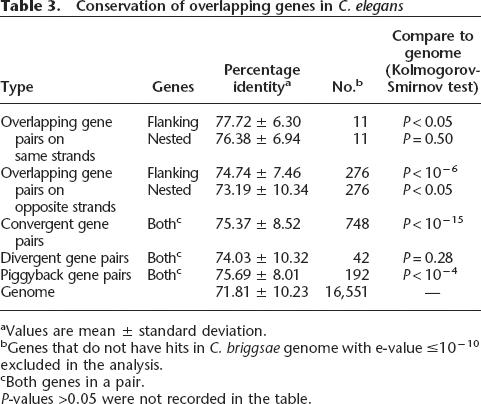
aValues are mean ± standard deviation.
bGenes that do not have hits in C. briggsae genome with e-value ≤10−10 excluded in the analysis.
cBoth genes in a pair.
P-values >0.05 were not recorded in the table.
Figure 5.

Conservation of overlapping genes. (A) Distribution of protein percentage identity between C. elegans and C. briggsae orthologous for overlapping genes (piggyback, convergent overlapping genes, and flanking genes of the opposite-strand nested gene pairs) and genes in the whole C. elegans genome. (B) Gene conservation in different genomic divisions. Each chromosome (I, II, III, IV, V, X) is divided into six bins (e.g., I_1, I_2, . . . , X_5, X_6). Each bar represents the averaged protein percentage identity for overlapping genes subtracted by that of all other genes in the same bin. Positive bars indicate that overlapping genes are more conserved than the other genes.
Genes of the C. elegans genome show a regional bias in which more conserved genes are more likely to reside in the gene-rich, recombinationally poor central regions of the chromosomes (C. elegans Sequencing Consortium 1998). If overlapping genes were more likely to occur in the central regions of the chromosomes, this could be a confounding factor in the previous analysis. To address this possibility, we divided each chromosome into six bins and counted all genes and overlapping genes within each bin. The distribution pattern of overlapping genes broadly resembles that of all genes in the C. elegans genome, but the overlapping genes are indeed slightly more likely to be found in the central regions than nonoverlapping genes. To adjust for this bias, we stratified overlapping and nonoverlapping genes by their position, and calculated the difference in protein percentage identity between the overlapping and nonoverlapping in each bin. With only a small number of exceptions (seven exceptions of 36 total, most of low magnitude) that occurred in bins at the chromosomal arms, the overlapping genes remained more highly conserved than the nonoverlapping genes located in the same positional bins (Fig. 5B). Taken together, the above analyses suggest that overlapping genes are more conserved than other genes in the C. elegans genome, even after correction for their modest bias to the central regions.
The conservation of overlapping genes is further supported by the fact that a higher percentage of overlapping genes have C. briggsae orthologs than do the general population of genes. While 14,109 genes of 19,765 annotated C. elegans protein-coding genes (71%) have C. briggsae orthologs, 95% of convergent overlapping genes (P = 3.8 × 10⁻⁸, Fisher’s exact test), and 88% of flanking genes of the opposite-strand nested gene pairs (P = 0.008, Fisher’s exact test) have C. briggsae orthologs. Flanking genes of same-strand nested gene pairs and divergent overlapping genes also have marginally higher percentages of genes with C. briggsae orthologs (75% and 76%, respectively).
Overlapping genes are under stronger purifying selection
The observation that overlapping genes are more highly conserved than nonoverlapping genes could be explained either by a difference in the neutral nucleotide substitution rate or by the action of purifying selection. To address this, we evaluated the rates of nucleotide substitution at synonymous sites (Ks) and nonsynonymous sites (Ka) (Yang and Nielsen 2000) for both overlapping and nonoverlapping ortholog pairs. The calculated Ka, Ks, and Ka/Ks ratios were consistent with the values reported previously for C. elegans and C. briggsae gene pairs (Stein et al. 2003). The neutral rate of nucleotide substitution, Ks, was similar among the overlapping and nonoverlapping gene sets (Table 4), although we observed a slight decrease in substitution rate among the nested genes in opposite-strand nested gene pairs, convergent overlapping gene pairs, and piggyback gene pairs (P < 0.05 by the Kolmogorov-Smirnov test). More striking differences were seen in the substitution rates at nonsynonymous sites (Table 4). Whereas the genome-wide Ka for orthologous pairs is 0.121 ± 0.108, we observed rates of 0.092 ± 0.078 for the piggyback gene pairs (P < 10−15), 0.099 ± 0.101 for the convergent overlapping genes (P < 0.00005), and 0.102 ± 0.082 for the flanking genes in opposite-strand nested gene pairs (P < 0.05). These differences translate into reduced Ka/Ks ratios for the flanking members of oppositestrand nested gene pairs, piggyback genes, and convergent overlapping genes, suggesting that these sets of overlapping genes are subjected to greater levels of purifying selection than genome-wide genes with orthologs. Interestingly, the nested members of opposite-strand nested gene pairs had a Ka/Ks ratio that was indistinguishable from the genome-wide average.
Table 4.
Synonymous and nonsynonymous values for overlapping genes in C. elegans

aValues are mean ± standard deviation.
bBoth genes in a pair.
It was surprising to us that the flanking members of nested gene pairs were more conserved than the genomewide average, while the nested genes of the same pairs were indistinguishable from the average. To further explore this, we asked whether and how the nested gene pair topology impacts the flanking genes by examining the synonymous and nonsynonymous substitution rates for the exons flanking the nested genes. We speculated that the nested gene might cause the adjacent exons to evolve more slowly, thereby causing these exons to display lower Ka/Ks values. Consistent with this hypothesis, we found that exons flanking the nested genes are under stronger purifying selection than more distant exons, with Ka/Ks values lower compared with the whole flanking genes (Table 5). However, the effect is modest.
Table 5.
Synonymous and nonsynonymous values for flanking exons of nested gene pairs on opposite strands in C. elegans
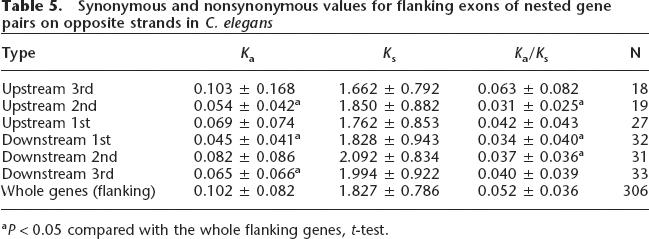
aP < 0.05 compared with the whole flanking genes, t-test.
Conservation of overlapping the gene pair topology
The conservation of individual genes in overlapping gene pairs points to the possibility that the overlapping gene topologies might themselves be under selective constraint. To test this, we measured the probability that a pair of adjacent genes in C. elegans will have adjacent orthologs in C. briggsae when the distance between the C. elegans gene pair changes. Only C. elegans pairs in which both members of the pair had C. briggsae orthologs were tested. As expected, as the C. elegans pairs move farther apart, the chance of their being adjacent in C. briggsae decreases in a manner reminiscent of exponential decay (Fig. 6). This is consistent with a Poisson process of deposition of translocation events, insertions, and deletions within the intervening sequence. We then examined the observed frequency with which overlapping genes in C. elegans are also overlapping in C. briggsae. We found that 72.3% of convergent overlapping genes and 63.4% of nested overlapping genes in C. elegans have conserved topologies in C. briggsae (Fig. 6), values that are all significantly higher than that for any of the six groups examined (P < 0.001, Fisher's exact test), suggesting a higher degree of conservation for convergent overlapping gene pairs and nested gene pairs.
Figure 6.

Distance dependent conservation of overlapping gene pairs. Each bar represents the percentage of gene pairs in C. elegans that have orthologous gene pairs in C. briggsae. (COGP) Convergent overlapping gene pairs; (0–100) adjacent gene pairs in which two genes within a pair are separated by 0–100 bp genomic sequences; similarly, (100–500), (500–1000), (1000–5000), adjacent gene pairs in which two genes within a pair are separated by 100–500, 500–1000, 1000–5000, 5000–10,000, and 10,000–50,000-bp genomic sequences, respectively.
Functional significance of overlapping genes
One explanation for the increased conservation of overlapping genes is that they tend to be essential genes. To test this hypothesis, we took advantage of the availability of many genome-wide RNAi data sets for C. elegans in the last five years (Fraser et al. 2000; Gonczy et al. 2000; Piano et al. 2002; Kamath and Ahringer 2003). Consistent with this hypothesis, the ratio of genes that cause a defined nonwild-type phenotype in RNAi experiments is significantly higher for overlapping genes than the genome-wide average (Fisher’s Exact Test, P-values are included in Table 6).
Table 6.
RNAi phenotype for overlapping genes in C. elegans

aBoth genes in a pair.
An alternative but trivial explanation for the enrichment of RNAi nonwild-type phenotype caused by the overlapping genes is that such enrichment is gene-length dependent. Larger genes might be better targets for RNAi, and we know that overlapping genes are significantly longer than the genome-wide average (N. Chen, unpubl.). To control for this possibility, we selected from the genome a matching set of genes that have similar gene lengths to the collection of overlapping genes (1827 genes for both lists, redundant entries excluded). The overlapping gene list contained 514 genes that caused nonwild-type phenotypes in RNAi trials, while the control gene list contained 305 such genes (P < 10−10, Fisher’s exact test). Therefore, the enrichment of essential genes in C. elegans in overlapping genes cannot be fully explained by a gene-length dependency.
Expression coupling of overlapping genes
To determine whether there exists the same transcriptional coupling among genes within overlapping gene pairs that exists in neighboring but nonoverlapping gene pairs, we again utilized the genome-wide SAGE library data sets. Figure 7 shows the density curves for correlation among the various overlapping gene-pair topologies, as well as among operons and a set of randomly selected genes. As previously described, pairs of genes in operons are markedly shifted toward positive correlation values, while genome-wide random genes show a more modest trend toward positive coupling. In contrast, the density curve for Pearson correlation coefficient values for opposite-strand nested gene pairs shows a statistically significant absence of the basal positive coupling found in random gene pairs (P < 0.05, Kolmogorov-Smirnov test, n = 26 for opposite-strand nested gene pairs that have high-quality SAGE tags). No negative coupling was observed. Indeed, the correlation between the members of opposite-strand nested gene pairs approaches a normal curve centered on a correlation coefficient of zero (Fig. 7), suggesting that the basal coupling seen among randomly selected genes is absent among the genes of this set.
Figure 7.

Expression coupling of overlapping genes. Distribution of Pearson correlation coefficient values for opposite-strand nested gene pairs, convergent overlapping gene pairs, piggyback gene pairs, and cis- and trans-random gene pairs.
Similar to our earlier analysis of convergent neighboring genes, the convergent overlapping gene pairs also show less transcriptional coupling than background. However, the piggyback gene pairs (same strand with overlapping terminal exons) are very strongly positively correlated (Fig. 7), consistent with the fact that most (82%) of them are located within the same operons. We did not find any statistically significant difference between the levels of transcriptional coupling among piggyback gene pairs and close genome-wide neighbor gene pairs, but the number of pairs with high-quality SAGE tags was small. Similarly, we could not document that statistically significant differences were observed between divergent overlapping pairs and the set of close genome-wide neighbor gene pairs.
Discussion
In this report we have examined the impact of various types of gene pair topologies on the conservation and gene expression correlation in the genome of C. elegans using comparative and functional genomics data sets. Consistent with previous work in yeast (Cohen et al. 2000; Kruglyak and Tang 2000) and A. thaliana (Williams and Bowles 2004), we have identified a baseline tendency toward positive correlation in the expression patterns of all gene pairs, whether they are located on the same or different chromosomes (Figs. 1, 2). This tendency becomes much more marked as the members of a gene pair become closer, and neighboring genes that are very close to each other (<10 kb) tend to be very strongly positively correlated. In contrast to this trend, we found an almost complete lack of correlation between neighboring genes that are on opposite strands and transcribed in a convergent direction. This pattern of transcriptional coupling is different from the pattern observed in Saccharomyces cerevisiae, which has been reported to have positive coupling among neighboring genes, regardless of their relative topologies (Cohen et al. 2000).
Indeed, the absence of correlation in gene expression among neighboring convergent genes appears to be a novel finding. In C. elegans, Lercher et al. (2003) reported a moderate positive correlation for genes residing on the opposite DNA strands by analyzing the overall correlation for all genes on the opposite strands, but did not stratify the pairs into convergent and divergent topologies. Here, by separating the gene pairs on the opposite strands into two separate groups, we documented a larger and more robust positive correlation for the divergent type of the gene pairs and a near complete absence of correlation for convergent pairs.
When two convergent neighboring genes overlap completely, they become a nested opposite-strand gene pair. Consistent with our finding that nonoverlapping convergent gene pairs fail to show a tendency toward coexpression, we found that nested opposite-strand overlapping genes also lack transcriptional coupling.
Although we attempted to exclude operons from our analysis, some of the strong correlation that we found among same-strand “parallel” gene pairs may be the result of undetected operons in which adjacent genes are transcribed from a polycistronic primary transcript under the control of a single promoter (Blumenthal et al. 2002). The presence of undetected operons may also explain the positive correlation in gene expression that we observed for overlapping piggyback gene pairs. However, undetected operons cannot explain the strong coupling of divergently transcribed genes in opposite strands, which are most plausibly explained by postulating the presence of common 5′ cis-regulatory elements within the region separating the divergent genes. Another potential explanation for the transcriptional coupling of neighboring genes is the presence of long-range cis-acting enhancers of transcription which act to up- or down-regulate transcription of all genes in the neighborhood. A third hypothesis is that genes are regionally clustered according to their biological pathway; in this case, the transcriptional correlation would reflect the fact that the transcription of genes in the same biological pathway or same tissue tend to be coregulated (Hurst et al. 2004). Under this hypothesis, the tendency toward coexpression of neighboring genes is a secondary effect of the part they play of the same biological pathway, and some evidence suggesting this has been described in Arabidopsis using KEGG pathway data (Williams and Bowles 2004).
None of these models readily explains why divergent neighboring genes are strongly correlated, while close convergent neighbors and convergent overlapping nested gene pairs are not. For both cases, it is possible that convergent RNA transcripts tend to interfere with each other by forming base-paired complementary structures and, therefore, coexpressed gene pairs are selected against (Katayama et al. 2005). However, this model predicts that such gene pairs should tend to be negatively correlated, which we do not observe. On balance, we believe the most likely explanation for the transcriptional coupling of neighboring genes is the sharing of 5′ cis-regulatory elements. In the case of parallel neighbors, the 5′ elements could drive the expression of both the immediately adjacent gene and its downstream partner, while in the case of divergent opposite-strand neighboring gene pairs, the same 5′ element could drive both genes, assuming that its mechanism of action is strand independent. Convergent genes, however, cannot share the same 5′ cis-regulatory elements and, therefore, cannot be coexpressed via this mechanism.
As an extension of our study, we examined the conservation and expression patterns of overlapping genes. Our analysis of overlapping genes in C. elegans revealed some interesting similarities between overlapping genes in this species and those of other species. Qualitatively, the categories of overlapping genes and the numbers of gene pairs within individual categories are similar to those previously reported in Drosophila melanogaster, another invertebrate whose genome size is roughly comparable to C. elegans. We reported 18 pairs of interleaved gene pairs, while Misra et al. (2002) reported 26 pairs in D. melanogaster. The largest category of overlapping genes, the nested genes (including the flanking genes that contain them), constitutes about 2.7% of the C. elegans protein-coding genes, as opposed to 6.1% of D. melanogaster genes. Both C. elegans and D. melanogaster show large biases in the frequencies with which certain overlapping topologies occur. Of the 547 nested gene pairs in C. elegans, the majority (490, or 88%) were opposite-strand nested gene pairs (Table 1), which is consistent with the distribution of such gene pairs in D. melanogaster (65%) (Misra et al. 2002). This bias is presumably due to the challenges that same-strand nesting poses to the splicing machinery, but might also reflect the challenges of annotating this type of topology. In addition, for gene pairs that reside on opposite strands, the C. elegans genome has many more convergent overlapping genes than divergent ones. This bias is similar in magnitude to the difference in frequency we observed in close neighboring genes, where convergent neighbors separated by 200 bp or less are seven times more common than divergent pairs, and is similar to the patterns of overlapping genes in the fruit fly, as well as prokaryotes (Fukuda et al. 2003) and the human and mouse genomes (Veeramachaneni et al. 2004). One explanation for this bias is that the transcriptional machinery needs a certain amount of intergenic space in order to avoid interference between the cis-regulatory elements of divergent genes, and is consistent with a model of transcriptional coupling in which transcription of divergent genes are driven off the same 5′ cis-regulatory elements. The consistency of the frequencies with which different types of overlapping genes occur in C. elegans and D. melanogaster points to common patterns of genome evolution and regulation, despite the large differences in chromosome-level organization among the two species.
By comparing overlapping genes in C. elegans to their orthologs in C. briggsae (estimated to have diverged from their most recent common ancestor roughly 85 million years ago), we showed that most classes of the overlapping genes are more highly conserved at the protein level than the genome-wide average as measured by an increased percentage identification among orthologs of overlapping gene pairs. In addition, we were able to document that most classes of overlapping genes are subject to higher levels of purifying selection. The increased conservation of overlapping genes was most marked for the two classes of overlapping genes on the same strand, and weakest for the nested genes in nested gene pairs. This finding is in contrast to the recent analysis of overlapping genes in the human and mouse genomes (Veeramachaneni et al. 2004), in which the authors failed to find differences in conservation among overlapping and nonoverlapping genes. The cause for this discrepancy is not immediately obvious, but one possible explanation is that the C. elegans genes are better annotated, owing to the intensive hand curation of the C. elegans genes and the relative simplicity of C. elegans gene structures. In addition, the mouse and human nested genes were analyzed as a single group in Veeramachaneni et al. (2004), while we separated nested genes into same-strand nested genes and opposite nested genes and then subdivided them into flanking and nested genes for conservation analysis. Because the effect in the nested members of pairs is relatively weak, pooling the flanking and nested genes may have diluted the signal in the mouse and human genomes.
Consistent with our finding that overlapping genes are under greater purifying selection than the genome-wide average, we found that overlapping gene pairs are enriched with essential genes and genes with defined phenotypes in various genome-wide RNAi trials. In addition to the conservation of the protein products of individual genes in overlapping gene pairs, we found that the overlapping topology itself is subject to evolutionary constraint. The orthologs of overlapping gene pairs in C. elegans are much more likely to be found in an overlapping relationship in C. briggsae than would be expected by comparison with adjacent nonoverlapping neighbors. This is perhaps not surprising; once two genes are topologically entangled, it may be difficult to disentangle them by the usual processes of translocation, insertion, and deletion without destroying one or both of them.
These results might suggest that there is functional significance to the overlapping topology. Some authors have suggested that overlapping genes are coregulated (Fukuda et al. 2003), but we demonstrated a complete absence of transcriptional coupling. How, then, to explain the striking degree of conservation of both the protein products of overlapping genes and their topology? We believe that the observed conservation for nested overlapping genes is best explained by a model we call the “sheltered island hypothesis” (Fig. 8). Over evolutionary time, two overlapping genes can become disentangled by such rearrangement events as translocations, insertions, and deletions. However, if one or both of the overlapping genes is an essential gene, such a disentanglement event is more likely to disrupt the essential function, thereby leading to the death of the organism. Hence, over evolutionary time, overlapping gene pairs that involve conserved and essential genes are more likely to persist than those that involve nonessential genes. Consistent with this model is the observation that in nested gene pairs—in which one gene is completely contained within the intron of another—it is the flanking gene that is highly conserved, while the nested gene is only slightly more conserved than the genome-wide average. Because deletions or other rearrangements that would separate the two genes would more likely disrupt the structure of the flanking gene, because it is the larger target, the sheltered island model predicts that selection favors the overlapping topology when the flanking gene is a highly conserved essential gene.
Figure 8.

Nested gene pairs. “Sheltered Island Model” exons are represented as boxes and introns are represented as lines. Exons of the essential genes are coded in black. Exons of the nonessential genes are represented as hollow boxes. UTRs are coded as light-gray boxes.
In summary, our analysis of the topology of neighboring and overlapping genes in C. elegans suggests that nearby genes are often transcriptionally coupled, probably by the presence of shared 5′ cis-regulatory elements, which can act over distances that span one or more intervening genes. Convergent neighboring and overlapping genes and nested overlapping genes pairs show an almost complete loss of correlation in gene expression. Overlapping genes are under higher levels of purifying selection than the genome-wide average, but the correlation more likely reflects the overlapping topology being an effect of the purifying selection, rather than the cause.
Methods
Data mining using WormBase
C. elegans gene annotation and functional genomics data are taken from WormBase (http://www.wormbase.org/) release WS130 (http://ws130.wormbase.org/). WormBase is an integrated database system with user-friendly Web interface. Its backend database system consists of an ACeDB server (http://www.acedb.org/) and a MySQL server (http://www.mysql.org/). Data at WormBase can be retrieved via five different ways designed to accommodate different users with different expertise and needs (Chen et al. 2005). For this project, we set up a local WormBase server so that we have pragmatic access via AcePerl (http://stein.cshl.edu/AcePerrl/) and Bio::DB::GFF PERL (http://www.perl.org) modules. Representative images for various types of overlapping gene pairs were taken from WormBase Web site.
Ortholog assignment
Orthologous relationship between C. elegans and C. briggsae genes were identified using InParanoid (O’Brien et al. 2005) as instructed.
Calculating synonymous and nonsynonymous values
We calculated the synonymous (Ks) and nonsynonymous (Ka) substitution rates for these genes using a maximum likelihood (ML) algorithm that corrects for reversion events implemented in the software package PMAL (Yang 1997). Protein percentage identity was calculated via multiple alignment using CLUSTALW (Higgins et al. 1996).
Gene expression correlation
We retrieved the SAGE tag frequency values for overlapping genes in eight different SAGE libraries from the British Columbia Genome Science Center (http://elegans.bcgsc.ca/) (McKay et al. 2003). These eight SAGE libraries are SWEG1 (FACS-sorted gut cells), SWEM1 (FACS-sorted muscle cells, replicate 1), SW031 (FACS-sorted muscle cells, replicate 2), SW028 (FACS-sorted pan-neural cells), SW023 (FACS sorted ciliated neurons), SW034 (FACS-sorted AFD neurons), SW033 (FACS-sorted pharynx cells), and SW030 (FACS-sorted hypodermal cells). SAGE libraries corresponding to mixed tissues and whole animal extracts were not used. Ambiguous SAGE tags that can be mapped to more than one transcript are removed and are not considered in our analyses. Gene pairs with genes in which the SAGE tag frequency values in all eight libraries did not exceed five were not included in the calculation, so that we only processed gene pairs with high-quality SAGE frequency values. Pearson correlation coefficient value between two genes was calculated using the following standard equation:
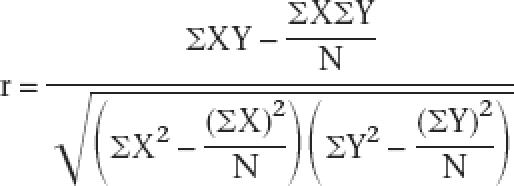 |
X and Y represent SAGE tags sequenced from different SAGE libraries, and N equals 8 (eight different SAGE libraries).
Acknowledgments
We thank three anonymous reviewers for their comments. We thank Dr. Kenny Ye for assistance with statistics; Dr. Thomas Blumenthal for advice on operons in C. elegans; Drs. Ian Korf and Keith Bradnam for helpful discussions. The SAGE libraries were obtained from the British Columbia Genome Science Center (http://elegans.bcgsc.ca/).
Footnotes
[Supplemental material is available online at www.genome.org.]
Article published online before print. Article and publication date are at http://www.genome.org/cgi/doi/10.1101/gr.4515306
References
- Blumenthal T. Operons in eukaryotes. Brief Funct. Genomic Proteomic. 2004;3:199–211. doi: 10.1093/bfgp/3.3.199. [DOI] [PubMed] [Google Scholar]
- Blumenthal T., Evans D., Link C.D., Guffanti A., Lawson D., Thierry-Mieg J., Thierry-Mieg D., Chiu W.L., Duke K., Kiraly M., Evans D., Link C.D., Guffanti A., Lawson D., Thierry-Mieg J., Thierry-Mieg D., Chiu W.L., Duke K., Kiraly M., Link C.D., Guffanti A., Lawson D., Thierry-Mieg J., Thierry-Mieg D., Chiu W.L., Duke K., Kiraly M., Guffanti A., Lawson D., Thierry-Mieg J., Thierry-Mieg D., Chiu W.L., Duke K., Kiraly M., Lawson D., Thierry-Mieg J., Thierry-Mieg D., Chiu W.L., Duke K., Kiraly M., Thierry-Mieg J., Thierry-Mieg D., Chiu W.L., Duke K., Kiraly M., Thierry-Mieg D., Chiu W.L., Duke K., Kiraly M., Chiu W.L., Duke K., Kiraly M., Duke K., Kiraly M., Kiraly M., et al. A global analysis of Caenorhabditis elegans operons. Nature. 2002;417:851–854. doi: 10.1038/nature00831. [DOI] [PubMed] [Google Scholar]
- C. elegans Sequencing Consortium Genome sequence of the nematode C. elegans: A platform for investigating biology. Science. 1998;282:2012–2018. doi: 10.1126/science.282.5396.2012. [DOI] [PubMed] [Google Scholar]
- Celniker S.E., Rubin G.M., Rubin G.M. The Drosophila melanogaster genome. Annu. Rev. Genomics Hum. Genet. 2003;4:89–117. doi: 10.1146/annurev.genom.4.070802.110323. [DOI] [PubMed] [Google Scholar]
- Chen N., Lawson D., Bradnam K., Harris T.W., Stein L.D., Lawson D., Bradnam K., Harris T.W., Stein L.D., Bradnam K., Harris T.W., Stein L.D., Harris T.W., Stein L.D., Stein L.D. WormBase as an integrated platform for the C. elegans ORFeome. Genome Res. 2004;14:2155–2161. doi: 10.1101/gr.2521304. [DOI] [PMC free article] [PubMed] [Google Scholar]
- Chen N., Harris T.W., Antoshechkin I., Bastiani C., Bieri T., Blasiar D., Bradnam K., Canaran P., Chan J., Chen C.K., Harris T.W., Antoshechkin I., Bastiani C., Bieri T., Blasiar D., Bradnam K., Canaran P., Chan J., Chen C.K., Antoshechkin I., Bastiani C., Bieri T., Blasiar D., Bradnam K., Canaran P., Chan J., Chen C.K., Bastiani C., Bieri T., Blasiar D., Bradnam K., Canaran P., Chan J., Chen C.K., Bieri T., Blasiar D., Bradnam K., Canaran P., Chan J., Chen C.K., Blasiar D., Bradnam K., Canaran P., Chan J., Chen C.K., Bradnam K., Canaran P., Chan J., Chen C.K., Canaran P., Chan J., Chen C.K., Chan J., Chen C.K., Chen C.K., et al. WormBase: A comprehensive data resource for Caenorhabditis biology and genomics. Nucleic Acids Res. 2005;33:D383–D389. doi: 10.1093/nar/gki066. [DOI] [PMC free article] [PubMed] [Google Scholar]
- Cho R.J., Campbell M.J., Winzeler E.A., Steinmetz L., Conway A., Wodicka L., Wolfsberg T.G., Gabrielian A.E., Landsman D., Lockhart D.J., Campbell M.J., Winzeler E.A., Steinmetz L., Conway A., Wodicka L., Wolfsberg T.G., Gabrielian A.E., Landsman D., Lockhart D.J., Winzeler E.A., Steinmetz L., Conway A., Wodicka L., Wolfsberg T.G., Gabrielian A.E., Landsman D., Lockhart D.J., Steinmetz L., Conway A., Wodicka L., Wolfsberg T.G., Gabrielian A.E., Landsman D., Lockhart D.J., Conway A., Wodicka L., Wolfsberg T.G., Gabrielian A.E., Landsman D., Lockhart D.J., Wodicka L., Wolfsberg T.G., Gabrielian A.E., Landsman D., Lockhart D.J., Wolfsberg T.G., Gabrielian A.E., Landsman D., Lockhart D.J., Gabrielian A.E., Landsman D., Lockhart D.J., Landsman D., Lockhart D.J., Lockhart D.J., et al. A genome-wide transcriptional analysis of the mitotic cell cycle. Mol. Cell. 1998;2:65–73. doi: 10.1016/s1097-2765(00)80114-8. [DOI] [PubMed] [Google Scholar]
- Cohen B.A., Mitra R.D., Hughes J.D., Church G.M., Mitra R.D., Hughes J.D., Church G.M., Hughes J.D., Church G.M., Church G.M. A computational analysis of whole-genome expression data reveals chromosomal domains of gene expression. Nat. Genet. 2000;26:183–186. doi: 10.1038/79896. [DOI] [PubMed] [Google Scholar]
- Fraser A.G., Kamath R.S., Zipperlen P., Martinez-Campos M., Sohrmann M., Ahringer J., Kamath R.S., Zipperlen P., Martinez-Campos M., Sohrmann M., Ahringer J., Zipperlen P., Martinez-Campos M., Sohrmann M., Ahringer J., Martinez-Campos M., Sohrmann M., Ahringer J., Sohrmann M., Ahringer J., Ahringer J. Functional genomic analysis of C. elegans chromosome I by systematic RNA interference. Nature. 2000;408:325–330. doi: 10.1038/35042517. [DOI] [PubMed] [Google Scholar]
- Fukuda Y., Nakayama Y., Tomita M., Nakayama Y., Tomita M., Tomita M. On dynamics of overlapping genes in bacterial genomes. Gene. 2003;323:181–187. doi: 10.1016/j.gene.2003.09.021. [DOI] [PubMed] [Google Scholar]
- Gonczy P., Echeverri C., Oegema K., Coulson A., Jones S.J., Copley R.R., Duperon J., Oegema J., Brehm M., Cassin E., Echeverri C., Oegema K., Coulson A., Jones S.J., Copley R.R., Duperon J., Oegema J., Brehm M., Cassin E., Oegema K., Coulson A., Jones S.J., Copley R.R., Duperon J., Oegema J., Brehm M., Cassin E., Coulson A., Jones S.J., Copley R.R., Duperon J., Oegema J., Brehm M., Cassin E., Jones S.J., Copley R.R., Duperon J., Oegema J., Brehm M., Cassin E., Copley R.R., Duperon J., Oegema J., Brehm M., Cassin E., Duperon J., Oegema J., Brehm M., Cassin E., Oegema J., Brehm M., Cassin E., Brehm M., Cassin E., Cassin E., et al. Functional genomic analysis of cell division in C. elegans using RNAi of genes on chromosome III. Nature. 2000;408:331–336. doi: 10.1038/35042526. [DOI] [PubMed] [Google Scholar]
- Higgins D.G., Thompson J.D., Gibson T.J., Thompson J.D., Gibson T.J., Gibson T.J. Using CLUSTAL for multiple sequence alignments. Methods Enzymol. 1996;266:383–402. doi: 10.1016/s0076-6879(96)66024-8. [DOI] [PubMed] [Google Scholar]
- Hurst L.D., Pal C., Lercher M.J., Pal C., Lercher M.J., Lercher M.J. The evolutionary dynamics of eukaryotic gene order. Nat. Rev. Genet. 2004;5:299–310. doi: 10.1038/nrg1319. [DOI] [PubMed] [Google Scholar]
- Hwang B.J., Muller H.M., Sternberg P.W., Muller H.M., Sternberg P.W., Sternberg P.W. Genome annotation by high-throughput 5′ RNA end determination. Proc. Natl. Acad. Sci. 2004;101:1650–1655. doi: 10.1073/pnas.0308384100. [DOI] [PMC free article] [PubMed] [Google Scholar]
- Kamath R.S., Ahringer J., Ahringer J. Genome-wide RNAi screening in Caenorhabditis elegans. Methods. 2003;30:313–321. doi: 10.1016/s1046-2023(03)00050-1. [DOI] [PubMed] [Google Scholar]
- Katayama S., Tomaru Y., Kasukawa T., Waki K., Nakanishi M., Nakamura M., Nishida H., Yap C.C., Suzuki M., Kawai J., Tomaru Y., Kasukawa T., Waki K., Nakanishi M., Nakamura M., Nishida H., Yap C.C., Suzuki M., Kawai J., Kasukawa T., Waki K., Nakanishi M., Nakamura M., Nishida H., Yap C.C., Suzuki M., Kawai J., Waki K., Nakanishi M., Nakamura M., Nishida H., Yap C.C., Suzuki M., Kawai J., Nakanishi M., Nakamura M., Nishida H., Yap C.C., Suzuki M., Kawai J., Nakamura M., Nishida H., Yap C.C., Suzuki M., Kawai J., Nishida H., Yap C.C., Suzuki M., Kawai J., Yap C.C., Suzuki M., Kawai J., Suzuki M., Kawai J., Kawai J., et al. Antisense transcription in the mammalian transcriptome. Science. 2005;309:1564–1566. doi: 10.1126/science.1112009. [DOI] [PubMed] [Google Scholar]
- Kruglyak S., Tang H., Tang H. Regulation of adjacent yeast genes. Trends Genet. 2000;16:109–111. doi: 10.1016/s0168-9525(99)01941-1. [DOI] [PubMed] [Google Scholar]
- Lercher M.J., Blumenthal T., Hurst L.D., Blumenthal T., Hurst L.D., Hurst L.D. Coexpression of neighboring genes in Caenorhabditis elegans is mostly due to operons and duplicate genes. Genome Res. 2003;13:238–243. doi: 10.1101/gr.553803. [DOI] [PMC free article] [PubMed] [Google Scholar]
- McKay S.J., Johnsen R., Khattra J., Asano J., Baillie D.L., Chan S., Dube N., Fang L., Goszczynski B., Ha E., Johnsen R., Khattra J., Asano J., Baillie D.L., Chan S., Dube N., Fang L., Goszczynski B., Ha E., Khattra J., Asano J., Baillie D.L., Chan S., Dube N., Fang L., Goszczynski B., Ha E., Asano J., Baillie D.L., Chan S., Dube N., Fang L., Goszczynski B., Ha E., Baillie D.L., Chan S., Dube N., Fang L., Goszczynski B., Ha E., Chan S., Dube N., Fang L., Goszczynski B., Ha E., Dube N., Fang L., Goszczynski B., Ha E., Fang L., Goszczynski B., Ha E., Goszczynski B., Ha E., Ha E., et al. Gene expression profiling of cells, tissues, and developmental stages of the nematode C. elegans. Cold Spring Harb. Symp. Quant. Biol. 2003;68:159–169. doi: 10.1101/sqb.2003.68.159. [DOI] [PubMed] [Google Scholar]
- Misra S., Crosby M.A., Mungall C.J., Matthews B.B., Campbell K.S., Hradecky P., Huang Y., Kaminker J.S., Millburn G.H., Prochnik S.E., Crosby M.A., Mungall C.J., Matthews B.B., Campbell K.S., Hradecky P., Huang Y., Kaminker J.S., Millburn G.H., Prochnik S.E., Mungall C.J., Matthews B.B., Campbell K.S., Hradecky P., Huang Y., Kaminker J.S., Millburn G.H., Prochnik S.E., Matthews B.B., Campbell K.S., Hradecky P., Huang Y., Kaminker J.S., Millburn G.H., Prochnik S.E., Campbell K.S., Hradecky P., Huang Y., Kaminker J.S., Millburn G.H., Prochnik S.E., Hradecky P., Huang Y., Kaminker J.S., Millburn G.H., Prochnik S.E., Huang Y., Kaminker J.S., Millburn G.H., Prochnik S.E., Kaminker J.S., Millburn G.H., Prochnik S.E., Millburn G.H., Prochnik S.E., Prochnik S.E., et al. 2002Annotation of the Drosophila melanogaster euchromatic genome: A systematic review. Genome Biol. 3 research0083. [DOI] [PMC free article] [PubMed] [Google Scholar]
- O’Brien K.P., Remm M., Sonnhammer E.L., Remm M., Sonnhammer E.L., Sonnhammer E.L. Inparanoid: A comprehensive database of eukaryotic orthologs. Nucleic Acids Res. 2005;33:D476–D480. doi: 10.1093/nar/gki107. [DOI] [PMC free article] [PubMed] [Google Scholar]
- Piano F., Schetter A.J., Morton D.G., Gunsalus K.C., Reinke V., Kim S.K., Kemphues K.J., Schetter A.J., Morton D.G., Gunsalus K.C., Reinke V., Kim S.K., Kemphues K.J., Morton D.G., Gunsalus K.C., Reinke V., Kim S.K., Kemphues K.J., Gunsalus K.C., Reinke V., Kim S.K., Kemphues K.J., Reinke V., Kim S.K., Kemphues K.J., Kim S.K., Kemphues K.J., Kemphues K.J. Gene clustering based on RNAi phenotypes of ovary-enriched genes in C. elegans. Curr. Biol. 2002;12:1959–1964. doi: 10.1016/s0960-9822(02)01301-5. [DOI] [PubMed] [Google Scholar]
- Reznikoff W.S. The operon revisited. Annu. Rev. Genet. 1972;6:133–156. doi: 10.1146/annurev.ge.06.120172.001025. [DOI] [PubMed] [Google Scholar]
- Rual J.F., Hill D.E., Vidal M., Hill D.E., Vidal M., Vidal M. ORFeome projects: Gateway between genomics and omics. Curr. Opin. Chem. Biol. 2004;8:20–25. doi: 10.1016/j.cbpa.2003.12.002. [DOI] [PubMed] [Google Scholar]
- Sanger F., Air G.M., Barrell B.G., Brown N.L., Coulson A.R., Fiddes C.A., Hutchison C.A., Slocombe P.M., Smith M., Air G.M., Barrell B.G., Brown N.L., Coulson A.R., Fiddes C.A., Hutchison C.A., Slocombe P.M., Smith M., Barrell B.G., Brown N.L., Coulson A.R., Fiddes C.A., Hutchison C.A., Slocombe P.M., Smith M., Brown N.L., Coulson A.R., Fiddes C.A., Hutchison C.A., Slocombe P.M., Smith M., Coulson A.R., Fiddes C.A., Hutchison C.A., Slocombe P.M., Smith M., Fiddes C.A., Hutchison C.A., Slocombe P.M., Smith M., Hutchison C.A., Slocombe P.M., Smith M., Slocombe P.M., Smith M., Smith M. Nucleotide sequence of bacteriophage ϕX174 DNA. Nature. 1977;265:687–695. doi: 10.1038/265687a0. [DOI] [PubMed] [Google Scholar]
- Shintani S., O’Huigin C., Toyosawa S., Michalova V., Klein J., O’Huigin C., Toyosawa S., Michalova V., Klein J., Toyosawa S., Michalova V., Klein J., Michalova V., Klein J., Klein J. Origin of gene overlap: The case of TCP1 and ACAT2. Genetics. 1999;152:743–754. doi: 10.1093/genetics/152.2.743. [DOI] [PMC free article] [PubMed] [Google Scholar]
- Spencer C.A., Gietz R.D., Hodgetts R.B., Gietz R.D., Hodgetts R.B., Hodgetts R.B. Overlapping transcription units in the dopa decarboxylase region of Drosophila. Nature. 1986;322:279–281. doi: 10.1038/322279a0. [DOI] [PubMed] [Google Scholar]
- Stein L.D., Mungall C., Shu S., Caudy M., Mangone M., Day A., Nickerson E., Stajich J.E., Harris T.W., Arva A., Mungall C., Shu S., Caudy M., Mangone M., Day A., Nickerson E., Stajich J.E., Harris T.W., Arva A., Shu S., Caudy M., Mangone M., Day A., Nickerson E., Stajich J.E., Harris T.W., Arva A., Caudy M., Mangone M., Day A., Nickerson E., Stajich J.E., Harris T.W., Arva A., Mangone M., Day A., Nickerson E., Stajich J.E., Harris T.W., Arva A., Day A., Nickerson E., Stajich J.E., Harris T.W., Arva A., Nickerson E., Stajich J.E., Harris T.W., Arva A., Stajich J.E., Harris T.W., Arva A., Harris T.W., Arva A., Arva A., et al. The generic genome browser: A building block for a model organism system database. Genome Res. 2002;12:1599–1610. doi: 10.1101/gr.403602. [DOI] [PMC free article] [PubMed] [Google Scholar]
- Stein L.D., Bao Z., Blasiar D., Blumenthal T., Brent M.R., Chen N., Chinwalla A., Clarke L., Clee C., Coghlan A., Bao Z., Blasiar D., Blumenthal T., Brent M.R., Chen N., Chinwalla A., Clarke L., Clee C., Coghlan A., Blasiar D., Blumenthal T., Brent M.R., Chen N., Chinwalla A., Clarke L., Clee C., Coghlan A., Blumenthal T., Brent M.R., Chen N., Chinwalla A., Clarke L., Clee C., Coghlan A., Brent M.R., Chen N., Chinwalla A., Clarke L., Clee C., Coghlan A., Chen N., Chinwalla A., Clarke L., Clee C., Coghlan A., Chinwalla A., Clarke L., Clee C., Coghlan A., Clarke L., Clee C., Coghlan A., Clee C., Coghlan A., Coghlan A., et al. The genome sequence of Caenorhabditis briggsae: A platform for comparative genomics. PLoS Biol. 2003;1:E45. doi: 10.1371/journal.pbio.0000045. [DOI] [PMC free article] [PubMed] [Google Scholar]
- Vanhee-Brossollet C., Vaquero C., Vaquero C. Do natural antisense transcripts make sense in eukaryotes? Gene. 1998;211:1–9. doi: 10.1016/s0378-1119(98)00093-6. [DOI] [PubMed] [Google Scholar]
- Veeramachaneni V., Makalowski W., Galdzicki M., Sood R., Makalowska I., Makalowski W., Galdzicki M., Sood R., Makalowska I., Galdzicki M., Sood R., Makalowska I., Sood R., Makalowska I., Makalowska I. Mammalian overlapping genes: The comparative perspective. Genome Res. 2004;14:280–286. doi: 10.1101/gr.1590904. [DOI] [PMC free article] [PubMed] [Google Scholar]
- Williams E.J., Bowles D.J., Bowles D.J. Coexpression of neighboring genes in the genome of Arabidopsis thaliana. Genome Res. 2004;14:1060–1067. doi: 10.1101/gr.2131104. [DOI] [PMC free article] [PubMed] [Google Scholar]
- Yang Z. PAML: A program package for phylogenetic analysis by maximum likelihood. Comput. Appl. Biosci. 1997;13:555–556. doi: 10.1093/bioinformatics/13.5.555. [DOI] [PubMed] [Google Scholar]
- Yang Z., Nielsen R., Nielsen R. Estimating synonymous and nonsynonymous substitution rates under realistic evolutionary models. Mol. Biol. Evol. 2000;17:32–43. doi: 10.1093/oxfordjournals.molbev.a026236. [DOI] [PubMed] [Google Scholar]