

Abstract
We describe the use of model-driven analysis of multiple data types relevant to transcriptional regulation of metabolism to discover novel regulatory mechanisms in Saccharomyces cerevisiae. We have reconstructed the nutrient-controlled transcriptional regulatory network controlling metabolism in S. cerevisiae consisting of 55 transcription factors regulating 750 metabolic genes, based on information in the primary literature. This reconstructed regulatory network coupled with an existing genome-scale metabolic network model allows in silico prediction of growth phenotypes of regulatory gene deletions as well as gene expression profiles. We compared model predictions of gene expression changes in response to genetic and environmental perturbations to experimental data to identify potential novel targets for transcription factors. We then identified regulatory cascades connecting transcription factors to the potential targets through a systematic model expansion strategy using published genome-wide chromatin immunoprecipitation and binding-site-motif data sets. Finally, we show the ability of an integrated metabolic and regulatory network model to predict growth phenotypes of transcription factor knockout strains. These studies illustrate the potential of model-driven data integration to systematically discover novel components and interactions in regulatory and metabolic networks in eukaryotic cells.
Current biological research produces increasing volumes of data describing cellular components, their interactions, and states of biological networks for model organisms including the budding yeast, Saccharomyces cerevisiae. Component and interaction data including genome sequences (Bussey et al. 1997), protein complexes (Gavin et al. 2006), and protein–DNA interactions (Harbison et al. 2004) can be used to establish the connectivity of the biochemical networks inside the cell. System-state data types including gene expression (DeRisi et al. 1997), metabolite level (Villas-Boas et al. 2005), metabolic flux (Sauer 2004), and high-throughput deletion strain phenotyping (Giaever et al. 2002) data represent the states and outputs of these networks. Connecting large-scale component and interaction information to data on system states in order to facilitate the interpretation of both data types is a major challenge in systems biology. The data integration and interpretation task is made challenging by the incompleteness and noisiness of large-scale data sets (Grunenfelder and Winzeler 2002).
Given these issues with large-scale data sets, systematic inclusion of literature-derived information on network structures into the analysis represents an appealing alternative to purely data-driven approaches. The widespread availability of component and biochemical interaction information in the primary literature has enabled the reconstruction of chemically and biologically consistent mathematical descriptions of biochemical networks in well-studied model organisms (Herrgård et al. 2004; Price et al. 2004). These network models can then be used to predict changes in system states in response to genetic and environmental perturbations. Furthermore, model predictions can be directly compared with experimental data obtained, for example, by metabolic flux or gene expression profiling (Covert et al. 2004; Price et al. 2004). As a result of these comparisons, modifications to the biochemical network model that would improve its ability to predict system states can be identified to iteratively improve the model.
In the case of metabolic networks, the network reconstruction step can now be routinely done and has been accomplished for a number of key model organisms including Escherichia coli (Reed et al. 2003) and Saccharomyces cerevisiae (Famili et al. 2003; Duarte et al. 2004). Using a reconstructed genome-scale stoichiometric matrix as a starting point, the constraint-based modeling framework (Price et al. 2004) can then be used to make phenotypic predictions that can be compared to experimental data. Frequently used constraint-based approaches include flux-balance analysis (FBA) that allows the prediction of flux distributions and growth rates based on known metabolic network stoichiometry, growth media composition, and biomass composition (Kauffman et al. 2003). The constraint-based framework has been extended to account for transcriptional regulation of metabolism in the form of the regulated flux-balance analysis (rFBA) approach (Covert et al. 2001). This approach requires first reconstructing the transcriptional regulatory network structure in the form of Boolean rules based on the various available data sources and then integrating this network with the metabolic network model. So far the rFBA approach has been applied to make predictions of growth phenotypes and qualitative gene expression changes in E. coli (Covert and Palsson 2002; Covert et al. 2004)
Here we present the first large-scale integrated model of metabolism and its transcriptional regulation in a eukaryotic organism, S. cerevisiae iMH805/775.3 The current model includes the majority of known nutrient-controlled transcriptional regulation (55 transcription factors) of metabolic pathways (750 genes in total) represented in a Boolean rule-based formalism (Covert et al. 2001). The regulatory network model is combined with an existing genomescale metabolic model, iND750 (Duarte et al. 2004). We demonstrate three major applications of the iMH805/775 model using the rFBA approach to predict gene expression changes and growth phenotypes of knockout (KO) strains. First, we analyze previously published genome-scale gene expression and protein–DNA interaction data sets in a model-driven fashion. Second, we demonstrate the ability to iteratively expand an existing model based on comparisons of model predictions with experimental data. This iterative model building strategy allows identification of new interactions supported by multiple experimental data types and inclusion of these interactions into the regulatory network model. Third, we show how an integrated metabolic/regulatory network model can be used to analyze diverse data types such as phenotyping and gene expression data simultaneously within the same modeling framework. The overall approach used for model-based integration of diverse data sets is schematically represented in Figure 1.
Figure 1.

A schematic drawing of the approach used in this work for model-based analysis of growth phenotyping and gene expression data to identify new network components and interactions. The approach combines in silico modeling of genome-scale metabolic and regulatory networks with analysis of in vivo data obtained by gene expression and growth phenotyping experiments. Specific mispredictions of either gene expression changes or growth phenotypes are identified and used as inputs for systematic model expansion. The primary data types used for model expansion are ChIP-chip data on protein–DNA interactions and the presence of known TF-binding motifs on promoters. The result of the expansion is a model that includes new regulatory interactions that allow improved prediction of expression changes and growth phenotypes of knockout and overexpression strains.
Results
Reconstructed transcriptional regulatory network
Using the previously described genome-scale compartmentalized metabolic model of S. cerevisiae, iND750 (Duarte et al. 2004), as a starting point, we reconstructed the transcriptional regulatory network regulating all of the metabolic subsystems included in iND750. The resulting integrated metabolic/regulatory network, iMH805/775, accounts for 805 genes and 775 regulatory interactions. The network consists of the 750 metabolic genes in iND750 and 55 specific nutrient-regulated transcription factors (TFs). The model allows 82 distinct intra- and extracellular metabolites to act as input signals to the regulatory network. The direct and indirect regulatory interactions for each gene were collected from primary literature, and they are based on detailed studies of transcriptional regulation of individual genes. In addition to representing these regulatory interactions, iMH805/775 also includes rules describing the mode of combinatorial control by different TFs at each promoter. This logic-based representation allows in silico prediction of gene expression changes in response to environmental and genetic perturbations and integration of the regulatory network to the metabolic network model as described previously (Covert and Palsson 2002; Covert et al. 2004). The Supplemental material contains all the interactions included in the model, the Boolean rules describing the expression of each target gene, and literature references.
Prediction of gene expression changes
In order to assess the completeness of the iMH805/775 network described above, we compared in silico gene expression change predictions to experimentally measured expression profiles as well as experimentally determined protein–DNA interactions (chromatin immunoprecipitation followed by microarray analysis, or ChIP-chip) and predicted TF-binding motifs (Harbison et al. 2004). We used gene expression data for eight transcription factor knockout strains (rgt1, rox1, gat1, hap1, adr1, gal4, gln3, cat8) and two overexpression (HAP4, GCN4) strains from previously published reports (Ideker et al. 2001; Natarajan et al. 2001; Ter Linde and Steensma 2002; Lascaris et al. 2003; Young et al. 2003; Kaniak et al. 2004). Each of the 750 metabolic genes in iMH805/775 was classified as significantly up-regulated, significantly down-regulated, or unchanged in each of the 10 experimental data sets. The in silico simulations for the gene expression predictions were done using in silico environments that matched the experimental conditions for each individual expression data set. The ChIP-chip and motif data were merged to obtain a set of potential direct target genes for each of the 10 transcription factors listed above.
The results for the comparison between iMH805/775 predictions, experimentally observed gene expression changes, and experimentally determined protein–DNA interactions are summarized in Figure 2. For the majority of genes (between 523 and 689 genes) in each of the 10 strains, there was no significant expression change in vivo, no change predicted by the model, and no experimentally determined protein–DNA interaction between the transcription factor and the gene. Overall, 45 out of the 114 predicted gene expression changes (P < 1 × 10⁻¹⁴; Fisher’s exact test) were supported by both gene expression and ChIP-chip/motif data, and 86 changes (P < 1 × 10−57) were supported by either of the data types. Figure 2C provides a summary of the actual data that were used to derive Figure 2A in the form of scatterplots of the promoter occupancy scores derived from ChIP-chip data plotted against gene expression changes in the corresponding TF knockout or overexpression strains. This figure shows how the correlation between promoter occupancy and expression change ranges from a high level of agreement for certain TFs (Gcn4, Gal4, and Rgt1) to almost complete lack of agreement for other TFs (e.g., Gln3 and Gat1).
Figure 2.

Comparison between expression changes in TF knockout and overexpression strains predicted by iMH805/775, in vivo observed expression changes, and promoter occupancy for the corresponding TFs derived from ChIP-chip and motif data. (A) Overlaps between the three data sets shown in the form of Venn diagrams. The numbers refer to the number of genes in each category out of the total of 750 metabolic genes. (B) Interpretation of each of the segments in the Venn diagrams shown in A. (C) Scatterplots of the gene expression changes in TF knockout/overexpression strains (log2 ratios between knockout strain and wild type) and the corresponding promoter occupancy scores derived from ChIP-chip data (−log10 of the P-value reported in Harbison et al. [2004). The genes that were predicted to change in expression by the iMH805/775 model are indicated by blue circles. Genes with significant gene expression change or promoter occupancy are colored using a color scheme similar to the one used in the Venn diagrams in A.
As Figure 2A shows, the majority of the comparisons in which the model did not predict an expression change fell into three categories. The first category—evidence of binding in the ChIP-chip data, but no gene expression change (191 cases overall)—includes cases in which there are likely to be additional regulators acting on the same promoter in a combinatorial fashion. For this reason, expression changes are not observed in a single TF knockout or overexpression experiment. In the second category, both the gene expression and ChIP-chip data sets agree (80 cases overall), providing strong support for including these genes as novel direct targets for the corresponding TFs. In the third and largest category (418 cases overall), a gene expression change was observed, but there was no evidence of direct protein–DNA binding in the ChIP-chip data. These cases correspond to suggested indirect targets of TFs that may be regulated by transcriptional cascades that involve two or more TFs.
Systematic expansion of the regulatory network
Based on the results presented above, it is clear that while the model makes relatively few gene expression change predictions that were not supported by either gene expression or ChIP-chip data (28 cases overall), for many metabolic genes, iMH805/775 predicts no expression change even in cases in which such changes are observed in vivo (a total of 498 cases across all 10 strains). We next sought to improve the predictive ability of the in silico model by using ChIP-chip and TF-binding motif data (Harbison et al. 2004) to systematically expand the regulatory network part of the model. First, the gene expression comparison presented above was used to identify potential novel candidate target genes for each of the 10 transcription factors (498 TF-target pairs total). Next, we traced paths through an expanded regulatory network that consisted of the iMH805/775 network and a provisional regulatory network that can be established based on combining ChIP-chip data and TF-binding motif data (Harbison et al. 2004). We used a systematic search algorithm (see Methods for details) to find the shortest possible path from a particular TF to a particular target gene through this combined network.
We investigated three different network expansion scenarios using the search algorithm. In the first scenario, we only used ChIP-chip and motif data for the 55 TFs already included in the model. We also required that the direction of the expression change for each target gene would be correctly explained as a combination of the regulatory interactions along the path when each TF was considered to be either a repressor or activator depending on its known activity. In the second scenario, we used the same set of ChIP-chip and motif data sets, but we relaxed the assumption that specific transcription factors can only act as activators or repressors. In the third scenario, we included ChIP-chip and motif data for all 203 TFs studied in Harbison et al. (2004), again allowing each TF to act either as a repressor or activator.
The three panels in Figure 3 summarize the results of the three different expansion scenarios for each TF separately as well as for the whole set together. This figure shows the fractions of potential target genes that could be reached after a certain number of steps in a regulatory cascade. In the first expansion scenario (Fig. 3A), 38% of the potential target genes across all the strains could be reached through transcriptional regulatory cascades with at most five steps (P < 0.001 compared with the same expansion approach applied to randomized target gene sets of the same size). The second expansion scenario (Fig. 3B) did not significantly increase the percentage of target genes that could be reached in at most five steps (44%, P < 0.001). In contrast, the third expansion scenario using the extended 203 TF data set (Fig. 3C) allowed reaching 67% of the target genes by cascades of five or fewer steps (P < 0.01). The third expansion scenario suggested several previously uncharacterized regulatory interactions between transcription factors that would allow explaining a large number of the unaccounted expression changes of metabolic genes that were observed in vivo. The novel regulatory interactions that were most commonly used in the regulatory cascades derived from the expansion approach are listed in Table 1.
Figure 3.

Results for the three regulatory network expansion scenarios (A,B,C) using a combination of the iMH805/775 network and a provisional regulatory network derived from ChIP-chip and TF-binding motif data. Each pie chart indicates the fractions of potential target genes that can be reached from the TF through regulatory cascades containing one to five steps as well as the targets that cannot be reached in five or less steps from the TF. For each strain, the numbers of potential novel targets are indicated in parenthesis. (A) Expansion using ChIP-chip and motif data for the 55 TFs in iMH805/775 assuming that each TF can only act as a repressor or activator depending on its known type of activity. (B) Expansion using the same ChIP-chip and motif data, but allowing each TF to act either as repressor or activator. (C) Expansion using ChIP-chip and motif data for all 203 TFs studied in Harbison et al. (2004) allowing each TF to act either as repressor or activator.
Table 1.
Regulatory interactions not included in iMH805/775 that participate in 15 or more regulatory cascades identified by the network expansion approach applied to the full ChIP-chip data set with 203 transcription factors
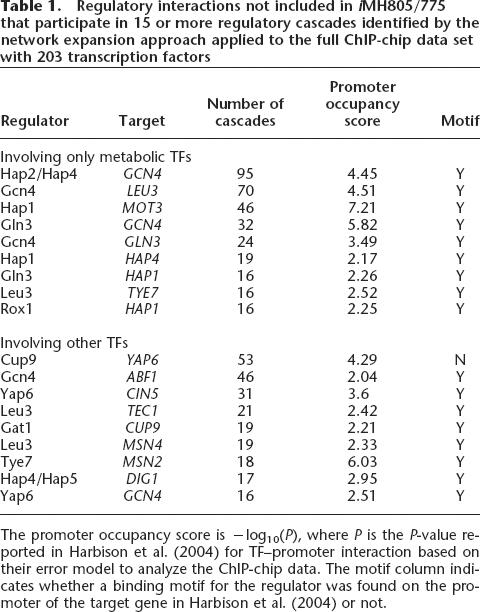
The promoter occupancy score is −log10(P), where P is the P-value reported in Harbison et al. (2004) for TF–promoter interaction based on their error model to analyze the ChIP-chip data. The motif column indicates whether a binding motif for the regulator was found on the promoter of the target gene in Harbison et al. (2004) or not.
The regulatory interactions that were identified by the first expansion scenario described above were used as a basis for building an improved version of the regulatory network. We analyzed manually each of the suggested regulatory interactions involving the 55 TFs in the original iMH805/775 model and included the interactions that did not cause conflicts with existing regulatory rules to form an expanded model, iMH805/837. In addition, minor changes to existing rules in the model were made to remove mispredictions of gene expression changes due to incorrectly represented combinatorial effects, especially for the rgt1 strain. In order to provide an independent test set to assess the relative performance of iMH805/775 and iMH805/837, we turned to prediction of gene expression changes in wild-type yeast strains in response to five different environmental perturbations (Gasch et al. 2000; Kwast et al. 2002). As Table 2 shows, overall the overlap between the observed and predicted expression changes for genes that change in expression either in silico or in vivo was significant in each of the five conditions (P < 0.01; Fisher’s exact test). The iMH805/837 model showed improved predictive ability over the iMH805/775 model in four out of the five conditions studied.
Table 2.
Comparison between gene expression changes predicted by either iMH805/775 or iMH805/837 and experimentally observed gene expression changes in response to environmental perturbations

The P-value reported is the probability of observing the number of correctly predicted expression changes by random chance given the total number of changes predicted and total number of changes observed based on Fisher’s exact test.
Prediction of growth phenotypes
In order to provide data for an evaluation of the predictive power of the integrated regulatory and metabolic network model iMH805/837, we performed quantitative growth phenotyping experiments on 12 different carbon sources with 10 TF deletion strains. All these TFs were included in the model and were known to be involved in carbon-source-dependent transcriptional regulation or otherwise play a role as key regulators in carbon source metabolism. The 12 carbon sources were chosen to represent both fermentable and nonfermentable carbon sources. We used an optimization-based approach (see Methods) to compare growth phenotype predictions to experimental data. This approach allowed us to systematically identify which of the growth phenotypes are unexpected considering the current understanding of the regulatory and metabolic networks in S. cerevisiae as represented by iMH805/837. The predicted growth rates are shown in Figure 4A together with the experimental growth rate data. For most carbon source/strain combinations, the model predictions are quantitatively in good agreement with the experimental data. However, we identified 13 cases where the growth rates were significantly overpredicted in silico.
Figure 4.

(A) Measured (upper corner) and predicted (lower corner) maximum specific growth rates (1/h) for transcription factor deletion strains on different carbon sources. The in silico predictions were made using the iMH805/837 model. The color scheme indicates the magnitude of the growth rate from low (dark) to high (light). The squares with numbers in bold/italics indicate strain-condition combinations with significant mispredictions discussed in the Supplemental material. (B) Comparison of experimentally measured and predicted growth rates after the improvements to the model discussed in the Supplemental material were done.
The 13 growth rate overpredictions were assumed to correspond to missing regulatory effects in the model, and hence we sought to identify potential novel regulatory mechanisms that would improve model predictions. We identified metabolic genes whose deletion in iMH805/837 would result in a reduced in silico growth rate prediction compared to the wild-type strain specifically on each carbon source. These genes were then considered to be direct or indirect candidate target genes for the transcription factors whose knockout growth phenotype on the carbon source was incorrectly predicted. Next we used gene expression data sets for TF deletion strains for which such data were available (cat8 and rgt1 strains) to further narrow down the set of potential targets by only including genes that were down-regulated in the TF KO strain in vivo. Specific new direct or indirect target genes that resulted in improved growth rate predictions were identified in five of the 13 cases using this approach. After including the suggested new regulatory effects in iMH805/837, only eight significant mispredictions remained as is shown in Figure 4B, and overall the model predicted TF KO strain growth rates more accurately than before.
Discussion
We presented a literature-based reconstruction of the known nutrient-controlled transcriptional regulatory network regulating metabolism in S. cerevisiae and the integration of this regulatory network with the genome-scale metabolic network model. We applied previously developed in silico methods for combined simulation of regulatory and metabolic network models to predict expression profiles and growth phenotypes. Comparison of these predictions with large-scale experimental data allowed identifying regulatory mechanisms missing from the model and expansion of the model by using existing ChIP-chip and promoter motif data. A similar approach for integrated modeling was first applied to genome-scale regulatory and metabolic networks in E. coli (Covert and Palsson 2002; Covert et al. 2004), but in yeast, the availability of ChIP-chip data allows integrating this key data type into the network expansion approach.
Similarly to the case of the initial E. coli regulatory network reconstruction (Covert et al. 2004), the overall agreement between in silico gene expression predictions by iMH805/775 and experimental data was found to be relatively low. In particular, a large number of the experimentally observed expression changes were not predicted by iMH805/775. However, the agreement between model predictions and the experimental data sets was significantly better in cases in which the gene expression and ChIP-chip data sets were in good agreement with each other (Fig. 2). Conversely, when the agreement between gene expression and ChIP-chip data was poor, as was the case for the Gln3 and Gat1 transcription factors, the model predictions were usually different from either data set. These results indicate that in particular regulatory subsystems, the expression response may be highly condition dependent, and information in the literature derived from experiments performed under diverse conditions may not allow building a coherent overall picture of the regulatory network. For example, the nitrogen regulation network in which Gln3 and Gat1 act as key regulators is known to consist of multiple interlinked negative feedback loops that allow selective response to different nitrogen sources (Cooper 2002; Magasanik and Kaiser 2002). Additional gene expression and ChIP-chip experiments with TF overexpression and conditional TF mutants performed under carefully controlled conditions would be needed to map the targets of transcription factors in such complex subnetworks.
Using ChIP-chip and motif data sets (Harbison et al. 2004) to systematically expand the iMH805/775 model allowed explaining one-third of the gene expression prediction discrepancies through hypothetical regulatory cascades involving the 55 TFs in the model (Fig. 3A). Interestingly, including ChIP-chip and motif data for additional TFs that are not traditionally assumed to be key regulators of metabolic processes almost doubled the number of gene expression discrepancies that could be explained through regulatory cascades derived from the data (Fig. 3C). Such cascades commonly involved TFs known to play a role in response to various cellular stresses such as Cin5, Msn2/4, and Yap6 (Table 1), indicating that many of the in vivo expression changes that were not predicted by the model may be stress induced. Verifying the suggested regulatory interactions between metabolic and stress response TFs listed in Table 1 through additional experimentation would allow expanding the model to include key stress response pathways and their connections to metabolic processes. In addition to stress response regulators, it is likely that multifunctional transcriptional regulators such as Rap1 or Abf1 (Lieb et al. 2001; Miyake et al. 2004) and chromatin-modifying enzymes (Narlikar et al. 2002) also play a role in response to changes in the nutritional environment of the cell. In the future, as more information is accumulated about the regulation of the activity of these pleiotropic regulators, we hope to be able to incorporate them into transcriptionally regulated metabolic models.
The set of new regulatory interactions suggested by the network expansion approach was used to develop an improved metabolic/regulatory network model, iMH805/837. The predictions of growth rates of TF deletion strains made by the iMH805/837 model were in good agreement with experimentally measured growth rates for most TF/carbon source combinations. The discrepancies in growth phenotype predictions were analyzed using a model-based approach that allowed the identification of potential new regulatory mechanisms mediating carbon source utilization that are discussed in detail in the Supplemental material. The changes to the model identified through this process were modifications of regulatory mechanisms for specific genes involved in utilization of particular carbon sources such as PGM2 (galactose) and HXT1 (mannose).
Conclusions
We have described the reconstruction of the nutrient-controlled transcriptional regulatory network regulating metabolism in S. cerevisiae and evaluation of the predictive power of an integrated metabolic/regulatory network. We compared model predictions to experimental gene expression data and identified a significant number of expression changes that were not predicted by the model. A combination of ChIP-chip and binding-site motif data was used to expand the regulatory network model so that its ability to predict expression changes was improved in independent test cases. This network expansion also suggested several novel connections between nutrient regulation of metabolism and other regulatory subsystems that require further validation through detailed experiments. It was found that the integrated metabolic/regulatory network model could be used to predict growth phenotypes, and the discrepancies in these predictions could be used to direct the search for novel regulatory mechanisms. The present work shows how a systematic approach can be used to fill in missing regulatory mechanisms through the combined use of an integrated model of regulation and metabolism and existing large-scale experimental data sets. In the future, the combination of more targeted expression profiling, ChIP-chip, growth phenotyping, and metabolic flux profiling (Blank et al. 2005) under many different environmental conditions will allow systematic iterative model building. With increasing knowledge of specific regulatory mechanisms in higher eukaryotes (Picard et al. 2004; Wolfrum et al. 2004), the approaches used in this work can be readily extended to studying the network-level interplay between regulation and metabolism in these organisms.
Methods
Model reconstruction
The relevant literature for each metabolic (Duarte et al. 2004) and transcription factor gene was collected through information in the SGD, YPD, and MIPS databases (Costanzo et al. 2001; Christie et al. 2004; Mewes et al. 2004) and direct PubMed searches. The regulatory network model part of iMH805/775 consists of three layers describing the effect of extracellular and intracellular signals on the expression of metabolic genes and the maximum allowed flux through particular reactions in the network. The first layer describes the activities of 55 TFs in response to 67 extracellular and 15 intracellular metabolite concentrations. The second layer consists of the rules describing the expression of 348 metabolic genes as a function of the transcription factor states and metabolite concentrations in cases in which the direct regulatory mechanisms were unknown. For the remaining metabolic genes, no information on regulation could be found in the literature, and they were assumed to be constitutively expressed in all environmental conditions. The third layer contains the gene–protein–reaction associations that encode the relationship between gene expression and presence/absence of a particular reaction in the network (Duarte et al. 2004). All the three layers were implemented as Boolean rules derived from primary literature, and these rules are listed in the Supplemental material.
Regulated flux balance analysis
The constraint-based modeling approach for genome-scale metabolic networks has been extensively reviewed elsewhere (Price et al. 2004) and will not be described in full detail here. The metabolic network model consists of the stoichiometric matrix describing all the interconversions between metabolites in the network, maximum flux capacity constraints on all reactions, and a cellular objective function to be maximized (based on the estimated biomass composition). The integration of the metabolic network analysis and the transcriptional regulatory network model described above is accomplished using the regulated flux balance analysis approach (Covert et al. 2001). In this approach, the three layers of rules detailed above are evaluated given an initial condition (extracellular concentrations and intracellular fluxes), and the state of each reaction in the metabolic model is calculated. The maximum fluxes through the reactions that are determined to be down-regulated are then set to a predetermined fraction of the unregulated maximum flux. Given the stoichiometric matrix, an objective function, and the new maximum flux capacities, a particular flux distribution can be calculated using linear optimization. The resulting flux distribution is then, in turn, used to calculate the changes in external concentrations, and these concentrations as well as the internal fluxes are used to evaluate the rules at the next time step to obtain the gene expression state (see Supplemental material for details).
Model parameter estimation
There are several parameters such as maximum substrate and oxygen uptake rates that affect growth rate predictions by the metabolic/regulatory network mode. For the growth phenotyping study, these parameters were not experimentally measured so that they had to be estimated computationally. The particular estimation strategy used in this work is based on genetic algorithms that allow optimization of a nonlinear objective function with nonlinear constraints (Goldberg 1989). In our application, the objective was to minimize the summed absolute discrepancies between predicted and experimentally measured growth rates weighted by the experimental standard deviations of the growth rates under the 12 growth conditions for the 11 strains. The Supplemental material contains details of the parameter estimation approach and sensitivity analysis of the growth rate predictions.
Gene expression data comparisons
The individual gene expression data sets for the transcription factor knockout or overexpression strains and wild-type condition shifts were obtained directly from the Supplemental Web sites for individual papers (Gasch et al. 2000; Ideker et al. 2001; Natarajan et al. 2001; Kwast et al. 2002; Lin et al. 2002; Ter Linde and Steensma 2002; Young et al. 2003; Kaniak et al. 2004). All the data sets were first converted into log ratios between gene expression levels in the knockout or overexpression strain and in the wild-type strain or between two conditions. The criteria that were used to find significantly up/down-regulated genes in each gene expression data set, and the conditions used for the in silico simulations of the TF knockout effects on gene expression are listed in the Supplemental material.
Network expansion
The network expansion approach used in this work is purely graph-based, that is, the regulatory network was represented as a directed graph with labeled edges indicating either repression or activation of a target gene by a TF or a regulatory signal. The provisional network derived from ChIP-chip and motif data (Harbison et al. 2004) as described in the Supplemental material was combined with the regulatory network in iMH805/775, and each of the edges was labeled as either repressing or activating depending on the known primary function of the TF involved in the interaction. Next, a breadth first search was used to find all directed noncyclic paths up to a certain number of steps in the combined network that connect a transcription factor to a particular potential target gene. In the first expansion scenario discussed in the Results section, only paths that would result in the correct sign for the expression change of the target gene in the TF KO or overexpression strain were considered further. In the other two expansion scenarios, this path coherence criterion was not used. In order to establish the final expanded model, the interactions in the shortest coherent path for each TF–target pair were included in a provisional regulatory network model. The suggested new interactions were then integrated with existing rules by manual inspection. The predictions of expression changes in all modified strains were then re-run with the new model, and interactions that reduced the overall predictive power of the model were removed from the model. All the computations presented in this paper were done using Matlab 6.5 (Mathworks Inc.), and the FBA problems were solved using the Lindo linear programming solver (Lindo Systems Inc.).
Experimental protocols
The wild-type S. cerevisiae haploid strain used in this study, BY4741 (MATa his3Δ1 leu2Δ0 met15Δ0 ura3Δ0), was obtained from ATCC. All the single transcription factor knockout strains were from the S. cerevisiae gene deletion collection (Winzeler et al. 1999) and were generously provided by T. Ideker. Growth on different carbon sources was evaluated by using the Bioscreen C system (Thermo Labsystems). Minimal medium (Van Hoek et al. 1998) with the appropriate auxotrophic supplements added was used to test growth on 12 different carbon sources (glucose, galactose, fructose, sucrose, mannose, ribose, lactate, pyruvate, ethanol, raffinose, glycerol) for each of the knockout strains as well as the wild-type strain. Maximum specific growth rates were determined for each strain–carbon source combination based on five independent measurements as described in the Supplemental material.
Acknowledgments
We thank Trey Ideker, Bing Ren, Shankar Subramaniam, George Santangelo, and Timothy Hughes for valuable discussions. We also thank Iman Famili, Natalie Duarte, and Monica Mo for help with the yeast metabolic model and Thuy Vo for critical comments on the manuscript. Support for this work was provided by the National Institutes of Health (RO1 GM071808) and National Science Foundation (BES-0331342).
Footnotes
[Supplemental material is available online at www.genome.org.]
Article published online before print. Article and publication date are at http://www.genome.org/cgi/doi/10.1101/gr.4083206
See Reed et al. (2003) for conventions used for naming in silico strains. MH refers to the principal person responsible for reconstructing the model, 805 is the number of genes accounted for by the model, and 775 is the number of regulatory interactions in the model.
References
- Blank L.M., Kuepfer L., Sauer U., Kuepfer L., Sauer U., Sauer U. Large-scale 13C-flux analysis reveals mechanistic principles of metabolic network robustness to null mutations in yeast. Genome Biol. 2005;6:R49. doi: 10.1186/gb-2005-6-6-r49. [DOI] [PMC free article] [PubMed] [Google Scholar]
- Bussey H., Storms R.K., Ahmed A., Albermann K., Allen E., Ansorge W., Araujo R., Aparicio A., Barrell B., Badcock K., Storms R.K., Ahmed A., Albermann K., Allen E., Ansorge W., Araujo R., Aparicio A., Barrell B., Badcock K., Ahmed A., Albermann K., Allen E., Ansorge W., Araujo R., Aparicio A., Barrell B., Badcock K., Albermann K., Allen E., Ansorge W., Araujo R., Aparicio A., Barrell B., Badcock K., Allen E., Ansorge W., Araujo R., Aparicio A., Barrell B., Badcock K., Ansorge W., Araujo R., Aparicio A., Barrell B., Badcock K., Araujo R., Aparicio A., Barrell B., Badcock K., Aparicio A., Barrell B., Badcock K., Barrell B., Badcock K., Badcock K., et al. The nucleotide sequence of Saccharomyces cerevisiae chromosome XVI. Nature. 1997;387:103–105. [PubMed] [Google Scholar]
- Christie K.R., Weng S., Balakrishnan R., Costanzo M.C., Dolinski K., Dwight S.S., Engel S.R., Feierbach B., Fisk D.G., Hirschman J.E., Weng S., Balakrishnan R., Costanzo M.C., Dolinski K., Dwight S.S., Engel S.R., Feierbach B., Fisk D.G., Hirschman J.E., Balakrishnan R., Costanzo M.C., Dolinski K., Dwight S.S., Engel S.R., Feierbach B., Fisk D.G., Hirschman J.E., Costanzo M.C., Dolinski K., Dwight S.S., Engel S.R., Feierbach B., Fisk D.G., Hirschman J.E., Dolinski K., Dwight S.S., Engel S.R., Feierbach B., Fisk D.G., Hirschman J.E., Dwight S.S., Engel S.R., Feierbach B., Fisk D.G., Hirschman J.E., Engel S.R., Feierbach B., Fisk D.G., Hirschman J.E., Feierbach B., Fisk D.G., Hirschman J.E., Fisk D.G., Hirschman J.E., Hirschman J.E., et al. Saccharomyces Genome Database (SGD) provides tools to identify and analyze sequences from Saccharomyces cerevisiae and related sequences from other organisms. Nucleic Acids Res. 2004;32:D311–D314. doi: 10.1093/nar/gkh033. [DOI] [PMC free article] [PubMed] [Google Scholar]
- Cooper T.G. Transmitting the signal of excess nitrogen in Saccharomyces cerevisiae from the Tor proteins to the GATA factors: Connecting the dots. FEMS Microbiol. Rev. 2002;26:223–238. doi: 10.1111/j.1574-6976.2002.tb00612.x. [DOI] [PMC free article] [PubMed] [Google Scholar]
- Costanzo M.C., Crawford M.E., Hirschman J.E., Kranz J.E., Olsen P., Robertson L.S., Skrzypek M.S., Braun B.R., Hopkins K.L., Kondu P., Crawford M.E., Hirschman J.E., Kranz J.E., Olsen P., Robertson L.S., Skrzypek M.S., Braun B.R., Hopkins K.L., Kondu P., Hirschman J.E., Kranz J.E., Olsen P., Robertson L.S., Skrzypek M.S., Braun B.R., Hopkins K.L., Kondu P., Kranz J.E., Olsen P., Robertson L.S., Skrzypek M.S., Braun B.R., Hopkins K.L., Kondu P., Olsen P., Robertson L.S., Skrzypek M.S., Braun B.R., Hopkins K.L., Kondu P., Robertson L.S., Skrzypek M.S., Braun B.R., Hopkins K.L., Kondu P., Skrzypek M.S., Braun B.R., Hopkins K.L., Kondu P., Braun B.R., Hopkins K.L., Kondu P., Hopkins K.L., Kondu P., Kondu P., et al. YPD, PombePD and WormPD: Model organism volumes of the BioKnowledge library, an integrated resource for protein information. Nucleic Acids Res. 2001;29:75–79. doi: 10.1093/nar/29.1.75. [DOI] [PMC free article] [PubMed] [Google Scholar]
- Covert M.W., Palsson B.Ø., Palsson B.Ø. Transcriptional regulation in constraints-based metabolic models of Escherichia coli. J. Biol. Chem. 2002;277:28058–28064. doi: 10.1074/jbc.M201691200. [DOI] [PubMed] [Google Scholar]
- Covert M.W., Schilling C.H., Palsson B.Ø., Schilling C.H., Palsson B.Ø., Palsson B.Ø. Regulation of gene expression in flux balance models of metabolism. J. Theor. Biol. 2001;213:73–88. doi: 10.1006/jtbi.2001.2405. [DOI] [PubMed] [Google Scholar]
- Covert M.W., Knight E.M., Reed J.L., Herrgård M.J., Palsson B.Ø., Knight E.M., Reed J.L., Herrgård M.J., Palsson B.Ø., Reed J.L., Herrgård M.J., Palsson B.Ø., Herrgård M.J., Palsson B.Ø., Palsson B.Ø. Integrating high-throughput and computational data elucidates bacterial networks. Nature. 2004;429:92–96. doi: 10.1038/nature02456. [DOI] [PubMed] [Google Scholar]
- DeRisi J.L., Iyer V.R., Brown P.O., Iyer V.R., Brown P.O., Brown P.O. Exploring the metabolic and genetic control of gene expression on a genomic scale. Science. 1997;278:680–686. doi: 10.1126/science.278.5338.680. [DOI] [PubMed] [Google Scholar]
- Duarte N.C., Herrgård M.J., Palsson B.Ø., Herrgård M.J., Palsson B.Ø., Palsson B.Ø. Reconstruction and validation of Saccharomyces cerevisiae iND750, a fully compartmentalized genome-scale metabolic model. Genome Res. 2004;14:1298–1309. doi: 10.1101/gr.2250904. [DOI] [PMC free article] [PubMed] [Google Scholar]
- Famili I., Forster J., Nielsen J., Palsson B.Ø., Forster J., Nielsen J., Palsson B.Ø., Nielsen J., Palsson B.Ø., Palsson B.Ø. Saccharomyces cerevisiae phenotypes can be predicted by using constraint-based analysis of a genome-scale reconstructed metabolic network. Proc. Natl. Acad. Sci. 2003;100:13134–13139. doi: 10.1073/pnas.2235812100. [DOI] [PMC free article] [PubMed] [Google Scholar]
- Gasch A.P., Spellman P.T., Kao C.M., Carmel-Harel O., Eisen M.B., Storz G., Botstein D., Brown P.O., Spellman P.T., Kao C.M., Carmel-Harel O., Eisen M.B., Storz G., Botstein D., Brown P.O., Kao C.M., Carmel-Harel O., Eisen M.B., Storz G., Botstein D., Brown P.O., Carmel-Harel O., Eisen M.B., Storz G., Botstein D., Brown P.O., Eisen M.B., Storz G., Botstein D., Brown P.O., Storz G., Botstein D., Brown P.O., Botstein D., Brown P.O., Brown P.O. Genomic expression programs in the response of yeast cells to environmental changes. Mol. Biol. Cell. 2000;11:4241–4257. doi: 10.1091/mbc.11.12.4241. [DOI] [PMC free article] [PubMed] [Google Scholar]
- Gavin A.C., Aloy P., Grandi P., Krause R., Boesche M., Marzioch M., Rau C., Jensen L.J., Bastuck S., Dumpelfeld B., Aloy P., Grandi P., Krause R., Boesche M., Marzioch M., Rau C., Jensen L.J., Bastuck S., Dumpelfeld B., Grandi P., Krause R., Boesche M., Marzioch M., Rau C., Jensen L.J., Bastuck S., Dumpelfeld B., Krause R., Boesche M., Marzioch M., Rau C., Jensen L.J., Bastuck S., Dumpelfeld B., Boesche M., Marzioch M., Rau C., Jensen L.J., Bastuck S., Dumpelfeld B., Marzioch M., Rau C., Jensen L.J., Bastuck S., Dumpelfeld B., Rau C., Jensen L.J., Bastuck S., Dumpelfeld B., Jensen L.J., Bastuck S., Dumpelfeld B., Bastuck S., Dumpelfeld B., Dumpelfeld B., et al. 2006Proteome survey reveals modularity of the yeast cell machinery. Nature (in press). [DOI] [PubMed] [Google Scholar]
- Giaever G., Chu A.M., Ni L., Connelly C., Riles L., Veronneau S., Dow S., Lucau-Danila A., Anderson K., Andre B., Chu A.M., Ni L., Connelly C., Riles L., Veronneau S., Dow S., Lucau-Danila A., Anderson K., Andre B., Ni L., Connelly C., Riles L., Veronneau S., Dow S., Lucau-Danila A., Anderson K., Andre B., Connelly C., Riles L., Veronneau S., Dow S., Lucau-Danila A., Anderson K., Andre B., Riles L., Veronneau S., Dow S., Lucau-Danila A., Anderson K., Andre B., Veronneau S., Dow S., Lucau-Danila A., Anderson K., Andre B., Dow S., Lucau-Danila A., Anderson K., Andre B., Lucau-Danila A., Anderson K., Andre B., Anderson K., Andre B., Andre B., et al. Functional profiling of the Saccharomyces cerevisiae genome. Nature. 2002;418:387–391. doi: 10.1038/nature00935. [DOI] [PubMed] [Google Scholar]
- Goldberg D.E. Genetic algorithms in search, optimization, and machine learning. Addison-Wesley; Reading, MA.: 1989. [Google Scholar]
- Grunenfelder B., Winzeler E.A., Winzeler E.A. Treasures and traps in genome-wide data sets: Case examples from yeast. Nat. Rev. Genet. 2002;3:653–661. doi: 10.1038/nrg886. [DOI] [PubMed] [Google Scholar]
- Harbison C.T., Gordon D.B., Lee T.I., Rinaldi N.J., Macisaac K.D., Danford T.W., Hannett N.M., Tagne J.B., Reynolds D.B., Yoo J., Gordon D.B., Lee T.I., Rinaldi N.J., Macisaac K.D., Danford T.W., Hannett N.M., Tagne J.B., Reynolds D.B., Yoo J., Lee T.I., Rinaldi N.J., Macisaac K.D., Danford T.W., Hannett N.M., Tagne J.B., Reynolds D.B., Yoo J., Rinaldi N.J., Macisaac K.D., Danford T.W., Hannett N.M., Tagne J.B., Reynolds D.B., Yoo J., Macisaac K.D., Danford T.W., Hannett N.M., Tagne J.B., Reynolds D.B., Yoo J., Danford T.W., Hannett N.M., Tagne J.B., Reynolds D.B., Yoo J., Hannett N.M., Tagne J.B., Reynolds D.B., Yoo J., Tagne J.B., Reynolds D.B., Yoo J., Reynolds D.B., Yoo J., Yoo J., et al. Transcriptional regulatory code of a eukaryotic genome. Nature. 2004;431:99–104. doi: 10.1038/nature02800. [DOI] [PMC free article] [PubMed] [Google Scholar]
- Herrgård M.J., Covert M.W., Palsson B.Ø., Covert M.W., Palsson B.Ø., Palsson B.Ø. Reconstruction of microbial transcriptional regulatory networks. Curr. Opin. Biotechnol. 2004;15:70–77. doi: 10.1016/j.copbio.2003.11.002. [DOI] [PubMed] [Google Scholar]
- Ideker T., Thorsson V., Ranish J.A., Christmas R., Buhler J., Eng J.K., Bumgarner R., Goodlett D.R., Aebersold R., Hood L., Thorsson V., Ranish J.A., Christmas R., Buhler J., Eng J.K., Bumgarner R., Goodlett D.R., Aebersold R., Hood L., Ranish J.A., Christmas R., Buhler J., Eng J.K., Bumgarner R., Goodlett D.R., Aebersold R., Hood L., Christmas R., Buhler J., Eng J.K., Bumgarner R., Goodlett D.R., Aebersold R., Hood L., Buhler J., Eng J.K., Bumgarner R., Goodlett D.R., Aebersold R., Hood L., Eng J.K., Bumgarner R., Goodlett D.R., Aebersold R., Hood L., Bumgarner R., Goodlett D.R., Aebersold R., Hood L., Goodlett D.R., Aebersold R., Hood L., Aebersold R., Hood L., Hood L. Integrated genomic and proteomic analyses of a systematically perturbed metabolic network. Science. 2001;292:929–934. doi: 10.1126/science.292.5518.929. [DOI] [PubMed] [Google Scholar]
- Kaniak A., Xue Z., Macool D., Kim J.H., Johnston M., Xue Z., Macool D., Kim J.H., Johnston M., Macool D., Kim J.H., Johnston M., Kim J.H., Johnston M., Johnston M. Regulatory network connecting two glucose signal transduction pathways in Saccharomyces cerevisiae. Eukaryot. Cell. 2004;3:221–231. doi: 10.1128/EC.3.1.221-231.2004. [DOI] [PMC free article] [PubMed] [Google Scholar]
- Kauffman K.J., Prakash P., Edwards J.S., Prakash P., Edwards J.S., Edwards J.S. Advances in flux balance analysis. Curr. Opin. Biotechnol. 2003;14:491–496. doi: 10.1016/j.copbio.2003.08.001. [DOI] [PubMed] [Google Scholar]
- Kwast K.E., Lai L.C., Menda N., James III D.T., Aref S., Burke P.V., Lai L.C., Menda N., James III D.T., Aref S., Burke P.V., Menda N., James III D.T., Aref S., Burke P.V., James III D.T., Aref S., Burke P.V., Aref S., Burke P.V., Burke P.V. Genomic analyses of anaerobically induced genes in Saccharomyces cerevisiae: Functional roles of Rox1 and other factors in mediating the anoxic response. J. Bacteriol. 2002;184:250–265. doi: 10.1128/JB.184.1.250-265.2002. [DOI] [PMC free article] [PubMed] [Google Scholar]
- Lascaris R., Bussemaker H.J., Boorsma A., Piper M., van der Spek H., Grivell L., Blom J., Bussemaker H.J., Boorsma A., Piper M., van der Spek H., Grivell L., Blom J., Boorsma A., Piper M., van der Spek H., Grivell L., Blom J., Piper M., van der Spek H., Grivell L., Blom J., van der Spek H., Grivell L., Blom J., Grivell L., Blom J., Blom J. Hap4p overexpression in glucose-grown Saccharomyces cerevisiae induces cells to enter a novel metabolic state. Genome Biol. 2003;4:R3. doi: 10.1186/gb-2002-4-1-r3. [DOI] [PMC free article] [PubMed] [Google Scholar]
- Lieb J.D., Liu X., Botstein D., Brown P.O., Liu X., Botstein D., Brown P.O., Botstein D., Brown P.O., Brown P.O. Promoter-specific binding of Rap1 revealed by genome-wide maps of protein–DNA association. Nat. Genet. 2001;28:327–334. doi: 10.1038/ng569. [DOI] [PubMed] [Google Scholar]
- Lin S.J., Kaeberlein M., Andalis A.A., Sturtz L.A., Defossez P.A., Culotta V.C., Fink G.R., Guarente L., Kaeberlein M., Andalis A.A., Sturtz L.A., Defossez P.A., Culotta V.C., Fink G.R., Guarente L., Andalis A.A., Sturtz L.A., Defossez P.A., Culotta V.C., Fink G.R., Guarente L., Sturtz L.A., Defossez P.A., Culotta V.C., Fink G.R., Guarente L., Defossez P.A., Culotta V.C., Fink G.R., Guarente L., Culotta V.C., Fink G.R., Guarente L., Fink G.R., Guarente L., Guarente L. Calorie restriction extends Saccharomyces cerevisiae lifespan by increasing respiration. Nature. 2002;418:344–348. doi: 10.1038/nature00829. [DOI] [PubMed] [Google Scholar]
- Magasanik B., Kaiser C.A., Kaiser C.A. Nitrogen regulation in Saccharomyces cerevisiae. Gene. 2002;290:1–18. doi: 10.1016/s0378-1119(02)00558-9. [DOI] [PubMed] [Google Scholar]
- Mewes H.W., Amid C., Arnold R., Frishman D., Guldener U., Mannhaupt G., Munsterkotter M., Pagel P., Strack N., Stumpflen V., Amid C., Arnold R., Frishman D., Guldener U., Mannhaupt G., Munsterkotter M., Pagel P., Strack N., Stumpflen V., Arnold R., Frishman D., Guldener U., Mannhaupt G., Munsterkotter M., Pagel P., Strack N., Stumpflen V., Frishman D., Guldener U., Mannhaupt G., Munsterkotter M., Pagel P., Strack N., Stumpflen V., Guldener U., Mannhaupt G., Munsterkotter M., Pagel P., Strack N., Stumpflen V., Mannhaupt G., Munsterkotter M., Pagel P., Strack N., Stumpflen V., Munsterkotter M., Pagel P., Strack N., Stumpflen V., Pagel P., Strack N., Stumpflen V., Strack N., Stumpflen V., Stumpflen V., et al. MIPS: Analysis and annotation of proteins from whole genomes. Nucleic Acids Res. 2004;32:D41–D44. doi: 10.1093/nar/gkh092. [DOI] [PMC free article] [PubMed] [Google Scholar]
- Miyake T., Reese J., Loch C.M., Auble D.T., Li R., Reese J., Loch C.M., Auble D.T., Li R., Loch C.M., Auble D.T., Li R., Auble D.T., Li R., Li R. Genome-wide analysis of ARS (autonomously replicating sequence) binding factor 1 (Abf1p)-mediated transcriptional regulation in. Saccharomyces cerevisiae. J. Biol. Chem. 2004;279:34865–34872. doi: 10.1074/jbc.M405156200. [DOI] [PubMed] [Google Scholar]
- Narlikar G.J., Fan H.Y., Kingston R.E., Fan H.Y., Kingston R.E., Kingston R.E. Cooperation between complexes that regulate chromatin structure and transcription. Cell. 2002;108:475–487. doi: 10.1016/s0092-8674(02)00654-2. [DOI] [PubMed] [Google Scholar]
- Natarajan K., Meyer M.R., Jackson B.M., Slade D., Roberts C., Hinnebusch A.G., Marton M.J., Meyer M.R., Jackson B.M., Slade D., Roberts C., Hinnebusch A.G., Marton M.J., Jackson B.M., Slade D., Roberts C., Hinnebusch A.G., Marton M.J., Slade D., Roberts C., Hinnebusch A.G., Marton M.J., Roberts C., Hinnebusch A.G., Marton M.J., Hinnebusch A.G., Marton M.J., Marton M.J. Transcriptional profiling shows that Gcn4p is a master regulator of gene expression during amino acid starvation in yeast. Mol. Cell. Biol. 2001;21:4347–4368. doi: 10.1128/MCB.21.13.4347-4368.2001. [DOI] [PMC free article] [PubMed] [Google Scholar]
- Picard F., Kurtev M., Chung N., Topark-Ngarm A., Senawong T., De Machado Oliveira R., Leid M., McBurney M.W., Guarente L., Kurtev M., Chung N., Topark-Ngarm A., Senawong T., De Machado Oliveira R., Leid M., McBurney M.W., Guarente L., Chung N., Topark-Ngarm A., Senawong T., De Machado Oliveira R., Leid M., McBurney M.W., Guarente L., Topark-Ngarm A., Senawong T., De Machado Oliveira R., Leid M., McBurney M.W., Guarente L., Senawong T., De Machado Oliveira R., Leid M., McBurney M.W., Guarente L., De Machado Oliveira R., Leid M., McBurney M.W., Guarente L., Leid M., McBurney M.W., Guarente L., McBurney M.W., Guarente L., Guarente L. Sirt1 promotes fat mobilization in white adipocytes by repressing PPAR-γ. Nature. 2004;429:771–776. doi: 10.1038/nature02583. [DOI] [PMC free article] [PubMed] [Google Scholar]
- Price N.D., Reed J.L., Palsson B.Ø., Reed J.L., Palsson B.Ø., Palsson B.Ø. Genome-scale models of microbial cells: Evaluating the consequences of constraints. Nat. Rev. Microbiol. 2004;2:886–897. doi: 10.1038/nrmicro1023. [DOI] [PubMed] [Google Scholar]
- Reed J.L., Vo T.D., Schilling C.H., Palsson B.Ø., Vo T.D., Schilling C.H., Palsson B.Ø., Schilling C.H., Palsson B.Ø., Palsson B.Ø.2003An expanded genome-scale model of Escherichia coli K-12 (iJR904 GSM/GPR). Genome Biol. 4R54 1–R54.12. [DOI] [PMC free article] [PubMed] [Google Scholar]
- Sauer U. High-throughput phenomics: Experimental methods for mapping fluxomes. Curr. Opin. Biotechnol. 2004;15:58–63. doi: 10.1016/j.copbio.2003.11.001. [DOI] [PubMed] [Google Scholar]
- Ter Linde J.J., Steensma H.Y., Steensma H.Y. A microarray-assisted screen for potential Hap1 and Rox1 target genes in. Saccharomyces cerevisiae. Yeast. 2002;19:825–840. doi: 10.1002/yea.879. [DOI] [PubMed] [Google Scholar]
- Van Hoek P., Van Dijken J.P., Pronk J.T., Van Dijken J.P., Pronk J.T., Pronk J.T. Effect of specific growth rate on fermentative capacity of baker’s yeast. Appl. Environ. Microbiol. 1998;64:4226–4233. doi: 10.1128/aem.64.11.4226-4233.1998. [DOI] [PMC free article] [PubMed] [Google Scholar]
- Villas-Boas S.G., Moxley J.F., Akesson M., Stephanopoulos G., Nielsen J., Moxley J.F., Akesson M., Stephanopoulos G., Nielsen J., Akesson M., Stephanopoulos G., Nielsen J., Stephanopoulos G., Nielsen J., Nielsen J. High-throughput metabolic state analysis: The missing link in integrated functional genomics of yeasts. Biochem. J. 2005;388:669–677. doi: 10.1042/BJ20041162. [DOI] [PMC free article] [PubMed] [Google Scholar]
- Winzeler E.A., Shoemaker D.D., Astromoff A., Liang H., Anderson K., Andre B., Bangham R., Benito R., Boeke J.D., Bussey H., Shoemaker D.D., Astromoff A., Liang H., Anderson K., Andre B., Bangham R., Benito R., Boeke J.D., Bussey H., Astromoff A., Liang H., Anderson K., Andre B., Bangham R., Benito R., Boeke J.D., Bussey H., Liang H., Anderson K., Andre B., Bangham R., Benito R., Boeke J.D., Bussey H., Anderson K., Andre B., Bangham R., Benito R., Boeke J.D., Bussey H., Andre B., Bangham R., Benito R., Boeke J.D., Bussey H., Bangham R., Benito R., Boeke J.D., Bussey H., Benito R., Boeke J.D., Bussey H., Boeke J.D., Bussey H., Bussey H., et al. Functional characterization of the S. cerevisiae genome by gene deletion and parallel analysis. Science. 1999;285:901–906. doi: 10.1126/science.285.5429.901. [DOI] [PubMed] [Google Scholar]
- Wolfrum C., Asilmaz E., Luca E., Friedman J.M., Stoffel M., Asilmaz E., Luca E., Friedman J.M., Stoffel M., Luca E., Friedman J.M., Stoffel M., Friedman J.M., Stoffel M., Stoffel M. Foxa2 regulates lipid metabolism and ketogenesis in the liver during fasting and in diabetes. Nature. 2004;432:1027–1032. doi: 10.1038/nature03047. [DOI] [PubMed] [Google Scholar]
- Young E.T., Dombek K.M., Tachibana C., Ideker T., Dombek K.M., Tachibana C., Ideker T., Tachibana C., Ideker T., Ideker T. Multiple pathways are co-regulated by the protein kinase Snf1 and the transcription factors Adr1 and Cat8. J. Biol. Chem. 2003;278:26146–26158. doi: 10.1074/jbc.M301981200. [DOI] [PubMed] [Google Scholar]