

Abstract
Background
Cesarean section rates have been increasing worldwide, but little research exists on trends of cesarean section delivery for any country in the Arab world. The purpose of this study was to document recent levels and trends of cesarean section rates in Egypt, and to estimate trends in cesarean section by type of hospital from three population-based national surveys.
Methods
This descriptive study used merged data files from three nationally representative samples of ever-married women aged 15 to 49 years.
Results
A significant rise in cesarean deliveries occurred for all births, from a low of 4.6 percent in 1992 to 10.3 percent in 2000. However, hospital-based cesarean deliveries were much higher in 1987–1988 (13.9%), increasing to 22.0 percent in 1999–2000. Although the cesarean section rate was slightly higher in private hospitals, the rate also increased consistently in public hospitals.
Conclusions
The high and unprecedented increase in cesarean section rates reported in this study may be partly due to cesarean sections that are not medically indicated, and suggest that physician practice patterns, financial incentives or other profitability factors, and patient preferences should be explored.
Cesarean section rates have been increasing worldwide, and are a growing concern in many countries. Once limited to western countries, particularly the United States and United Kingdom, high rates of cesarean deliveries are now an international phenomenon, reflecting, in part, increased hospital-based delivery and access to healthcare (1). The rise of cesarean births has been the subject of continuing debate (2). Although often a necessary or desirable procedure, cesarean delivery may also be medically unnecessary (3). Country-specific standards of practice, convenience of delivery, fear of being sued, and profitability may influence medical decision-making, leading to greater intervention in delivery (2,3). Recent reports show that population-based cesarean section rates exceeding the World Health Organization “threshold” of 15 percent are more common in private fee-for-service hospitals than in public hospitals (2,4). Specifically, studies in Asia and South America document widening gaps between the private and public hospital cesarean section rates, amounting in some instances to differences of more than 50 percent (5–7).
In Egypt about 50 percent of births are delivered at home with no trained medical personnel, largely because of lack of access to hospitals or appropriate modern medical services in rural areas (or rural-like areas of migrants). Home births, although still prevalent, are decreasing, as shown in Table 1. In general, the decision to deliver at home might change either because of protracted attempts at home birth or because of unexpected complications during delivery that may endanger the lives of mother and newborn. The vast majority of home births occur at home by default (no choice). According to the most recent (2000) population-based estimate from the Egypt Demographic Health Survey (8), about 70 percent of home births in Egypt were assisted by traditional birth attendants. Table 1 provides some comparative data for place of birth across time periods.
Table 1.
Sample Characteristics of Births to Women Reporting One or More Births in the 5 Years Preceding the Survey: Egypt, 1992, 1995, 2000
|
EDHS 1992
|
EDHS 1995
|
EDHS 2000
|
||||
|---|---|---|---|---|---|---|
| Characteristics | No. of Births | (%) | No. of Births | (%) | No. of Births | (%) |
| Mothers | ||||||
| Age (yr) | ||||||
| 15–19 | 285 | (3.3) | 413 | (3.6) | 361 | (3.2) |
| 20–24 | 1,767 | (20.3) | 2,584 | (22.6) | 2,642 | (23.3) |
| 25–29 | 2,802 | (32.2) | 3,600 | (31.4) | 3,618 | (31.8) |
| 30–34 | 1,936 | (22.3) | 2,483 | (21.7) | 2,544 | (22.4) |
| 35–39 | 1,219 | (14.0) | 1,559 | (13.6) | 1,529 | (13.5) |
| 40+ | 689 | (7.9) | 815 | (7.1) | 667 | (5.9) |
| Educational level | ||||||
| No education | 4,470 | (51.4) | 5,266 | (46.0) | 4,559 | (40.1) |
| Primary | 2,018 | (23.2) | 2,417 | (21.1) | 1,763 | (15.5) |
| Secondary | 1,825 | (21.0) | 3,158 | (27.6) | 4,109 | (36.2) |
| Higher | 383 | (4.4) | 613 | (5.4) | 929 | (8.2) |
| Region of residence | ||||||
| Urban Governorates | 1,564 | (18.0) | 1,990 | (17.4) | 1,813 | (16.0) |
| Lower Egypt—Urban | 825 | (9.5) | 1,057 | (9.2) | 1,230 | (10.8) |
| Lower Egypt—Rural | 2,612 | (30.0) | 3,321 | (29.0) | 3,448 | (30.4) |
| Upper Egypt—Urban | 866 | (10.0) | 1,269 | (11.1) | 1,227 | (10.8) |
| Upper Egypt—Rural | 2,829 | (32.5) | 3,705 | (32.3) | 3,463 | (30.5) |
| Frontier Governorates | – | – | 113 | (1.0) | 179 | (1.6) |
| Age at first marriage (mean) | – | (18.4) | – | (18.5) | – | (19.0) |
| Total children ever born (mean) | – | (4.1) | – | (3.8) | – | (3.5) |
| Births | ||||||
| Long labor | – | – | 2285 | (19.9) | 1273 | (11.2) |
| Excessive bleeding | – | – | 435 | (3.8) | 283 | (2.5) |
| Bad smelling vaginal discharge | – | – | 246 | (2.1) | 130 | (1.1) |
| Convulsions not caused by fever | – | – | 72 | (0.6) | 39 | (0.3) |
| Size of child at birth | ||||||
| Larger than average | 585 | (6.7) | 716 | (6.3) | 649 | (5.8) |
| Smaller than average | 1,322 | (15.2) | 2,270 | (19.8) | 1,644 | (14.5) |
| Home birth | 6,333 | (72.8) | 7,678 | (67.2) | 5,875 | (51.8) |
| Assisted by traditional birth attendant | 4,601 | (72.7) | 5,551 | (72.3) | 4,029 | (68.6) |
| Received no antenatal care | 4,088 | (47.0) | 6,947 | (60.7) | 5345 | (47.1) |
| Total number of births | 8,696 | (100.0) | 11,454 | (100.0) | 11,361 | (100.0) |
EDHS = Egypt Demographic Health Survey.
Little research exists on levels and trends of cesarean section delivery and their stratification by place of delivery for any country in the Arab world. Availability of data at three points of time for Egypt provides a unique opportunity to document changing childbirth practices in this country. Thus, the purpose of this paper was to examine recent levels and trends of cesarean section rates in Egypt, using secondary data from three nationally representative samples of ever-married women aged 15 to 49 years. We also report trends in cesarean section rates by type of hospital.
Data and Methods
Our data come from merging the 1992, 1995, and 2000 Egypt Demographic and Health Surveys (8–10). Each of these cross-sectional surveys was intended to collect demographic and health information on reproductive health indicators for a nationally representative sample of women aged 15 to 49 years. Women were selected by multistage random methods, stratified by rural-urban areas, and by governorates (an administrative division ruled by a governor). A total of 9,864, 14,779, and 15,573 women were interviewed from 10,760, 15,567, and 16,957 households, respectively, in each of these surveys. The overall response rates for these surveys were, respectively, 98.9, 99.3, and 99.5 percent.
The Demographic and Health Surveys have been conducted in many countries with fairly standard instruments, training, and interviewing procedures, and are known for providing good demographic data. However, there were some design differences between the 1992 Egypt Demographic Health Survey, on the one hand, and the 1995 and 2000 surveys, on the other. First, the last two surveys included the Frontier Governorates in the sample. Second, these surveys included additional items and modules to the standard instrument, namely, items on predelivery complications and a module on female circumcision. Furthermore, the 1995 survey had a special module that collected information on women’s status, whereas the 2000 survey included a module on children’s education. Although the addition of these items may have an impact on the quality of the data collected across surveys, we have no reason to believe that they affected the reliability or validity of the standard items on cesarean deliveries considered in this study.
In the three surveys, women were asked the same questions about their pregnancies during the past 5 years before the survey. We combined the surveys to obtain sufficient information on births by year of delivery and to obtain combined retrospective data on the reporting period for the first two surveys. For consistency with previous results (7), we confined the analysis to ever-married women aged 15 to 49 years, with one or more births in the 5 years preceding the survey. The merged data file contained information on a total of 31,511 births.
The response variable was women’s responses to a single item about mode of delivery: cesarean section or vaginal delivery. Total cesarean section rates were first estimated for all births, regardless of place of delivery. This national-based cesarean section rate was obtained by dividing the number of cesarean deliveries by the total number of births across time periods (11). Hospital-based cesarean rates were then estimated, for which the inclusion criterion was based on births occurring in hospitals. A total of 11,625 births met this criterion. Of these, 75 births were excluded because the type, year, or place of delivery was missing. To obtain this estimate, we divided the number of hospital-based cesarean sections by the total number of hospital births.
For all estimates reported here, confidence intervals were calculated to assess the significance of the differences, or any overlap, in the estimated rates across time period and place of delivery. The analysis reported here was undertaken by two statistical programs: Stata 7(12) and S-Plus 6 for Windows (13).
Results
Descriptive statistics for the study sample, with relevant demographic and obstetric characteristics, across surveys are reported in Table 1. Overall, cesarean sections increased from a low of 4.6 percent (95% CI: 4.16–5.05) in 1992 to 6.7 percent (95% CI: 6.21–7.13) in 1995 to a high of 10.3 percent (95% CI: 9.74–10.87) in 2000, based on all births reported and regardless of place of delivery (Table 2). This represents an overall increase of 130 percent in the cesarean delivery rate between 1987 and 2000. However, these trends might reflect the increase in hospital-based delivery in Egypt and concomitant decrease in home births (Table 1).
Table 2.
Number and Rate of Cesarean Deliveries for All Births and for Hospital Births: Egypt, 1992, 1995, 2000*
|
1987–1992
|
1990–1995
|
1995–2000
|
|||||||
|---|---|---|---|---|---|---|---|---|---|
| Cesarean Section Rate | No. of Births | (%) | 95% CI | No. of Births | (%) | 95% CI | No. of Births | (%) | 95% CI |
| All births | 8,692 | (4.6) | (4.16–5.05) | 1,1431 | (6.7) | (6.21–7.13) | 11,349 | (10.3) | (9.74–10.87) |
| Hospital births | 2,355 | (15.3) | (13.90–16.85) | 3,723 | (18.5) | (17.27–19.79) | 5,472 | (20.9) | (19.87–22.05) |
Source: Egypt Demographic and Health Survey micro data, 1992, 1995, 2000.
The corresponding cesarean rates for hospital-based deliveries were much higher than the overall rates, and also increased slightly from a low level of 15.3 percent (95% CI: 13.9–16.85) in the 1992 survey to 18.5 percent (95% CI: 17.27–19.79) in the 1995 survey to 20.9 percent (95% CI: 19.87–22.05) in the 2000 survey, representing a 72 percent increase during the study period. However, recent trends based on hospital births indicated that cesarean section rates did not change greatly since the mid-1990s.
To further corroborate this conclusion, we examined rates of cesarean section by year of delivery using the combined data from the three surveys. The estimates (not shown) were based on 2-year periods instead of 1 year to preserve a sufficient number of cases and to smooth out random errors. A slight decline in cesarean section (0.4%) was observed between the 1987–1988 and 1989–1990 periods. However, the rates increased consistently from 13.5 percent (95% CI: 11.36–15.89) during the 1989–1990 period, to 16.3 percent (95% CI: 14.80–17.82) in 1991–1992, to 19.9 percent (95% CI: 17.94–22.06) in 1993–1994, to 20.5 (95% CI: 18.89–22.14) in 1995–1996, to 20.8 percent (95% CI: 19.17–22.61) in 1997–1998, and to 22.0 percent (95% CI: 20.04–24.05) during the 1999–2000 period. Again, these trends indicated that the overall cesarean section rate has remained at around 20 percent since 1993–1994.
Dis-aggregation by type of hospital (public vs private) showed a rising trend of cesarean section in both private and public hospital births (Fig. 1). During the 1987–1988 period, the rates in public and private hospitals were basically the same at, respectively, 14.0 percent (95% CI: 10.37–18.35) and 13.6 percent (95% CI: 8.71–19.84). Beginning in 1989, a divergence in the rates between private and public hospitals became evident, with cesarean rates in private hospitals being slightly higher than those in public hospitals. Despite this difference, the rates increased consistently for both public (a slight decline in 1989–1990 and 1997–1998 periods) and private hospitals over the years, especially from the late 1980s until the first half of the 1990s. For public hospitals, cesarean section rates increased from 12.2 percent (95% CI: 9.66–15.05) in 1989–1990 to a high of 20.8 percent (95% CI: 18.04–23.77) in 1999–2000; the corresponding rates for private hospitals were 16.0 percent (95% CI: 12.18–20.54) and 23.2 percent (95% CI: 20.42–26.09). Although these results were consistent with previous reports concerning the increase of cesarean deliveries in the developing countries’ context, they clearly showed that such increases were evident in both private and public hospitals, casting serious doubt on the “profitability” argument.
Fig. 1.
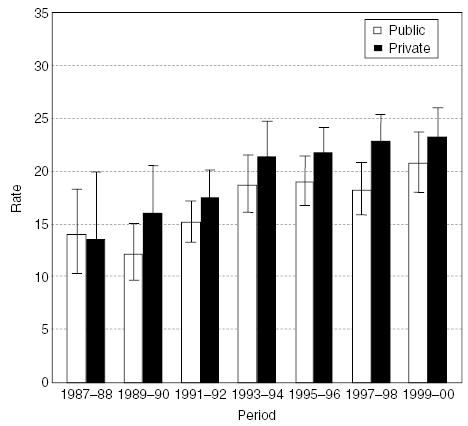
Rates of cesarean deliveries by hospital type, Egypt, 1987–2000.
Discussion and Conclusions
To our knowledge, this is the first study to document trends in cesarean delivery by type of hospital in the Arab region, using population-based survey data. The findings showed a consistent rise in cesarean births in Egypt. Two trends were observed. First, recent hospital-based cesarean section rates of 20 percent are well above the World Health Organization recommendation (2,4,14), indicating possible overuse or inappropriate medical interventions in delivery. It is widely reported that population-based rates higher than 15 percent do not lead to health improvements for mother or newborn (4,14). Second, the increase in cesarean deliveries in Egypt was not confined to private hospitals. In fact, although cesarean section rates during the 1990s were slightly higher in private hospitals, a considerable increase was also observed in the use of this surgical procedure in public hospital settings.
In this brief paper we have been unable to establish precise mechanisms that may have contributed to the increase in cesarean deliveries in Egypt. It is unclear, for example, whether the rise is due to increased complications during delivery, high-risk pregnancies, overuse, patient choice, or other factors. Clearly, recent shifts in the age patterns for fertility in Egypt might be a contributory factor, especially in public hospitals. We have also been unable to distinguish between the prevalence of first-time cesarean delivery and repeat procedures. If most women delivering in hospital have already had a first cesarean section, they tend to deliver in hospitals for fear of having a second such delivery. Although the rule of “once a cesarean, always a cesarean” is not common practice in Egypt, some women tend to think that they might require a cesarean if they have already had one.
The study relied on data from standardized items on cesarean delivery taken at more than one point in time from large, nationally representative samples of ever-married women, and this is its primary strength. However, data on deliveries, and hence the inclusion criteria adopted in these surveys, were only available for a subsample of those ever-married women delivering in the 5 years before the survey date. As a result, the sample on which this study was based may have overrepresented young women of child-bearing age. Furthermore, the age patterns of fertility, and birth spacing, were subject to change across surveys, and might have affected the resulting subsample. However, the sample could be considered representative of all Egyptian women delivering during 5-year periods preceding the survey dates.
The study has other limitations. The findings were based on retrospective data from cross-sectional surveys, and therefore they must be interpreted with caution. It is well known that retrospective data taken for a short period of time yield good demographic estimates, but they suffer from recall bias. However, although the 5-year recall period for the primary item of mode of delivery was short enough to prevent serious recall bias, it might be especially important when estimating the time location of births or age at birth. Some women, and those with low literacy in particular, forget the precise timing of delivery; thus, some deliveries might have occurred earlier than during the 5-year period before the survey. Bias resulting from inaccurate date of delivery (or age at delivery) may not be serious if it affected vaginal and cesarean deliveries similarly.
Moreover, all study data were obtained by means of self-report, with associated problems of validity and social desirability during interviewing. Although interviewers underwent the Demographic Health Survey rigorous training program, and were subjected to careful supervision to ensure validity and confidentiality of responses during fieldwork, we have no means to validate the self-reported responses. Crosschecking with birth history data, and other relevant items in the questionnaires, were undertaken to validate the responses, but medical records did not verify the information. It has been shown, however, that self-reports of pregnancy-related items, such as mode of delivery, are usually valid (15).
The obstetric data in these surveys were rather limited in scope. We do not know, for example, whether cesarean deliveries were medically necessary or elective, or whether or not the cesarean was a repeat procedure. Furthermore, medical indications of cesarean section were rather “thin” in this kind of survey, with an absence of information about some of the primary conditions associated with cesarean delivery, such as fetal distress and dystocia.
The results reported in this study reflect the need for further comprehensive studies to better understand the precise forces sustaining these trends in their broader context, and to develop appropriate policies and guidelines for performing and monitoring cesarean deliveries in Egypt as well as interventions that might encourage an increase in vaginal births.
Acknowledgments
This paper is part of a larger regional research project on Changing Childbirth in the Arab Region, sponsored by the Center for Research on Population and Health at the American University of Beirut, Beirut, Lebanon, with support from the Wellcome Trust, London, United Kingdom, and the Mellon Foundation, New York, United States.
References
- 1.Editorial. Caesarean section on the rise. Lancet. 2000;356:1697. [PubMed] [Google Scholar]
- 2.Dosa L. Caesarean section delivery, and increasingly popular option. Bull World Health Organ. 2001;79:1173. [PMC free article] [PubMed] [Google Scholar]
- 3.De Muylder X. Caesarean section in developing countries: Some considerations. Health Policy Plann. 1993;8:101–112. [Google Scholar]
- 4.UNICEF, World Health Organization, United Nations Population Fund. Guidelines for Monitoring the Availability and Use of Obstetric Services New York: United Nations Children’s Fund, 1997:1–103.
- 5.Belizan JM, Althabe F, Barros FC, Alexander S. Rates and implications of caesarean section in Latin America: Ecological study. BMJ. 1999;319:1397–1400. doi: 10.1136/bmj.319.7222.1397. [DOI] [PMC free article] [PubMed] [Google Scholar]
- 6.Leung GT, Lam H, Thach TQ, et al. Rates of cesarean births in Hong Kong: 1987–1999. Birth. 2001;28:166–172. doi: 10.1046/j.1523-536x.2001.00166.x. [DOI] [PubMed] [Google Scholar]
- 7.Padmadas S, Kumar S, Nair S, Kumari A. Caesarean section delivery in Kerala, India: Evidence from a national family health survey. Soc Sci Med. 2000;51:511–521. doi: 10.1016/s0277-9536(99)00491-8. [DOI] [PubMed] [Google Scholar]
- 8.El-Zanaty F, Way A. Egypt Demographic and Health Survey 2000 Calverton, Maryland: National Population Council [Arab Republic of Egypt] and Macro International. Inc., 2001.
- 9.El-Zanaty F, Hussein E, Shawky G, Way A. Egypt Demographic and Health Survey 1995 Calverton, Maryland: National Population Council [Arab Republic of Egypt] and Macro International, Inc., 1996.
- 10.El-Zanaty F, Sayed H, Zaky H, Way A. Egypt Demographic and Health Survey 1992 Calverton, Maryland: National Population Council [Arab Republic of Egypt] and Macro International, Inc., 1993.
- 11.Menacker F, Curtin SC. Trends in cesarean birth and vaginal birth after previous cesarean, 1991–99. Natl Vital Stat Rep. 2001;49(13):1–16. [PubMed] [Google Scholar]
- 12.Stata Corporation. Stata 7 for Windows College Station, Texas: Stata Corporation, 2001.
- 13.Insightful Corporation. S-Plus 6 for Windows Seattle: Stata Corporation, 2002.
- 14.World Health Organization. Appropriate technology for birth. Lancet. 1985;2:436–437. [PubMed] [Google Scholar]
- 15.Githens P, Glass C, Sloan F, Entman S. Maternal recall and medical records: An examination of events during pregnancy, childbirth, and early infancy. Birth. 1993;20:136–141. doi: 10.1111/j.1523-536x.1993.tb00438.x. [DOI] [PubMed] [Google Scholar]