

Abstract
Extensive fragmentation of nuclear DNA occurs during apoptosis, and the presence of DNA strand breaks is considered to be a marker of the apoptotic mode of cell death. This chapter describes methods to label in situ DNA strand breaks with fluorochromes for detection by flow or laser scanning cytometry. By staining DNA with a fluorochrome of another color, cellular DNA content is measured concurrently and the bivariate analysis of such a data reveals DNA ploidy and cell-cycle phase position of apoptotic cells. The DNA strand break-labeling methodology is also used for detecting the incorporation of halogenated DNA precursors in studies of the cell cycle, proliferation, and DNA replication. In this application, termed “strand breaks induced by photolysis” (SBIP), the cells are incubated with 5-bromo-2′-deoxyuridine (BrdU) to incorporate it into DNA and sensitize the DNA to ultraviolet (UV) light. DNA strand breaks are then photolytically generated by exposing the cells to UV light. The DNA strand breaks resulting from UV-photolysis are subsequently fluorochrome-labeled as for labeling apoptotic-DNA breaks. Because SBIP, unlike the alternative method of detection of BrdU incorporation, does not require subjecting cells to harsh conditions (strong acid or heat) of DNA denaturation, it is compatible with concurrent detection of intracellular or cell surface antigens by immunocytochemical means.
Keywords: Apoptosis, BrdU, cell cycle, DNA fragmentation, DNA photolysis, flow cytometry, laser-scanning cytometry, SBIP, TUNEL, UV light
1. Introduction
DNA fragmentation that leads to an abundance of strand breaks in nuclear DNA is considered to be a hallmark of apoptosis (1–3). One of the most widely used methods to identify apoptotic cells thus relies on labeling DNA strand breaks in situ either with fluorochromes (4–6) or absorption dyes (7,8). The advantage of DNA strand break labeling with fluorochromes is that such cells can be rapidly analyzed by flow or laser scanning cytometry. Furthermore, when cellular DNA content is measured concurrently, after being stained with a fluorochrome of another color, the bivariate analysis of such data reveals DNA ploidy and cell-cycle phase position of cells undergoing apoptosis (4,5,9).
Some methods presented in this chapter can be applied to cells in suspension whose fluorescence is measured by flow cytometry (Subheadings 3.1.1. and 3.2.1.). However, a simple modification of these methods, also presented here (Subheadings 3.1.3. and 3.2.2.), permits the analysis of cells attached to microscope slides. The fluorescence of cells attached to microscope slides can be measured by the laser scanning cytometer (LSC), or by its more recent version, the automatic imaging cytometer, iCyte. These are the microscope-based cytofluorimeters that allow one to measure rapidly, with high sensitivity and accuracy, the fluorescence of individual cells (10,11). The instruments combine advantages of both flow and image cytometry. The staining of cells on slides prevents their loss, which otherwise occurs during the repeated centrifugations of samples during preparation for flow cytometry. Another advantage stems from the possibility of spatially localizing particular cells on the slide for their visual examination or morphometric imaging analysis after the initial measurement of a large population and electronic selection (gating) of the cells of interest. The measured cells can also be bleached and restained with another set of dyes. This permits the cell attributes measured after restaining to be correlated with the attributes measured before, on a cell-by-cell basis (11–13).
Cell fixation and permeabilization are essential steps to label DNA strand breaks successfully. Cells are briefly fixed with a crosslinking fixative, such as formaldehyde, and then permeabilized by suspending them in ethanol. By cross-linking low molecular weight DNA fragments to other cell constituents, formaldehyde prevents extraction of the fragmented DNA, that otherwise occurs during the repeated centrifugations and rinses required by this procedure. The 3′-OH termini of the fragmented DNA serve as primers and become labeled with 5-bromo-2′-deoxyuridine (BrdU) in a reaction catalyzed by exogenous terminal deoxynucleotidyl transferase (TdT) and BrdUTP (14). The incorporated BrdU is immunocytochemically detected by anti-BrdU antibody conjugated to fluorescein isothiocyanate (FITC) (14,15). This reagent is widely used in studies of cell proliferation to detect BrdU incorporated during DNA replication (16). The overall cost of reagents is markedly lower and the sensitivity of DNA strand break detection is higher when BrdUTP is used as a marker, compared to labeling with biotin-, digoxygenin-, or directly fluorochrome-tagged deoxynucleotides (Fig. 1) (14). However, because certain applications may require the use of multiple fluorochromes, alternative procedures utilizing the latter three reagents are also described in this chapter.
Fig. 1.
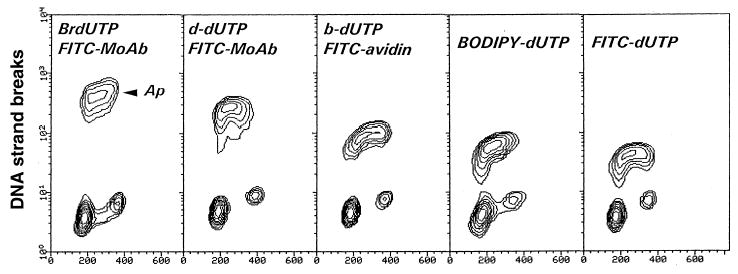
Detection of apoptotic cells by flow cytometry using different methods of DNA strand break labeling. Bivariate distributions represented by isometric contour maps (DNA content vs DNA strand break labeling) of HL-60 cells incubated for 3 h with 0.15 μM camptothecin, which preferentially induces apoptosis (Ap) of DNA replicating cells (4,9). The first three panels to the left represent indirect labeling of DNA strand breaks, utilizing either BrdUTP, digoxygenin-conjugated dUTP (d-dUTP), or biotinylated dUTP (b-dUTP). The two right panels show cell distributions following a direct, single-step DNA strand break labeling, either with BODIPY- or FITC-conjugated dUTP. Note the exponential scale of the ordinate. As is evident, the greatest difference is achieved following DNA strand break labeling with BrdUTP (14).
The DNA strand break labeling methodology also can be used for detecting the incorporation of halogenated DNA precursors in studies of the cell cycle, proliferation and DNA replication. In this application, termed “strand breaks induced by photolysis” (SBIP; Subheading 3.2.), the cells are incubated with BrdU or 5-iodo-2′-deoxyuridine (IdU) to incorporate these base analogs into DNA, and DNA strand breaks are photolytically generated by exposure of the cells to ultraviolet (UV) light; the incorporated precursor sensitizes DNA to UV light (14,15). DNA breaks resulting from UV photolysis, which in this case are markers of precursor incorporation (i.e., DNA replication), are subsequently fluorochrome-labeled in the same way as described for labeling apoptotic DNA breaks. Because the SBIP method does not require subjecting cells to the harsh conditions (strong acid or heat) of DNA denaturation, as the alternative approach does (16), it is compatible with the concurrent detection of intracellular or cell surface antigens by immunocytochemical means (14).
2. Materials
2.1. DNA Strand Break Labeling
Phosphate-buffered saline (PBS), pH 7.4.
1% Formaldehyde (methanol-free, ultrapure; Polysciences, Warrington, PA) in PBS, pH 7.4.
70% Ethanol.
TdT (Roche). TdT 5X reaction buffer: 1 M potassium (or sodium) cacodylate, 125 mM HCl, pH 6.6, 1.25 mg/mL of bovine serum albumin (BSA; Sigma, St. Louis, MO). This 5X reaction buffer can be purchased from Roche.
5-Bromo-2′-deoxyuridine-5′-triphosphate (BrdUTP) stock solution (50 μL): 2 mM BrdUTP (Sigma) in 50 mM Tris-HCI, pH 7.5.
10 mM CoCl2 (Roche).
Rinsing buffer: 0.1% Triton X-100 and 5 mg/mL of BSA dissolved in PBS.
FITC-conjugated anti-BrdU monoclonal antibody (MAb): Dissolve 0.3 μg of FITC-conjugated anti-BrdU MAb (Becton Dickinson, Immunocytometry Systems, San Jose, CA) in 100 μL of PBS containing 0.3% Triton X-100 (Sigma) and 1% BSA.
Propidium iodide (PI) staining buffer: 5 μg/mL of PI (Molecular Probes, Eugene, OR), 100 μg/mL of RNase A (DNase-free; Sigma) in PBS.
Cytospin centrifuge (Shandon, Pittsburgh, PA): for use in conjunction with laser scanning cytometry.
Kits for labeling DNA strand breaks that utilize the BrdUTP–TdT methodology similar to that described in this chapter are commercially available from Phoenix Flow Systems (San Diego, CA) and several other vendors (APO-BRDU™). Some kits contain positive-control cell samples that have a subpopulation of cells with abundant DNA breakage. Such controls are helpful to reveal whether the inability to detect cells with DNA strand breaks in the experimental sample is due to their absence or technical problems with the kit (e.g., inactive TdT).
2.2. Additional Reagents and Equipment for SBIP
BrdU (Sigma).
60 × 15 mm polystyrene Petri dishes (Corning, Corning, NY).
UV light illumination source: Fotodyne UV 300 analytic DNA transilluminator containing four 15-W bulbs (Fotodyne Inc., New Berlin, WI).
UV light photometer: UVX-25 Sensor (UVP, Upland, CA).
A kit based on the SBIP methodology (APO-DIRECT) is commercially available from Phoenix Flow Systems and from several other suppliers of reagents for cytometry.
2.3. Instrumentation
Flow cytometers of different types, offered by several manufacturers, can be used to measure cell fluorescence following staining according to the procedures described below. The manufacturers of the most common flow cytometers are Coulter Corporation (Miami, FL), Becton Dickinson Immunocytometry Systems (San Jose, CA), Cytomation/DAKO (Fort Collins, CO) and PARTEC (Zurich, Switzerland). The multiparameter LSC and iCyte are available from CompuCyte (Cambridge, MA).
The software to deconvolute the DNA content frequency histograms to analyze the cell cycle distributions is available from Phoenix Flow Systems (San Diego, CA) and Verity Software House (Topham, MA).
3. Methods
3.1. Detection of Apoptotic Cells by DNA Strand Break Labeling (see Note 1)
3.1.1. DNA Strand Break Labeling With BrdUTP for Analysis by Flow Cytometry
Suspend 1–2 × 10⁶ cells in 0.5 mL of PBS. With a Pasteur pipet, transfer this suspension to a 6-mL polypropylene tube (see Note 2) containing 4.5 mL of ice-cold 1% formaldehyde (see Note 3). Incubate on ice for 15 min.
Centrifuge at 300g for 5 min, and resuspend the cell pellet in 5 mL of PBS. Centrifuge again, and resuspend the cells in 0.5 mL of PBS. With a Pasteur pipet, transfer the suspension to a tube containing 4.5 mL of ice-cold 70% ethanol. The cells can be stored in ethanol at −20°C for several weeks.
Centrifuge at 200g for 3 min, remove the ethanol, resuspend the cells in 5 mL of PBS, and centrifuge at 300g for 5 min.
-
Resuspend the pellet in 50 μL of a solution containing:
10 μL of TdT 5X reaction buffer.
2.0 μL of BrdUTP stock solution.
0.5 μL (12.5 U) of TdT.
5 μL of CoCl2 solution.
33.5 μL of distilled H2O.
Incubate the cells in this solution for 40 min at 37°C (see Notes 4 and 5).
Add 1.5 mL of the rinsing buffer, and centrifuge at 300g for 5 min.
Resuspend the cell pellet in 100 μL of FITC-conjugated anti-BrdU Ab solution.
Incubate at room temperature for 1 h.
Add 1 mL of PI staining solution.
Incubate for 30 min at room temperature, or 20 min at 37°C, in the dark.
-
Analyze the cells by flow cytometry.
3.1.2. DNA Strand Break Labeling With Other Markers for Analysis by Flow Cytometry
As mentioned in Subheading 1., DNA strand breaks can be labeled with deoxynucleotides tagged with a variety of other fluorochromes. For example, the Molecular Probes (Eugene, OR) catalog lists seven types of dUTP conjugates, including three BODIPY dyes (e.g., BODIPY-FL-X-dUTP), fluorescein, cascade blue, Texas red, and dinitrophenol. Several cyanine dyes conjugates (e.g., CY-3-dCTP) are available from Biological Detection Systems (Pittsburgh, PA). Indirect labeling via biotinylated or digoxygenin-conjugated deoxynucleotides offers a multiplicity of commercially available fluorochromes (fluorochrome-conjugated avidin or streptavidin, as well as digoxygenin antibodies) with different excitation and emission characteristics. DNA strand breaks, thus, can be labeled with a dye of any desired fluorescence color and excitation wavelength (Fig. 1).
The procedure described in Subheading 3.1.1. can be adapted to utilize each of these fluorochromes. In the case of direct labeling, the fluorochrome-conjugated deoxynucleotide is included in the reaction solution (0.25–0.5 nmol/50 μL) instead of BrdUTP, as described in step 4 of Subheading 3.1.1. Following the incubation step (step 5), omit steps 6–8 and stain the cells directly with PI (step 9). In the case of indirect labeling, digoxygenin- or biotin-conjugated deoxnucleotides are included in the reaction buffer (0.25–0.5 nmol/50 μL) instead of BrdUTP at step 4. The cells are then incubated either with fluorochrome-conjugated antidigoxigenin MAb (0.2–0.5 μg/100 μL of PBS containing 0.1% Triton X-100 and 1% BSA) or with fluorochrome-conjugated avidin or streptavidin (0.2–0.5 μg/100 μL, as above) at step 7 and then processed through steps 8–10 as described in the protocol. Cytometric analysis is performed with the excitation and emission wavelength appropriate to the applied fluorochrome.
3.1.3. DNA Strand Break Labeling for Analysis by Laser Scanning Cytometry
Transfer 300 μL of cell suspension (in tissue-culture medium with serum) containing approx 20,000 cells to a cytospin chamber. Cytocentrifuge at 1000 rpm for 5 min.
Without allowing the cytocentrifuged cells to dry completely, prefix them in 1% formaldehyde in PBS (in a Coplin jar) for 15 min on ice.
Transfer the slides to 70% ethanol, and fix for at least l h. The cells can be stored in ethanol for several weeks at −20°C.
Follow steps 4–8 of Subheading 3.1.1. Carefully layer small volumes (approx 100 μL) of the respective buffers, rinses, or staining solutions on the cytospin area of the horizontally placed slides. At appropriate times, remove these solutions with a Pasteur pipet (or vacuum suction pipet). To prevent drying, place 2 × 4 cm2 pieces of thin polyethylene foil on the slides over the cytospins, atop the drops of the solutions used for cell incubations (see Note 8).
Mount the cells under a cover slip in a drop of the PI staining solution. Seal the edges of the cover slip with melted paraffin or a gelatin-based sealer.
-
Measure cell fluorescence by laser scanning cytometry.
Excite fluorescence with a 488-nm laser line.
Measure green fluorescence of FITC at 530 ± 20 nm.
-
Measure red fluorescence of PI at >600 nm.
Apoptotic cells detected by this method are shown in Fig 2.
Fig. 2.
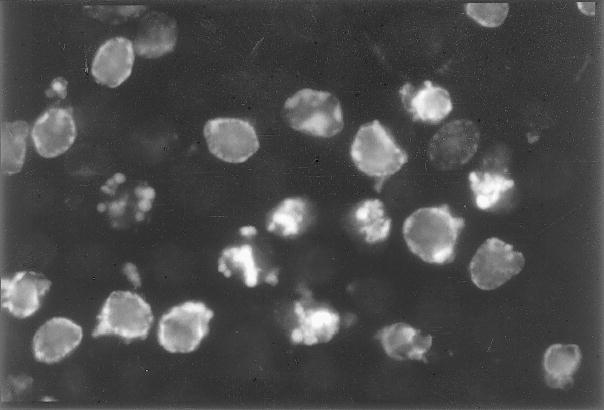
Detection of apoptosis-associated DNA strand breaks. HL-60 cells were incubated with 0.15 μM camptothecin for 2.5 h, cytocentrifuged, fixed, and the DNA strand breaks were labeled with BrdUTP. The incorporated BrdU was then detected by FITC-conjugated anti-BrdU MAb, as described in Subheading 3.1.3.; however, the cells were not counterstained with PI. Note the predominance of DNA strand breaks in early apoptotic cells (prior to nuclear fragmentation) at the nuclear periphery, and strong labeling of the fragmented nuclei of late apoptotic cells.
3.1.4. Controls
The procedure of DNA strand break labeling is rather complex and involves many reagents. Negative results, therefore, may not necessarily mean the absence of DNA strand breaks, but may be due to methodological problems, such as loss of TdT activity, degradation of BrdUTP, and so forth. It is necessary, therefore, to include both positive and negative controls. An excellent control is to use HL-60 cells treated (during their exponential growth) for 3–4 h with 0.2 μM of the DNA topoisomerase I inhibitor camptothecin (CPT). Because CPT induces apoptosis selectively during S phase, cells in G1, and G2/M may serve as negative control populations, whereas the S phase cells in the same sample represent the positive control. As mentioned, some commercial kits provide such control cells. Another negative control consists of cells processed as described in Subheading 3.1.1., except that TdT is excluded from step 4.
3.2. Detection of Cells Incorporating BrdU by the SBIP Method
The method of DNA strand break labeling described above for the identification of apoptotic cells also can be used to detect the presence of BrdU or IdU incorporated into DNA. A variety of different schemes may be used to label cells with these precursors. Pulse labeling, for example, is used to detect S-phase cells. A pulse-chase labeling strategy is used to follow a cohort of labeled cells progressing through various phases of the cycle for kinetic studies. Continuous labeling allows one to detect all proliferating cells in a culture or tumor to estimate the cell growth fraction. The scope of this chapter does not allow us to present technical details of cell labeling in cultures or in vivo, which are available elsewhere (17). In general, 10–30 μM BrdU is used for in vitro cell labeling, and the time of incubation for pulse-labeling varies between 10 and 60 min. It is important to maintain lightproof conditions (e.g., the cultures should be wrapped in aluminum foil) during and after cell labeling with BrdU, to prevent DNA photolysis.
Following incorporation of BrdU (or IdU), the cells are fixed, subjected to UV light illumination to photolyze the DNA at sites of the incorporated precursor, and the resulting DNA strand breaks are labeled identically to the DNA strand breaks of apoptotic cells in Subheadings 3.1.1. and 3.1.2. To distinguish between DNA strand breaks in apoptotic cells and photolytically generated (BrdU-associated) breaks, the apoptotic DNA strand breaks may initially be labeled with a fluorochrome of one color, the cells then subjected to UV light illumination, and the photolytically generated breaks subsequently labeled with a fluorochrome of another color (15) (see Subheading 3.1.2.). The method of DNA photolysis presented below can be applied to any type of cells that have been labeled with BrdU or IdU.
3.2.1. SBIP Procedure for Cell Analysis by Flow Cytometry
Suspend 1–2 × 10⁶ cells, previously incubated with BrdU, in 2 mL of ice-cold PBS.
Transfer the cell suspension to 60 × 15 mm polystyrene Petri dishes.
Place the dishes directly on the glass surface of a Fotodyne UV 300 analytic DNA gel transilluminator, which provides maximal illumination at 300-nm wavelength. Check the intensity of UV light by using a UV light photometer placed on the surface of the transilluminator. With relatively new UV bulbs, the intensity is expected to be 4–5 mW/cm2. Other sources of UV light may be used provided that maximal intensity is at a wavelength close to 300 nm and the geometry of cell illumination favors uniform exposure of all cells (see Note 9).
Expose the cells to UV light for 5–10 min.
Transfer the cells to polypropylene tubes, and centrifuge at 300g for 5 min.
Suspend the cell pellet in 0.5 mL of PBS.
Transfer the cell suspension with a Pasteur pipet to a 6-mL polypropylene tube containing 4.5 mL of 70% ethanol, on ice. The cells can be stored in ethanol at −20°C for months.
Label the strand breaks, and process the cells for flow cytometry as described in Subheading 3.1.1., steps 3–11.
Controls should include cells incubated in the absence of BrdU (or IdU), as well as cells not illuminated with UV light.
3.2.2. SBIP Procedure for Cell Analysis by Laser Scanning Cytometry
Transfer 300 μL of cell suspension in tissue culture medium (with serum) containing approx 20,000 cells into a cytospin chamber. Cytocentrifuge at 1000 rpm for 6 min.
Without allowing the cytocentrifuged cells to dry completely, fix the slides in 70% ethanol, in Coplin jars, on ice, for at least 2 h. The slides can be stored in ethanol for months at −20°C.
Rinse the slides in PBS.
To photolyze the DNA, remove the slides from PBS and place (while still wet) on the glass surface of the transilluminator. The cytospinned cells should be placed face down, with the slide supported on both sides (e.g., with two other microscope slides) to prevent contact between the cells and the transilluminator glass surface (see Note 10).
Expose the cells to UV light for 5–10 min.
Process the cells as described in steps 4 and 5 of Subheading 3.1.3.
Measure cell fluorescence by laser scanning cytometry as described in step 6 of Subheading 3.1.3. (See Figs. 3 and 4.)
Fig. 3.
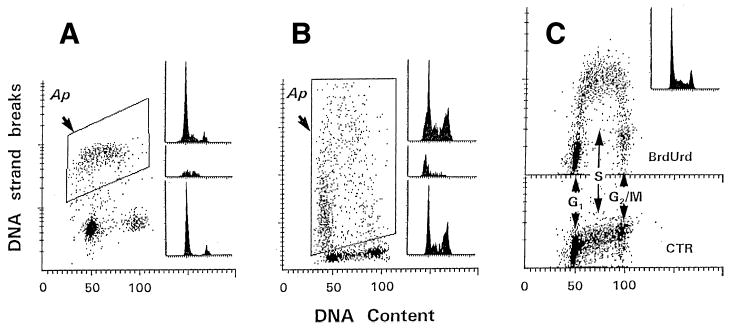
Detection of apoptosis and DNA replication by differential labeling of DNA strand breaks and fluorescence measurement by laser scanning cytometry. Bivariate distributions (scattergrams) representing intensity of DNA strand break labeling with different fluorochromes vs cellular DNA content, identifying apoptotic, and BrdU-incorporating cells. (A) HL-60 cells were incubated with 0.15 μM camptothecin for 3 h. DNA strand breaks were directly labeled with dUTP conjugated to BODIPY. DNA histograms (insets) represent all cells (top), apoptotic cells located within the gating window (middle), and nonapoptotic cells (bottom). Notice that apoptosis is specific to S-phase cells. Ordinate, exponential scale. (B) Cells were subjected to hyperthermia (43.5°C, 30 min) and then incubated for 3 h at 37°C. DNA strand breaks in apoptotic cells were indirectly labeled with d-dUTP and detected by fluoresceinated antidigoxygenin antibody. Top DNA histogram, all cells; middle histogram, apoptotic cells (within the gating window); bottom histogram, nonapoptotic cells. Ordinate, linear scale. (C) Detection of BrdU incorporation (1-h pulse) by SBIP using indirect labeling with d-dUTP and detection by fluoresceinated antidigoxygenin antibody (top). Bottom, the cells were incubated in the absence of BrdU (control). DNA histogram represents all cells. Ordinate, exponential scale (15).
Fig. 4.
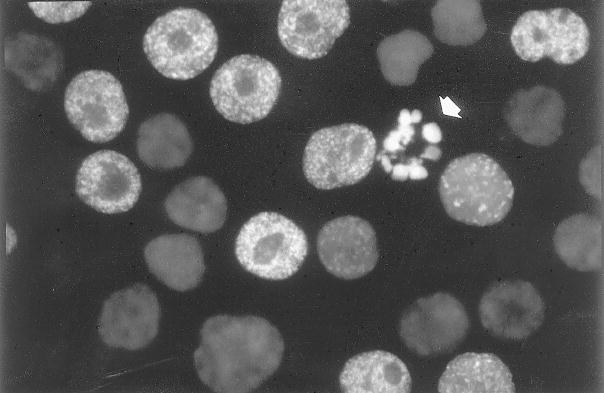
Detection of photolysis-associated DNA strand breaks. HL-60 cells were pulse labeled (1 h) with BrdU. Their DNA was photolyzed by exposure to UV light, and DNA strand breaks were labeled with BrdUTP as described in Subheading 3.2.2. Cellular DNA was counterstained with 7-aminoactinomycin D. The sites of DNA replication (“replication factories”) have a characteristic distribution, and nucleoli are unlabeled. A single apoptotic cell with a fragmented nucleus (arrow) is also labeled, but the labeling is diffuse, not granular.
3.2.3. Controls for SBIP
As a negative control, analyze cells that were not incubated with BrdU (or IdU). Such a control is preferred over using an isotypic IgG (as a control for anti-BrdU Ab), since the latter does not always allow accurate discrimination between BrdU-labeled and unlabeled cells. Two types of positive controls are suggested. As a positive control for the DNA strand break labeling procedure alone, apoptotic cells prepared using CPT as described in Subheading 3.1.4. should be used. As another positive control, exponentially growing cells incubated with 30 μM BrdU for 1 h, and then processed as described in Subheading 3.2.1. or 3.2.2. should be used. In this control, one expects S-phase cells, that is, cells with a DNA content between 1.0 and 2.0 DNA index (DI), to show BrdU incorporation, and G1 (DI = 1.0) and G2/M cells (DI = 2.0) to be negative.
4. Notes
This method is useful for clinical material, such as obtained from leukemias, lymphomas, and solid tumors (18,19), and can be combined with surface immunophenotyping. The cells are first immunophenotyped, then fixed with formaldehyde (which stabilizes the antibody bound on the cell surface), and subsequently subjected to the DNA strand break detection assay using different color fluorochromes (see Subheading 3.1.2.) than those used for immunophenotyping.
When the sample initially contains a small number of cells, cell loss during repeated centrifugations is a problem. To minimize cell loss, polypropylene or siliconized glass tubes are recommended. Since transferring cells from one tube to another results in irreversible electrostatic attachment of a large fraction of cells to the surface of each new tube, all steps of the procedure (including fixation) should be done in the same tube. Addition of 1% BSA to rinsing solutions also decreases cell loss. When the sample contains very few cells, carrier cells (e.g., chick erythrocytes) may be included, which later can be recognized based on differences in DNA content. Cell analysis by LSC or iCyte, of course, has no such problem.
Cell prefixation with a crosslinking agent, such as formaldehyde, is required to prevent extraction of the fragmented DNA from apoptotic cells. This ensures that despite repeated cell washings, the DNA content of apoptotic cells (and with it, the number of DNA strand breaks) is not markedly diminished. No prefixation with formaldehyde is required to detect DNA strand breaks induced by photolysis (Subheading 3.2.).
Alternatively, incubate at 22–24°C overnight.
Control cells may be incubated in the same solution, but without TdT.
It is generally easy to identify apoptotic cells owing to their intense labeling with FITC conjugated anti-BrdU MAb. Their high fluorescence intensity often requires the use of the exponential scale (logarithmic amplifiers of the flow cytometer) for data acquisition and display (Fig. 1). As is evident in Fig. 1, because cellular DNA content of both apoptotic and nonapoptotic cell populations is measured, the cell-cycle distribution and/or DNA ploidy of these populations can be estimated.
While strong fluorescence, which indicates the presence of extensive DNA breakage, is a characteristic feature of apoptosis, weak fluorescence does not necessarily mean the lack of apoptosis. In some cell systems, DNA cleavage generates DNA fragments 50–300 kb in size and does not progress into internucleosomal (spacer) sections (20).
It is essential that the incubations are carried out in a moist atmosphere to prevent drying at any step of the reaction. Even minor drying produces severe artifacts.
In the SBIP procedure, to detect incorporated BrdU or IdU, the critical step is to expose the cells to an optimal and uniform dose of UV light. During the exposure, therefore, the layer of cell suspension should be thin and the Petri dishes should be exposed while in a horizontal position. Local cell crowding at the edges of the dish should be avoided, since it introduces undesired heterogeneity during illumination. Because the intensity of UV light at the surface of the transilluminator is uneven, depending very much on the position of the UV bulb underneath the glass, the “sweet spot” of relatively uniform intensity has to be found with a UV photometer. The cells should then be placed at this position for irradiation. Overexposure induces photolysis of native DNA, which has no incorporated BrdU. The signal-to-noise ratio in the detection of BrdU is then decreased owing to a high fluorescence background of the BrdU-unlabeled cells. Illumination of cells in the presence of Hoechst 33258, a dye that via a resonance energy transfer mechanism additionally photosensitizes BrdU, increases labeling of the DNA that contains incorporated BrdU (21).
Alternatively, the cells maybe photolyzed in suspension, prior to fixation, as described in the procedure for flow cytometry (steps 1–4 of Subheading 3.2.1.), then cytocentrifuged, fixed in ethanol, and processed for DNA strand break labeling.
Acknowledgments
This work was supported by NCI Grant R01 28704 and “This Close” Foundation for Cancer Research. Dr. Masaki Okafuji was on leave from the Department of Oral and Maxillofacial Surgery, Yamaguchi University School of Medicine, Ube, Japan.
References
- 1.Arends MJ, Morris RG, Wyllie AH. Apoptosis: the role of endonuclease. Am J Pathol. 1990;136:593–608. [PMC free article] [PubMed] [Google Scholar]
- 2.Compton MM. A biochemical hallmark of apoptosis: Internucleosomal degradation of the genome. Cancer Metastasis Rev. 1992;11:105–119. doi: 10.1007/BF00048058. [DOI] [PubMed] [Google Scholar]
- 3.Nagata S, Nagase H, Mukae N, Fukuyama H. Degradation of chromosomal DNA during apoptosis. Cell Death Differ. 2003;10:108–116. doi: 10.1038/sj.cdd.4401161. [DOI] [PubMed] [Google Scholar]
- 4.Gorczyca W, Bruno S, Darzynkiewicz RJ, Gong J, Darzynkiewicz Z. DNA strand breaks occurring during apoptosis: their early in situ detection by the terminal deoxynucleotidyl transferase and nick translation assays and prevention by serine protease inhibitors. Int J Oncol. 1992;1:639–648. doi: 10.3892/ijo.1.6.639. [DOI] [PubMed] [Google Scholar]
- 5.Darzynkiewicz Z, Juan G, Li X, Gorczyca W, Murakami T, Traganos F. Cytometry in cell necrobiology: analysis of apoptosis and accidental cell death (necrosis) Cytometry. 1997;27:1–20. [PubMed] [Google Scholar]
- 6.Ehemann V, Sykora J, Vera-Delgado J, Lange A, Otto HF. Flow cytometric detection of spontaneous apoptosis in human breast cancer using the TUNEL-technique. Cancer Lett. 2003;194:125–131. doi: 10.1016/s0304-3835(03)00054-5. [DOI] [PubMed] [Google Scholar]
- 7.Gold R, Schmied M, Rothe G, et al. Detection of DNA fragmentation in apoptosis: Application of in situ nick translation to cell culture systems and tissue sections. J Histochem Cytochem. 1993;41:1023–1030. doi: 10.1177/41.7.8515045. [DOI] [PubMed] [Google Scholar]
- 8.Wijsman JH, Jonker RR, Keijzer R, Van De Velde CJH, Cornelisse CJ, VanDierendonck JH. A new method to detect apoptosis in paraffin sections: in situ end-labeling of fragmented DNA. J Histochem Cytochem. 1993;41:7–12. doi: 10.1177/41.1.7678025. [DOI] [PubMed] [Google Scholar]
- 9.Gorczyca W, Gong J, Ardelt B, Traganos F, Darzynkiewicz Z. The cell cycle related differences in susceptibility of HL-60 cells to apoptosis induced by various antitumor drugs. Cancer Res. 1993;53:3186–3192. [PubMed] [Google Scholar]
- 10.Kamentsky LA. Laser scanning cytometry. Methods Cell Biol. 2001;63:51–87. doi: 10.1016/s0091-679x(01)63007-3. [DOI] [PubMed] [Google Scholar]
- 11.Darzynkiewicz Z, Bedner E, Gorczyca W, Melamed MR. Laser scanning cytometry. A new instrumentation with many applications. Exp Cell Res. 1999;249:1–12. doi: 10.1006/excr.1999.4477. [DOI] [PubMed] [Google Scholar]
- 12.Smolewski P, Grabarek J, Kamentsky LA, Darzynkiewicz Z. Bivariate analysis of cellular DNA vs RNA content by laser scanning cytometry using the product of signal subtraction (differential fluorescence; DF) as a separate parameter. Cytometry. 2001;45:73–78. doi: 10.1002/1097-0320(20010901)45:1<73::aid-cyto1146>3.0.co;2-a. [DOI] [PubMed] [Google Scholar]
- 13.Haider AS, Grabarek J, Eng B, et al. In vitro wound healing analyzed by laser scanning cytometry. Accelerated healing of epithelial cell monolayers in the presence of hyaluronate. Cytometry. 2003;53A:1–8. doi: 10.1002/cyto.a.10032. [DOI] [PubMed] [Google Scholar]
- 14.Li X, Darzynkiewicz Z. Labelling DNA strand breaks with BrdUTP. Detection of apoptosis and cell proliferation. Cell Prolif. 1995;28:571–579. doi: 10.1111/j.1365-2184.1995.tb00045.x. [DOI] [PubMed] [Google Scholar]
- 15.Li X, Melamed MR, Darzynkiewicz Z. Detection of apoptosis and DNA replication by differential labeling of DNA strand breaks with fluorochromes of different color. Exp Cell Res. 1996;222:28–37. doi: 10.1006/excr.1996.0004. [DOI] [PubMed] [Google Scholar]
- 16.Dolbeare F, Selden JR. Immunochemical quantitation of bromodeoxyuridine: application to cell cycle kinetics. Methods Cell Biol. 1994;41:297–310. [PubMed] [Google Scholar]
- 17.Gray, J. W. and Darzynkiewicz, Z. (1987) Techniques in Cell Cycle Analysis. Humana Press, Totowa, NJ.
- 18.Halicka HD, Seiter K, Feldman EJ, et al. Cell cycle specificity during treatment of leukemias. Apoptosis. 1997;2:25–39. doi: 10.1023/a:1026431524236. [DOI] [PubMed] [Google Scholar]
- 19.Li X, Gong J, Feldman E, Seiter K, Traganos F, Darzynkiewicz Z. Apoptotic cell death during treatment of leukemias. Leuk Lymphoma. 1994;13:65–72. doi: 10.3109/10428199409052678. [DOI] [PubMed] [Google Scholar]
- 20.Oberhammer F, Wilson JW, Dive C, et al. Apoptotic death in epithelial cells: cleavage of DNA to 300 and/or 50 kb fragments prior to or in the absence of internucleosomal fragmentation. EMBO J. 1993;12:3679–3684. doi: 10.1002/j.1460-2075.1993.tb06042.x. [DOI] [PMC free article] [PubMed] [Google Scholar]
- 21.Li X, Traganos F, Melamed MR, Darzynkiewicz Z. Single-step procedure for labeling DNA strand breaks with fluorescein- or BODIPY-conjugated deoxynucleotides: detection of apoptosis and bromodeoxyuridine incorporation. Cytometry. 1995;20:172–180. doi: 10.1002/cyto.990200210. [DOI] [PubMed] [Google Scholar]