Abstract
We demonstrate the direct and noninvasive imaging of functional neurons by ionic contrast terahertz near-field microscopy. This technique provides quantitative measurements of ionic concentrations in both the intracellular and extracellular compartments and opens the way to direct noninvasive imaging of neurons during electrical, toxin, or thermal stresses. Furthermore, neuronal activity results from both a precise control of transient variations in ionic conductances and a much less studied water exchange between the extracellular matrix and the intraaxonal compartment. The developed ionic contrast terahertz microscopy technique associated with a full three-dimensional simulation of the axon-aperture near-field system allows a precise measurement of the axon geometry and therefore the direct visualization of neuron swelling induced by temperature change or neurotoxin poisoning. Water influx as small as 20 fl per μm of axonal length can be measured. This technique should then provide grounds for the development of advanced functional neuroimaging methods based on diffusion anisotropy of water molecules.
Keywords: near-field microscopy, neuron
Pioneered studies in the field of terahertz (1 THz = 1012 Hz) technology followed by more recent advances in laser technology have paved the way for a wide range of applications (1) including terahertz imaging for semiconductor characterization, chemical analysis, and biological and medical imaging (2, 3). Among the involved advantages and by contrast to x-ray imaging, the sample does not suffer from terahertz imaging thanks to the low associated photon energy. Terahertz imaging in biology has been used for tissue investigations with diagnosis perspectives in dermatology and odontology (4–6). Furthermore, recent developments in terahertz guiding through waveguides and metal wires (7, 8) offer the perspective of probing biological samples in situ. In this work, we show that absorption spectroscopy in the terahertz range is very sensitive to biological ion concentrations. Hence, terahertz transmission spectroscopy offers an efficient way to observe neurons by the variation of intra- and extracellular ionic concentrations, mainly potassium (K+) and sodium (Na+). This technique offers a promising alternative to conventional techniques, such as intracellular microelectrodes (9), patch clamp recording (10), and fluorescence and confocal microscopy (11). Furthermore, by probing with a near-field geometry that allows a spatial resolution beyond the diffraction limit (≈300 μm at 1 THz) we succeed to observe subwavelength changes in axon geometry. Finally, we demonstrate the potential of ionic contrast terahertz near-field imaging in biological samples as a noninvasive and quantitative technique, by precisely studying the influence of Na loading on the axon geometry and water contain, induced by adding Na channel toxin or by lowering the axon temperature.
Results and Discussion
Terahertz Ion Spectroscopy.
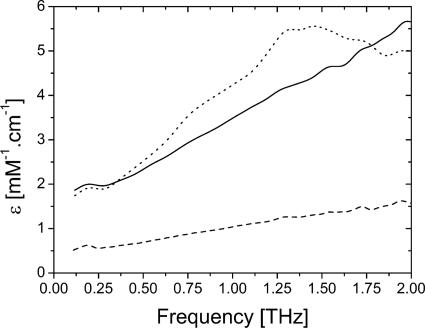
In a first step, we have to evaluate the relative contribution of the bulk water to the overall absorption of ionic solution. Water absorption in the terahertz domain has already been reported in the recent literature (12). Water presents reasonably low attenuation below 1 THz (13). Field absorption is, for instance, 75 cm−1 at 0.5 THz. This makes tractable terahertz measurements on water-rich samples of up to few hundreds micrometers thickness opening the way to cell and more specifically neuron imaging. It is noteworthy that in living tissues the most relevant ions are K+, Na+, and Ca++. We have performed time domain spectroscopy to record ionic terahertz absorption profiles. The data presented in Fig. 1 reveal that KCl and CaCl2 isotonic solutions absorb about three times more than NaCl, within the 0.1–2 THz spectral window. The ionic absorption band is very similar to the one of bulk water, exhibiting no specific features. Therefore, the absorption results from the modification of the dielectric properties of the water solvent by the surrounding ions. In a Debye model (14), absorption originates from the diffusive relaxation of induced polarization. Ions induce relaxation diffusion modifications by altering the water structure in the surrounding water shells. The spectral absorption around 1 THz is often referred to ion-pair relaxation processes (15). Comparison between Na+ and K+ data indicates stronger absorption by K+, consistent with the fact that K+ surrounding water shell is smaller than for Na+ and then allows more profound ion-pair interaction. Quantitative comparison between ions is straightforward for the monovalent K+ and Na+ ions. For CaCl2, we can only give an upper limit. However, [Ca++] inside and outside neurons are negligible compared with [K+] and [Na+], at least by two orders of magnitude. As a consequence, [K+] and [Na+] millimolar changes are essentially responsible to imaging contrast. Therefore, ionic terahertz absorption technique allows the noninvasive measurement of the ionic content in living tissues.
Fig. 1.
Amplitude absorption spectra of KCl (solid line), NaCl (dashed line), and CaCl2 (dotted line), subtracted by the spectrum of double deionized water. The concentrations are below 100 mM. Absorption is given by the amplitude molar extinction coefficient ε, defined as T/T0 = eεCl, where T and T0 are the ion and water terahertz amplitude signals, C is the ion concentration, and l is the sample thickness.
Transverse Section of Axon.
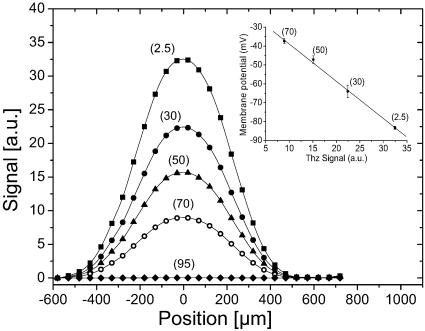
The demonstration of terahertz near-field neuron imaging with a 200-μm aperture diameter is depicted in Fig. 2, showing transverse scans of the same axon, bathed in a physiological solution. As in all our ionic contrast terahertz measurements, the delay remains fixed, and the amplitude of the terahertz signal is recorded versus the position of the axon. In this experiment, [K+]0 was progressively increased from physiological [K+]0 (2.5 mM), to a concentration matching the one inside the neuron (95 mM). First, as expected from relative absorption efficiency between K+ and Na+, we observe a strong contrast between inside neuron, where the absorption value is higher, and the extracellular solution, revealing a highly contrasted neuron profile. When [K+]0 matches the intracellular K+ concentration [K+]i, no signal modulation is observed, demonstrating that the contrast is indeed generated by ion differential absorption, and that the contribution of the membrane to the signal and that of all other tissues that would have remained is completely negligible. Electrophysiological recording of the resting membrane potential (Vm) using intracellular microelectrodes have been performed on axons bathed in physiological solutions containing increasing values of [K+]0 (Fig. 2 Inset). A very good correlation between the amplitude of the terahertz signal and Vm is demonstrated, and introducing the Nernst equation that linearly relates Vm to [K+]0/[K+]i, our results clearly reveal that terahertz imaging allows a direct measure of [K+]i.
Fig. 2.
Terahertz imaging of the same axon bathed in a physiological (millimolar) solution containing increasing [K+]0: 2.5 mM (squares), 30 mM (filled circles), 50 mM (triangles), 70 mM (open circles), and 95 mM (diamonds), with an aperture diameter of 200 μm. The delay remained fixed, and the spatial stepping size was 50 μm. (Inset) Linear dependence exists between the terahertz signal and the membrane potential recorded by using intracellular microelectrodes. Figures associated to each points correspond to tested [K+]0. Vertical bars show the standard deviation of measurements on six different axons. Solid lines are fits from numerical simulations.
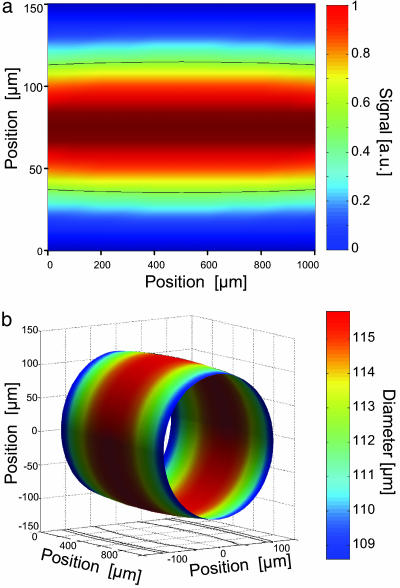
A two-dimensional image of an axon is depicted in Fig. 3a, showing a bulge of the axon. The data analysis implies a very precise knowledge of the field profile within the hole. The shape of the profiles only depends on the cross section surface of the axon, whereas absorption is independently related to the intra- and extracellular ionic concentrations and allows one to obtain the cross section of the axon. Then, the 3D images, referencing the 2D slices to the center of the neuron, show the thickness of the axon encountered by the terahertz beam. The reconstructed 3D image of an axon is displayed in Fig. 3b. The most important parameters here are the longitudinal and transverse diameters indicating the bulge of the axon. Therefore, the 3D reconstitution shows the potential of 3D analysis for complex geometries, such as axon branch points. Axonal cross section variation corresponding to volume change as low as 20 fl per μm can be detected, and precision on the ellipticity is better than 2%.
Fig. 3.
Imaging the neuron. (a) Two-dimensional image of an axon. The area scanned was 150 × 1,000 μm. The aperture diameter was 100 μm. Longitudinal and transverse spatial sizes were 50 μm and 10 μm, respectively. The acquisition time per point was 300 ms. The dotted line shows the half-maximum profile. (b) Deconvoluted 3D image of the axon using finite element method (FEM) simulations.
Influence of Toxin and Temperature on Neuron.
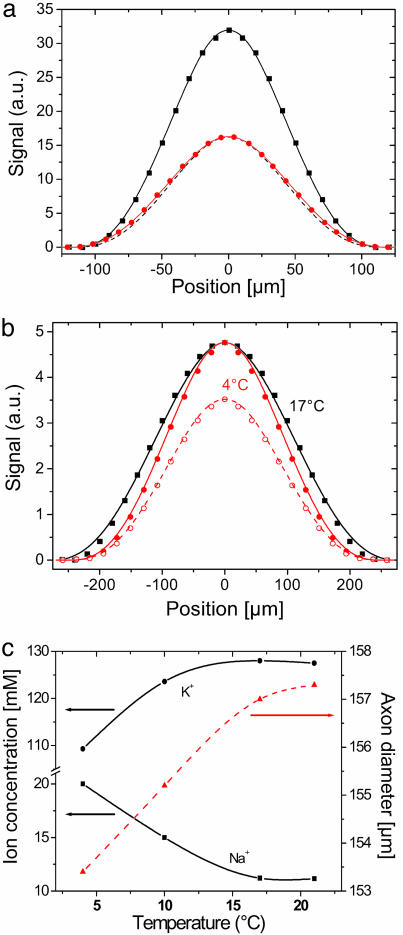
We studied the toxic effect of a sodium-channel activator, veratridine, known to increase membrane permeability to Na+ (16). An axon has been prepared and a reference scan has been taken with a 100-μm aperture diameter, which provides a spatial resolution adapted to the small size of the available axon, about two times smaller than the one used in the demonstration with varying [K+] in Fig. 2. The choice of the aperture size results from the simultaneous optimization of signal transmission and spatial resolution. Here, a 100-μm aperture diameter corresponds to the best compromise. In this experiment, after veratridine has been added to the extracellular physiological liquid up to a concentration of 5 μM, a second scan has been taken. Results obtained 2 h after introduction of veratridine are presented in Fig. 4a. The first observable effect of veratridine is to decrease by about half the amplitude of the signal with respect to reference. This signal decrease reveals the membrane depolarization that is the direct consequence of the veratridine-induced Na+ influx into the neuron. A careful analysis reveals that the shape of the neuron is weakly but noticeably modified, involving associated transmembrane water fluxes. Initial axon diameter is found to be 70 μm, and the increase diameter ratio is 1.112 ± 0.001. The precision of the relative diameter changes is due to the high sensitivity of the recorded signal profiles with respect to the relative diameter variations. The precision is given by the maximum deviation of data from numerical fit and is much smaller than the near-field aperture size thanks to the experimental high signal-to-noise ratio. The diameter increase leads to a final axon diameter of 78 μm. Diameter increase corresponds to a water influx of 0.91 ± 0.01 pl per μm of axon length. In a second set of experiments, we studied the effect of temperature. Low temperature is known to reversibly decrease the activity of the Na/K ATP-dependent exchanger leading to opposite variation in intraaxonal K+ and Na+ concentrations (17). An axon sample in physiological solution has been thermalized at 4°C during 12 h and rewarmed to 17°C. Then, the axon profile (200-μm aperture diameter) versus temperature has been recorded over a period of 30 min, as presented in Fig. 4b. We observe an increase of the relative absorption of terahertz radiation by the axon with respect to the temperature increase (Fig. 4). Axon diameter, [K+]i, and [Na+]i are also extracted in Fig. 4c. The initial diameter of the axon is 153 μm. The diameter increase ratio is 1.025 ± 0.001, associated with an influx of K+ and an efflux of Na+. The overall water input is 0.93 ± 0.01 pl/μm of axon length. An estimate of the impact of water swelling on the axon conductivity properties can be inferred from the previous measurements. First, it modifies the action potential velocity and time course. According to calculation by Debanne et al. (18), a 10% increase in axon diameter leads to a signal velocity increases by 10% and a decrease of delay by 10%. Second, it strongly influences axonal propagation through branches, as given by the geometrical ratio at branch points. Considering a mother axon branch dividing into two identical daughter branches, a 10% increase of the mother axon diameter leads to a change of geometrical ratio of >25%, which gives propagation delays mismatch as well as imperfect signal transmission. Furthermore, the physical origin of the contrast in the increasingly popular diffusion weighted imaging technique is still actively discussed (19, 20). In diffusion weighted imaging, measurement of apparent diffusion coefficient of water plays a major role in brain activity signature. Measuring water influx is then a key element for the understanding and calibrating of diffusion-weighted imaging. Modelization of nerve membranes emphasizes the dependence of apparent diffusion coefficient with respect to the geometrical dimensions of the axon, proportional to the surface-to-volume ratio (21).
Fig. 4.
Effect of axonal Na loading. (a) Effect of Na-channel activator. Scans of neuron bathed in physiological solution before (black squares) and 2 h after (red circles) veratridine (5 μM) addition. The change in neuron profile due to veratridine is emphasize by the dotted line, which is proportional to the reference scan. The axon diameter increase ratio was 1.112 ± 0.001 (from 70 to 78 μm) and corresponds to an influx of 0.91 ± 0.01 pl/μm neuron. The aperture diameter was 100 μm, and the spatial stepping size was 10 μm. Fits (solid lines) are from FEM simulations. (b) Effect of temperature change. Axon profiles data recorded at 4°C (red circles) and 17°C (black squares). To visualize the profile change due to diameter increase when temperature rises, original data at 4°C (open circles) were also normalized (filled circles). Here, the aperture diameter was 200 μm, because the axon diameter was larger than the one in a, and the spatial stepping size was 20 μm. Line-fits were obtained from FEM simulations. (c) Axon diameter, and [K+]i and [Na+]i concentrations versus temperature, extracted from neuron profiles. The relative axon diameter increase was 1.025 ± 0.001 (from 153 to 157 μm), simultaneously with an influx of potassium and efflux of sodium. The overall water influx was 0.93 ± 0.01 pl/μm.
Conclusions
In conclusion, this work demonstrates that terahertz near-field microscopy allows functional imaging of excitable living cells and reveals that axonal Na accumulation is associated with water exchange between intraaxonal and extracellular compartments. Variations as small as 10 μM of ion concentration and 20 fl of water volume have been successfully detected by using a noninvasive, nonperturbative technique.
Materials and Methods
Terahertz Near-Field Imaging.
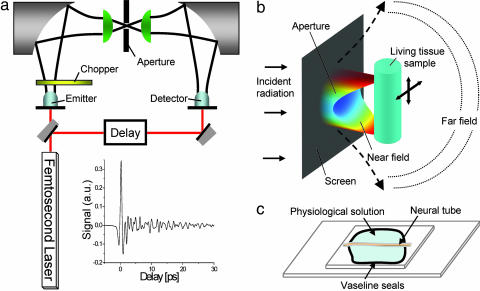
In our experiment, we generated and coherently detected broadband polarized single cycle pulses of terahertz radiation by illuminating photoconductive antennas with two synchronized femtosecond laser pulses (22, 23), as illustrated in Fig. 5a. The incident THz beam was modulated by a chopper, and a lock-in amplifier detected the current induced by the transmitted terahertz radiation in the detector. Near-field microscopy with aperture (24–26) was performed by focusing the terahertz radiation with a hyper-hemispherical Teflon lens onto a subwavelength-diameter hole and provided a high-precision, background-free signal (Fig. 5b). Moving the sample closely to the aperture, one can generate an image at a resolution only dependent on the aperture size (25). The hole in the metallic screen breaks the wave and re-emits a polarized terahertz pulse with much higher spatial frequency. Furthermore, the electric field has a highly anisotropic spatial profile that is the cause of the higher spatial frequency. The size of the hole results from a compromise between spatial resolution, proportional to the cube of the diameter, and radiation transmission (27). The axon was positioned closely behind the subwavelength hole, and the transmitted terahertz radiation was focused by another hemispherical lens to the photoconductive detector. During imaging, the delay between the two femtosecond pulses remained constant, the amplitude of the transmitted terahertz beam was recorded, and the position of the axon was controlled by a three-axis micrometric displacement stage. Under near-field condition, a signal-to-noise ratio of 103 was obtained during 10-s acquisition time.
Fig. 5.
Setup. (a) Terahertz generation and detection with photoconductive antenna. A femtosecond pulse generates terahertz pulses, which propagate through free space, and which is detected in amplitude by the detector antenna. A chopper and lock-in device allows one to record the amplitude of the electric field, as shown in the Inset. (b) Setup for near-field microscopy with aperture. Terahertz radiation was focused onto a sub-wavelength hole by a hyper-hemispherical Teflon lens. The living tissue sample was put behind the hole, and the transmitted terahertz pulse was focused by another hemispherical lens to the photoconductive detector. Near-field distribution shows highly anisotropic electric field spatial profile at the output of the hole, computed by 3D FEM. (c) The central neural tube of L. terrestris worm was glued on a 200-μm-thick glass microscope plate (microcover glass 24 × 50 mm; Erie Scientific, Portsmouth, NH), by Vaseline seals (100 μm), bathed in a physiological solution, and covered by a second 18 × 18-mm microcover plater. Constant sample thickness was obtained by a calibrated intercalary. The composition of the physiological solution was 110.5 mM NaCl, 2.5 mM KCl, 2 mM CaCl2, and 10 mM Hepes (NaOH) buffer (pH 7.35).
Terahertz time-domain spectroscopy (12, 28, 29) is a well established terahertz technique, using the same polarized single-cycle pulses of terahertz radiation used for near-field imaging. The input single cycle pulse is sent through the sample containing the ions to be measured, and the propagated electric field is recorded in time. The sample was double deionized water with precise control of added quantities of KCl, NaCl, or CaCl2. A reference scan was also recorded with the sample containing only water. Fourier transform directly provided the complex amplitude spectrum of the fields. Consequently, the ratio of the amplitude modules of the propagated and reference spectra gave direct access to the terahertz absorption of the sample. The 100-μm-thick liquid sample was contained in a polyethylene cell with 5-mm-thick walls, to ovoid multiple reflection and Fabry–Perot effects during the scans. Spectral resolution of 10 GHz was achieved with scan duration of 50 ps, with signal-to-noise ratio of 103. For each ion, several samples with different millimolar concentrations were used, exhibiting linear behavior of the resulting absorption, and providing the ion molar absorption coefficient over the 0.1–2 THz range.
Biological Sample.
We chose the axon of the neural tube dissected from earth worms Lumbricus terrestris (30) (Fig. 5c). This axon (from 50 to 150 μm in diameter) remains alive for >10 h after dissection. Axons were glued on a 200-μm-thick glass microscope plate by means of Vaseline (petroleum jelly) seals (100-μm diameter), bathed in physiological solution, and covered by a second microcover plate.
Numerical Simulations and Geometry Deconvolution.
Interpretation of the ionic contrast terahertz near-field imaging measurements requires the calculation of the propagation of the electromagnetic fields exiting the subwavelength hole through the neuron. The procedure was divided into two separate steps. First, we calculated the repartition of the complex electric field on the subwavelength hole alone (diameter d), by performing a direct resolution of Maxwell's equations through a full 3D ab initio FEM analysis (femlab v.3.1; COMSOL, Burlington, MA). The simulation takes into account the finite metal conductivity as well as the depth of the metallic sheet and the surrounding cover plate. With the appropriate meshing conditions, we obtained the electric field with a spatial resolution of <50 nm. Second, we propagate the calculated electric field through the biological sample using Green function formalism (31). Indeed, 3D numerical simulations demonstrated that the influence of the presence of the neuron near the hole can be neglected under our experimental conditions. More precisely, we modeled the neuron in the simulation box as an infinitely thin membrane tube separating two differently absorbing media. We found that the change in the electric field on the subwavelength aperture remained below 1% when the hole–neuron distance was larger than 30 μm. In our experiment, the distance always remained above 100 μm, due to the presence of the cover plate. In these conditions, one can assume that the previously calculated electric field, namely E0, is not perturbed by the neuron. The resulting electric field E′ after the neuron was given by
 |
where xn is the position of the neuron, a and b are the transverse and longitudinal neuron diameters, and G(a, b, X, Y, Z) is the Green function, which is the sum of the Green function eikrn1/r related to the homogeneous surrounding liquid and the one inside the neuron eikrn2/r. The Green function was discretized over the spatial grid and propagated. The signal S(xn) measured in our experiment was then obtained by integrating E′ (x, y). It follows
 |
We can now compare the calculated profile S(xn) with experimental data with a least-squares fitting procedure and then extract the neuron parameters a and b. It should be emphasized than the two neuron diameters can be independently obtained. The transverse diameter a was only determined by the shape of the measured profile and was independent on the absorption parameters encountered during the propagation. On the contrary, the longitudinal diameter required taking into account the amplitude of the profile and then the absorption. The precision on the determination of a and b in our experiment was better than 10−2. However, the precision on the relative variations of a increased by an order of magnitude, due to the number of points taken into account to extract the data and the insensitivity with respect to absolute absorption. Precision on the ellipticity was therefore of ≈2%. All of the fits shown in Figs. 2 and 4 were obtained by using such a procedure. We can notice the quality of the agreement between data and fits, responsible for the high precision in the determination of the neuron geometry. The robustness of this technique needs now to be discussed. First, we used FEM frequency domain simulations, whereas the recorded signals are in the time domain. This was justified by the proportionality between the absorption spectra of the main ions involved in this study (Na+ and K+), as shown in Fig. 1. Therefore, a single frequency analysis was a very good approximation. We demonstrated that the variation of the time delay of the pulse was negligible compared with amplitude (below 10−2), by comparing the time profiles of Na+ and K+ solutions. Geometrical drifts due to residual inhomogeneous sample thickness were controlled by the signal baselines. An important point related to the temperature was also been checked. We measured spectra of controlled Na+ and K+ solutions versus the temperature. Even though the fundamental properties of these liquids (density, refractive indices, absorption) are temperature-dependent, we did not observe measurable variations of spectra over the 4–20°C range. Variations were below our experimental precision.
Abbreviation
- FEM
finite element method
Footnotes
Conflict of interest statement: No conflicts declared.
This paper was submitted directly (Track II) to the PNAS office.
References
- 1.Mittleman D. in Sensing with Terahertz Radiation. Berlin: Springer; 2003. [Google Scholar]
- 2.Mittleman D. M., Jacobsen R. H., Nuss M. C. IEEE J. Quantum Electron. 1996;2:679–692. [Google Scholar]
- 3.Löffler T., Bauer T., Siebert K. J., Roskos H. G., Fitzgerald A., Czasch S. Opt. Exp. 2001;9:616–621. doi: 10.1364/oe.9.000616. [DOI] [PubMed] [Google Scholar]
- 4.Fitzgerald A. J., Berry E., Zinovev N. N., Walker G. C., Smith M. A., Chamberlain M. A. Phys. Med. Biol. 2002;47:R67–R84. doi: 10.1088/0031-9155/47/7/201. [DOI] [PubMed] [Google Scholar]
- 5.Woodward R. M., Cole B. E., Wallace V. P., Pye R. J., Arnone D. D., Linfield E. H., Pepper M. Phys. Med. Biol. 2002;47:3853–3863. doi: 10.1088/0031-9155/47/21/325. [DOI] [PubMed] [Google Scholar]
- 6.Crawley D., Longbottom C., Wallace V. P., Cole B. E., Arnone D. D., Pepper M. J. Biomed. Opt. 2003;8:303–307. doi: 10.1117/1.1559059. [DOI] [PubMed] [Google Scholar]
- 7.Wang K., Mittleman D. M. Nature. 2004;432:376–379. doi: 10.1038/nature03040. [DOI] [PubMed] [Google Scholar]
- 8.Jeon T.-I., Grischkowsky D. Appl. Phys. Lett. 2004;85:6092–6094. [Google Scholar]
- 9.Alberts B., Johnson A., Lewis J., Raff M., Roberts K., Walter P. Molecular Biology of the Cell. New York: Garland Science; 2002. [Google Scholar]
- 10.Hamil O. P., Marty A., Neher E., Sakmann B., Sigworth F. J. Pflügers Arch. 1981;391:85–100. doi: 10.1007/BF00656997. [DOI] [PubMed] [Google Scholar]
- 11.Dai J., Sheetz M. P., Wan X., Morris C. E. J. Neurosci. 1998;18:6681–6692. doi: 10.1523/JNEUROSCI.18-17-06681.1998. [DOI] [PMC free article] [PubMed] [Google Scholar]
- 12.Asaki M. L. T., Redondo A., Zawodzinski T. A., Taylor A. J. J. Chem. Phys. 2002;116:8469–8482. [Google Scholar]
- 13.Ronne C., Astrand P.-O., Keiding S. R. Phys. Rev. Lett. 1999;82:2888–2891. [Google Scholar]
- 14.Debye P. Polar Molecules. New York: Dover; 1929. [Google Scholar]
- 15.Max J.-J., Chapados C. J. Chem. Phys. 2001;115:2664–2675. [Google Scholar]
- 16.Balerma M., Fosset M., Chicheportiche R., Romey G., Lazdunski M. Biochemistry. 1975;14:5500–5511. doi: 10.1021/bi00696a019. [DOI] [PubMed] [Google Scholar]
- 17.Marmor M. F. Prog. Neurobiol. 1975;5:167–195. doi: 10.1016/0301-0082(75)90018-0. [DOI] [PubMed] [Google Scholar]
- 18.Debanne D. Nat. Rev. Neurosci. 2004;5:304–316. doi: 10.1038/nrn1397. [DOI] [PubMed] [Google Scholar]
- 19.Darquié A., Poline J.-B., Poupon C., Saint-Jalmes H., Bihan D. L. Proc. Natl. Acad. Sci. USA. 2001;98:9391–9395. doi: 10.1073/pnas.151125698. [DOI] [PMC free article] [PubMed] [Google Scholar]
- 20.Bihan D. L. Nat. Rev. Neurosci. 2003;4:469–480. doi: 10.1038/nrn1119. [DOI] [PubMed] [Google Scholar]
- 21.Latour L. L., Svoboda K., Mitra P. P., Sotak C. H. Proc. Natl. Acad. Sci. USA. 1994;91:1229–1233. doi: 10.1073/pnas.91.4.1229. [DOI] [PMC free article] [PubMed] [Google Scholar]
- 22.Auston D. H., Nuss M. C. IEEE J. Quantum Electron. 1988;24:184–197. [Google Scholar]
- 23.Fattinger C., Grischkowsky D. Appl. Phys. Lett. 1989;54:490–492. doi: 10.1103/PhysRevLett.62.2961. [DOI] [PubMed] [Google Scholar]
- 24.Betzig E., Trautman J. K. Science. 1992;257:189–195. doi: 10.1126/science.257.5067.189. [DOI] [PubMed] [Google Scholar]
- 25.Pool R. Science. 1988;241:25–26. doi: 10.1126/science.3388017. [DOI] [PubMed] [Google Scholar]
- 26.Hunsche S., Koch M., Brener I., Nuss M. Opt. Commun. 1998;150:22–26. [Google Scholar]
- 27.Ohtsu M., Kobayashi K. Optical Near Fields. Berlin: Springer; 2004. [Google Scholar]
- 28.Grischkowsky D., Keiding S. R., van Exter M., Fattinger C. J. Opt. Soc. Am. B. 1990;7:2006–2015. [Google Scholar]
- 29.Gallot G., Zhang J., McGowan R. W., Jeon T.-I., Grischkowsky D. Appl. Phys. Lett. 1999;74:3450–3452. [Google Scholar]
- 30.Moon A., Smith T. Soil Biol. Biochem. 2005;37:1211–1213. [Google Scholar]
- 31.Born M., Wolf E. Principles of Optics. 6th Ed. Cambridge, U.K.: Cambridge Univ. Press; 1997. [Google Scholar]


