

Abstract
R-loops form at Sγ3 and Sγ2b Ig class switch regions in the chromosomes of stimulated murine primary B cells and are suspected to be a general feature of mammalian class switch regions. The in vivo upstream boundary of the R-loops is known to begin within the switch repeats. To determine how precisely the R-loop structure conforms to the repetitive zone of the murine Sγ3 and Sγ2b switch regions, a chemical probing method was used to obtain structural information on the downstream boundary. We find that only 61–67% of the R-loops terminate within the Sγ3 and the Sγ2b repetitive zones, and the remainder terminate downstream, usually within the first 600 bp immediately downstream of the core switch repeats. Interestingly, the nontemplate strand G density falls to the random level gradually through this same region. Hence, the R-loops terminate as the G-richness of the nascent RNA strand falls. This finding is consistent with thermodynamic predictions for RNA:DNA duplex strength relative to that of DNA:DNA duplexes. This result contrasts with the location of known recombination breakpoints, which correlate not with G-richness and R-loop location but rather with AGCT density. The implications of these findings are discussed in the context of models for the targeting of class switch recombination.
Keywords: affinity maturation, immunoglobulin, non-B DNA, RNA:DNA hybrid
Once a mammalian B cell is producing IgM Ig, it can undergo isotype switching to produce IgG, IgA, or IgE in a process that requires a DNA recombination event called class switch recombination (CSR) (1–3). Defects in CSR result in a hyperIgM syndrome, where patients are susceptible to infections because of low concentrations of serum IgG and IgA (4). The murine IgH constant region locus has eight different constant genes (4). Each constant gene, except Cδ, is 5′ flanked by a switch region. CSR takes place between two switch regions, leading to the deletion of the intervening DNA segment (5, 6). Mammalian switch regions vary substantially in primary sequence, but all have the following features: highly repetitive, G-rich on the nontemplate strand, and 1–12 kb in length. The switch repeats contain two short subrepeats: AGCT and GGGGT predominate in Sμ, Sα, and Sε. Sγ1, Sγ2a, Sγ2b, and Sγ3 include numerous AGCT sites and clusters of G's also (7). Most CSR breakpoints are identified in the switch regions; however, they are less frequently found within the several hundred base pairs upstream or downstream (7, 8).
Germ-line transcription is an important feature of CSR (1, 9). Upon antigen stimulation, cytokines stimulate the appropriate promoter in front of switch regions. The unspliced germ-line transcript consists of the noncoding I exon, S region, and the corresponding C exon. It does not encode protein and, hence, is called the sterile transcript. Without transcription, CSR is markedly reduced (10–12).
Several DNA structures have been proposed to form in the switch region. By computer modeling, a DNA stem-loop structure was suggested in Xenopus and mammalian switch regions (13, 14). Guanine quartets (G4) have been suggested because of the G-rich nature of the switch region (15–17). However, neither hypothesis has in vivo data to support it.
Upon transcription, an RNA:DNA hybrid forms in the switch region sequence in vitro (18–21). R-loops are found at the Sγ3 and Sγ2b regions in vivo in LPS-stimulated B cells (2). Upon antigen stimulation, germ-line transcription is activated in specific switch regions. The transcribed RNA pairs with the template strand DNA, leaving the nontemplate G-rich strand DNA single-stranded. The single-strandedness within R-loops or variants of them (such as collapsed R-loops) may enhance the efficiency of CSR relative to its efficiency in organisms that do not have R-loop-forming switch regions (22).
The upstream boundary of the R-loops (referred to as the 5′ boundary) was recently established in the initial description of in vivo switch region R-loops at Sγ3 and Sγ2b (23). From previous experiments, although R-loops are heterogeneous, 95% begin somewhere within the core repeats of the switch regions. The downstream boundary of the R-loops is of interest because it provides information on how quickly the RNA polymerase, RNA, and template interaction revert to normal after the switch sequences have been passed.
Here we find that, although 61–67% of the R-loops end within the switch region, most of the remaining ones end within the 600 bp downstream of the Sγ3 or the Sγ2b regions. The G-richness, which is a suspected predictor of R-loop formation (22), declines gradually over this same 600-bp region, providing an important correlation between R-loop structure and nontemplate strand G density. Interestingly, high AGCT density terminates abruptly within the boundaries of the core switch repeats, and this is where >90–95% of the recombination is known to occur in vivo at Sγ2b and Sγ3, respectively (7). Hence, R-loop formation tracks with the G-richness feature of switch regions, but switch region recombination points track with the AGCT density. These findings, as well as the frequency of R-loop formation, support a model in which mammalian switch regions have evolved two motifs: one for R-loop formation (G clusters) to provide the single-strandedness required by activation-induced cytidine deaminase (AID) and one for AID deamination within the non-B DNA portions of that R-loop (the AGCT sites).
Results
The Downstream Boundary of the R-Loops at Sγ3.
The sodium bisulfite method was used to obtain structural information on the 3′ boundary of Sγ3 R-loops (23). The bisulfite anion carries out a nucleophilic attack on the C5–6 bond of cytosine only when it is not protected by stacking, which occurs when it is single-stranded. Reactivity of all of the C's in a region indicates a stable zone of single-strandedness.
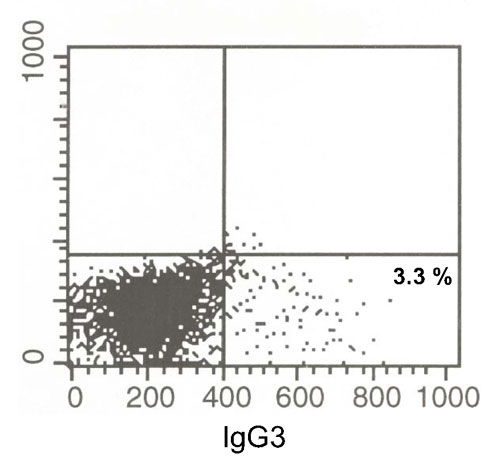
Only a small proportion of B cells undergo CSR at any given time. Approximately 3.3% of naïve murine B cells become IgG3+ cells after 4 days of LPS stimulation, and here we stimulated for only 2 days (Fig. 6, which is published as supporting information on the PNAS web site). To study the R-loop structure, an enrichment method was used to assess R-loop molecules after the bisulfite modification treatment. The strategy relies on one normal (native) primer and one “converted” primer (see Materials and Methods). Using this approach, any PCR products arise predominantly from R-loops rather than from duplex DNA. Based on the design of converted primers, the result can provide structural information specifically for the top strand or the bottom strand of Sγ3 or Sγ2b (23).
Here genomic DNA was extracted from LPS-stimulated B cells from the spleens of C57BL/6 mice. The entire murine Ig Sγ3 region is 1,801 bp, and the region between the switch region and the constant region is 2,080 bp. For PCR, one primer was the forward converted primer, and the other one was the native reverse primer. The converted primer, FTH13, was located 400 bp downstream of the start of the murine Ig Sγ3 and contained seven C's all converted to T's. This is a more strongly enriching converted primer than we have used previously (23). Because FTH13 is a converted primer, it only anneals to the form of the template strand that has the C to T conversions; and these C to T conversions are only in the template strand after the first round of PCR, when the nontemplate strand has been copied. The native primer, KY320, was 674 bp downstream of the end of the core repeats of the switch region.
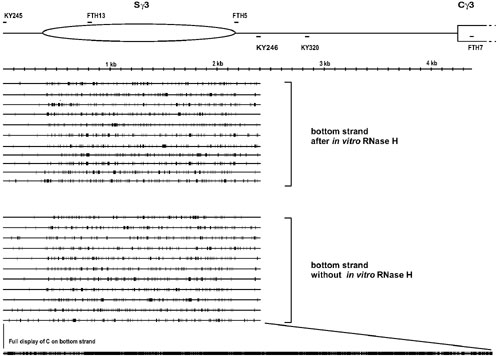
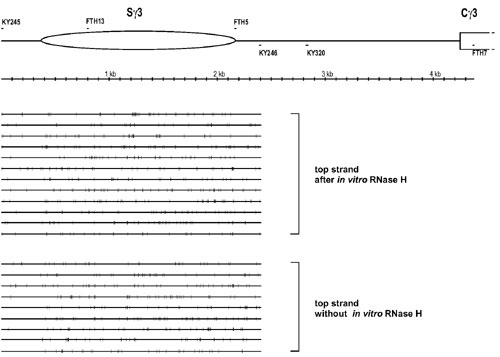
After 30 cycles of PCR, the 2,084-bp PCR product was obtained. A total of 34 clones were sequenced and found to represent distinct molecules. Eleven of 34 sequenced molecules showed sporadic conversion, where conversion had occurred at some or all of the primer site C's but at only occasional intermittent C's downstream of the primer. Twenty-three molecules revealed R-loop molecules that had long stretches of conversion (Fig. 1). Of these 23 molecules, 14 R-loop molecules had their end points within the switch region (the end points of the regions of bisulfite reactivity indicate the boundaries of the R-loops). Nine molecules had long stretches of conversion that extended outside of the switch region. Four of the nine molecules had long stretches of conversion that extended >600 bp downstream of the switch region (to the primer KY320 and indicated by an asterisk on the right side of the sequence line in Fig. 1A). The longest R-loop was 2,084 nt, which covered the entire length of the region analyzed. Interestingly, three R-loop molecules had gaps within these long stretches of conversion (Fig. 1A, indicated by “gap” on the right side of the sequence line).
Fig. 1.

Single-strandedness on the top strand of the murine Sγ3 region in stimulated B cells. (A) Top strand sequence without the RNase H treatment before the bisulfite treatment. Primary splenic B cells were stimulated in culture for 2 days with LPS. Genomic DNA was prepared and then treated with sodium bisulfite as described in Materials and Methods. A single round of PCR (30 cycles) was done by using one regular (native sequence) primer and one converted primer whose sequence is complementary to the top strand where the C's have been converted to U's. FTH13, the converted primer containing seven C's converted to seven T's, is located 400 bp downstream of the beginning of the murine Ig Sγ3 region. KY320, the native primer, is located 674 bp downstream of the end of the Sγ3 region. Each long line represents an independent molecular clone. The small vertical bar on each line indicates a C on the sequence converted to a T. The asterisk indicates that the region of conversion extends to the KY320 site. The word “gap” indicates that the clone has gaps in the long stretches of C to T conversion. (The gaps have more than two consecutive unconverted C's). In the diagram at the top, the long ellipse represents the Sγ3 region, which is 1,801 bp long. The region between the Sγ3 and the Cγ3 (constant region of the Igγ3) is 2,080 bp. (B) Top strand sequence with RNase H treatment before bisulfite treatment. The experiment was done as in A, except that an RNase H incubation was done before bisulfite treatment. The bottom line displays every C residue on the top strand of the PCR product.
The bottom strand from the same genomic DNA samples showed only sporadic conversion (Fig. 7, which is published as supporting information on the PNAS web site). Analysis of top strands generated by using only native primers also showed only sporadic conversion (Fig. 8, which is published as supporting information on the PNAS web site).
To further investigate the ends of R-loops, a more downstream primer set, FTH5 paired with FTH7, was used to define the 3′ boundary of R-loops (Fig. 2). The converted forward primer, FTH5, was located at the border of the repetitive zone of the switch region and contained 7 C's converted to T's. The native reverse primer, FTH7, was 130 bp downstream of the start of the constant region of the Sγ3. After two rounds of 30 cycles of PCR, the 2.2-kb PCR product was cloned, and 50 clones were sequenced. Seven molecules showed only sporadic conversion, whereas 43 clones revealed long regions of conversion consistent with an R-loop conformation (Fig. 2). Forty of these 43 molecules had 3′ boundaries located within 600 bp downstream of the end of the switch region. Two molecules ended only slightly further downstream, passing the position of primer KY320. The conversion region for one of the 43 molecules was 1,696 nt long, ending immediately before a 100-bp region composed entirely of A's and G's and 390–488 bp upstream of the constant region. No R-loop molecules had long stretches of conversion that extended into the constant region or near it. To confirm these results, another PCR primer set was designed to see whether R-loops existed in the constant region. The converted reverse primer, FTH16, primes in the constant region and contains eight G's all converted to A's (see Materials and Methods), which has more enrichment potential than other primers that we have used (the partner primer for this PCR is FTH5). After two rounds of 30 cycles of PCR, no PCR product was obtained. Therefore, no R-loops were detectable in the constant region even with primers with extremely high enrichment potential.
Fig. 2.

Single-strandedness on the top strand immediately downstream of murine Sγ3 in stimulated B cells. Two primers were used in an initial round of PCR (30 cycles) and yielded a faint band. To generate more DNA for cloning, this band was cut out and amplified with the same primers with an additional round of 30 cycles. FTH5, the converted primer containing seven C's converted to seven T's, is located immediately within the downstream edge of the murine Ig Sγ3 region. FTH7, a native primer, is located 130 bp downstream of the beginning of the first Cγ3 exon. Each long line represents an independent molecular clone. The small vertical bar on each line indicates a C on the sequence converted to T. The most bottom line displays every C residue on the top strand of the PCR product.
Structure of the Sγ3 R-Loops After in Vitro RNase H Treatment.
To confirm that the above molecules contained actual R-loops, the same genomic DNA was treated with Escherichia coli RNase H1 before treatment with bisulfite. RNase H only digests RNA that is annealed with DNA. The genomic DNA was treated in vitro with 3 units of E. coli RNase H1 for 16 h. It is difficult to calculate the fold excess of RNase H because the reaction contains an unknown amount of RNA:DNA hybrid in the total genome (24) and because some of the E. coli RNase H1 may be bound nonproductively by the vast excess of genomic DNA. After one round of 30 PCR cycles using the converted primer FTH13 and the native primer KY320, the 2,084-bp product was still obtained, although the yield was slightly lower than for genomic DNA without in vitro RNase H treatment (Fig. 1B). Twenty-two clones were sequenced. Five of the 22 sequenced molecules showed sporadic conversion on the top strand. The remaining 17 molecules indicated long stretches of single-strandedness on the top strand, consistent with R-loops. Interestingly, none of these extended outside of the Sγ3 region, which contrasts with the analysis without RNase H, where 39% of the molecules extended downstream of Sγ3. In addition, 8 of the 17 molecules had gaps in the long stretches of conversion, which is a higher frequency of gaps than when no RNase H is used (Table 1, which is published as supporting information on the PNAS web site). These features indicate that this initial RNase H incubation partially digested the R-loops.
We wanted to more stringently test whether the R-loops downstream of the core Sγ3 repeats had been destroyed by RNase H. The primer set, FTH5 paired with FTH7, was used in a PCR analysis of the RNase H-treated material just described. No PCR product was obtained, even after three rounds of PCR (30 cycles each round), indicating that no R-loops were detectable downstream of the Sγ3 region, after one incubation with RNase H. This finding is consistent with the possibility that the portion of the R-loop immediately downstream of Sγ3 is more readily destroyed than the portion of the R-loop within the Sγ3 region.
Next the genomic DNA was treated with a second incubation of 3 units of E. coli RNase H1 for 16 h. By using the FTH13 converted primer within the switch region and the native primer downstream (KY320), no PCR product could be amplified any longer. (Amplification of the DNA template using native primers was quantitatively stable throughout these incubations, indicating that the DNA was not affected.) Hence, the portion of the R-loop downstream of the Sγ3 can be destroyed in the first incubation with RNase H, but the portion within the Sγ3 requires a second incubation. These findings suggest that long in vivo R-loops are less optimal substrates than pure RNA:DNA duplexes and that the R-loops within the repetitive core region of Sγ3 are somewhat more resistant than the portion of the R-loop downstream of the core repeat region.
Downstream Boundaries of R-Loops at Sγ2b.
We were interested in determining the nature of the downstream R-loop boundary at a second switch region, Sγ2b (Fig. 9, which is published as supporting information on the PNAS web site). The entire murine Sγ2b is 3.8 kb, and the distance between the Sγ2b and Cγ2b is 1,837 bp. To find the downstream boundary of R-loops at murine Sγ2b, the same enrichment strategy was used to detect the R-loops. The converted primer, FTH71, containing five C's all converted to T's, is positioned 400 bp upstream of the end of Sγ2b. Two native reverse primers, FTH73 and FTH88, were chosen at 100 and 800 bp downstream of the end of Sγ2b. The converted primer and one of the native primers were used in the PCR with the same stimulated B cell genomic DNA as in the study of Sγ3.
When the FTH71-FTH73 set was used, 16 independent molecules were identified based on sequencing (Fig. 3). Five molecules had long stretches of conversion. Of those, one had a long stretch of conversion to FTH73. In the FTH71–FTH88 set, 18 independent molecules were identified based on sequencing. Four molecules had long stretches of conversion. Of those, one molecule had long stretches of conversion to the FTH88 position. Hence, the majority of R-loops at Sγ2b terminate within the switch repeats, and the others terminate downstream.
Fig. 3.

Single-strandedness on the top strand within and downstream of the Sγ2b switch region in stimulated B cells. (A) The experiment was done as in Fig. 1A. In the diagram at the top, the half ellipse represents the downstream part of Sγ2b region. The region between the Sγ2b and the Cγ2b (constant region of the Igγ2b) is 1,837 bp. FTH71, a converted primer, is located 400 bp upstream of the end of Sg2b. FTH73 is a native primer that is located 100 bp downstream of Sγ2b. (B) The same DNA as in A was analyzed by using a different downstream native primer. FTH88, a native primer, is located 800 bp downstream of Sγ2b. The bottom line displays every C residue on the top strand of the PCR product. RNase H destroyed most of the R-loops.
Frequency of R-Loop Formation at Switch Regions in Stimulated Splenic B Cells.
Use of a converted primer on one side to detect R-loops makes it impossible to quantitate their absolute frequency because it enriches for the R-loop molecules at the expense of the non-R-loop molecules. We developed a method that now permits us to determine the frequency of the R-loops in genomic DNA from primary B cells. Murine splenic B cells are stimulated for 2 days, and genomic DNA is harvested and subjected to bisulfite treatment (see Materials and Methods). We then use two native primers, one on each side of the switch region, to amplify the entire switch region. These PCR products are ligated into a vector and transformed into E. coli. Colony-lift hybridization is done by using a converted oligonucleotide probe that anneals to any bisulfite-reacted form of the top strand in any R-loops (Fig. 10, which is published as supporting information on the PNAS web site). This method provides a minimal estimate of the actual frequency of R-loop formation because only R-loops located at the site of the converted oligonucleotide probe will be detected. R-loops at other locations in the same switch region will be overlooked. Nevertheless, this method provides an unbiased minimal assessment of the actual R-loop frequency. Any clones that are detected are confirmed by sequencing. Using this method, we have determined that that the minimum frequency of R-loops at Sγ3 is 1 per 570 alleles in splenic B cells at day 2 of stimulation. This determination is based on detection of three R-loops of length 1.4–2 kb among 1,700 alleles examined.
Discussion
R-Loop End Points Correlate with G-Richness.
In previous work we showed that the R-loops at Sγ3 and Sγ2b begin either near the first repeat or somewhere within the switch region (23). We initiated the current study to determine how quickly the RNA polymerase, RNA, and template interactions revert to normal after the core switch repeats have been passed at the downstream boundaries of the Sγ3 and Sγ2b switch regions. Although 61–67% of the R-loops terminate within the core Sγ3 and Sγ2b switch repeat regions, the others typically terminate within the 600 bp immediately downstream of the core switch repeats (Table 2, which is published as supporting information on the PNAS web site). This observation is interesting when it is compared with the profile of G-richness across the Sγ3 and Sγ2b regions and downstream toward the first constant exons (Figs. 4 and 5). The G-richness drops to the random sequence level only gradually over the 600 bp downstream of Sγ3 and Sγ2b. The propensity for R-loop formation is thought to be based on the G-richness of the nontemplate strand for reasons that are discussed below. Our observation that the R-loops persist in the first few hundred base pairs downstream of the switch region is probably related to this elevated G-richness.
Fig. 4.

Plots of the downstream edge of the R-loops, the G density, and the AGCT locations for murine Sγ3 through the initial portion of the first constant exon. (A) The relative position of the 482-bp Iγ3 exon, the 805-bp Iγ3–Sg3 intervening region, the 1,801-bp Sγ3, the 2,080-bp Sγ3–Cγ3 intervening region, and the first 1,801 bp of the Cγ3 region (exon/intron boundaries not specified) are shown. R-loop downstream boundaries based on Figs. 1 and 2 are shown as dots above or below the line, respectively. (B) The AGCT plot of the sequence in A. The short vertical bars on the plot indicate the AGCT sites. (C) The G density plot of the sequence in A.
Fig. 5.

Plots of the downstream edge of the R-loops, the G density, and the AGCT locations for murine Sγ2b through the initial portion of the first constant exon. (A) The relative position of the 3,807-bp Sγ2b, the 1,837-bp Sγ2b–Cγ2b intervening region, the 356-bp Ig2b–Sγ2b intervening region, the 400-bp Iγ2b exon, and 3,807 bp of the Cγ2b constant exons/introns (boundaries not shown). R-loop downstream boundaries based on Fig. 3 are shown as dots above (from Fig. 3A) or below (from Fig. 3B) the line, respectively. (B) The AGCT plot of the sequence in A. The short vertical bars on the plot indicate the AGCT sites. (C) The G density plot of the sequence in A.
The Class Switch Breakpoints Correlate with AGCT Density Rather than WRC Density.
Of 23 breakpoints at Sγ3 in murine B cells, all were within the core switch repeats (7). However, at Sγ2b, two (of 29) breakpoints in murine B cells were identified 150 bp and 600 bp downstream of the core repeats (7). In addition, recombination breakpoints are found in the 5′ and 3′ flanking regions of the Sμ core repeats (8). One possible explanation for the paucity of CSR breakpoints downstream could have been that the density of WRC (W, A or C; R, A or G) sites (on the bottom strand) is much lower in the region downstream of the switch region. However, upon examination, the region downstream of the Sγ3 switch region is not significantly reduced in WRC motifs (Table 3, which is published as supporting information on the PNAS web site). In contrast, we find that the AGCT density does correlate with the location of the downstream edge of the CSR breakpoints (Fig. 4). AGCT is a palindromic form of the WRC motif, and AGCT is a distinct motif in CSR sequences of all vertebrates that use CSR. The AGCT motif may be particularly important in achieving symmetrical action by activation-induced cytidine deaminase (AID) to generate double-strand breaks, as we have pointed out previously (25). In contrast, somatic hypermutation does not require a palindromic form of the WRC motif (22, 25). This difference between AGCT sites, which are palindromic and permit action by AID on both strands at the same position, and nonpalindromic WRC sites, which permit action on only one strand, may be fundamental to the difference between CSR and SHM. The sharp decrease in AGCT at the end of the repetitive zone of the switch region may account for the paucity of CSR sites downstream of the core repeat of the Sγ3 switch region, and similarly for Sγ2b.
The Iγ3–Sγ3 and the Iγ2b–Sγ2b intervening regions are somewhat reduced for AGCT density, but not as reduced as the intervening regions between the switch regions and the constant regions. The G density is also considerably reduced upstream of the core switch repeats, but not as reduced as the constant regions. The R-loops begin at or around the beginning of the core repeats (23). Therefore, the onset of the R-loops requires the high level of G density intrinsic to the core switch repeats. The lack of recombination events upstream of these two switch regions is likely because of the lack of R-loops here. Additional factors, such as chromatin structure or more complex methods of CSR targeting, may also contribute both upstream and downstream of the core switch repeats.
Thermodynamic Basis for the Formation and Stability of R-Loops.
Why and how do the R-loops form at the switch regions, and why are they stable? The strength of RNA:DNA duplexes relative to the corresponding DNA:DNA duplexes can be calculated (26). RNA:DNA duplexes are always more stable (Fig. 11, which is published as supporting information on the PNAS web site). The basis for this finding is not certain but may be for several reasons. First, the RNA:DNA duplex is thought to adopt a configuration that is closer to A-form DNA than B-form DNA. The A-form has a 3′ endo pucker of the sugar ring in contrast to the 2′ endo pucker in B-form DNA, and this phenomenon contributes to increased stacking. Second, the RNA strand can form an extra hydrogen bond between the 2′OH of the sugar at nucleotide i and the O4′ of the sugar at the nucleotide at position i + 1. R-loops with a G-rich RNA, and hence a G-rich nontemplate DNA strand, are by calculation particularly stable (Fig. 11). These features explain why the R-loop forms, but they do not explain how it forms.
The R-loops could conceivably form by either of two mechanisms. One possibility is an extended RNA:DNA hybrid as is seen on single-stranded DNA templates. In this model, the RNA, because of its G-richness and nearly A-form structure, might not pass through the exit pore of the RNA polymerase (27, 28) but would remain annealed with the template DNA. In the second model, the RNA would pass out of the exit pore and then compete with the nontemplate DNA strand for annealing to the template DNA strand upstream of the RNA polymerase (29). There is no definitive evidence for or against either of these potential mechanisms.
Frequency of R-Loops at Switch Regions in Stimulated B Cells.
We have been able to document chromosomal R-loops using normal PCR primers, and this documentation permits determination of the actual frequency of the R-loops among alleles within stimulated B cells. This documentation had not been possible previously using pairs of primers in which one of the primers was converted. The frequency of one R-loop per 570 alleles at Sγ3 after 2 days of stimulation compares to actual isotype switch (and surface positive for IgG3) of 3.3% of murine B cells after 4 days of LPS stimulation. We stimulate for only 2 days in the study here, and the probes for the R-loops cover only a fraction of the Sγ3 switch region. In addition, the R-loop is likely to be present for only a small fraction of the time of stimulation and during only a fraction of the cell cycle. Hence, this minimal estimate is well within a range that corresponds to switching to Sγ3.
Materials and Methods
See Supporting Text, which is published as supporting information on the PNAS web site, for more details about enzymes and reagents, purification and culture of mouse B cells, extraction and purification of genomic DNA, bisulfate modification assay, and oligonucleotides.
Calculating the Thermodynamic Stability.
Predicted nucleic acid hybridization thermodynamics was calculated by the hyther program. The program provides the calculation for four forms of nucleic acid: DNA duplex, RNA/DNA, DNA/RNA, and RNA/RNA. The hybridization conditions were based on 0.14 M NaCl, 0.002 M MgCl2, and 37°C, mimicking the physiological condition.
Determination of the Frequency of R-Loops.
In the first phase of the method, the top strands of R-loops were primer-extended (Fig. 10). For this, the biotin-tagged native primer (KY484) was used in the primer extension of stimulated B cell genomic DNA that had already been treated with bisulfite. The biotin-primer extension product was purified by using streptavidin magnetic beads (Sigma). The purified primer extension products were used as templates in the PCR with two native primers, KY505 and KY246. The PCR was carried out for 30 cycles and resolved on an agarose gel, and the correct-sized fragments were recovered by using a Gene Clean Kit (BIO101). Purified PCR products were cloned by using the TOPO-TA cloning kit (Invitrogen). Each clone was picked and restreaked as a line on the surface of a new ampicillin agar plate. Each plate contained ≈110 different clones.
The second phase of the method involved colony lifts onto nylon membranes. The nylon membrane was pressed against the agar plate (110 clones) for 2 min. The membrane was then transferred to denaturing solution (0.5 M NaOH/1.5 M NaCl) for 15 min. The bacterial side was up. The membrane was then transferred to 1 M Tris (pH 7.5) for 15 min, followed by 1 M Tris, pH 7.5/1.5 M NaCl for 15 min, followed by a rinse with 2× SSC. Kimwipes were used to wipe the bacterial debris off of the surface of the membrane while it was under the 2× SSC. The DNA was then fixed on the membrane by UV crosslinking. The membrane was then rinsed with 2× SSC and put into a plastic hybridization bag.
In the third phase, the three converted primers, FTH99, FTH100, and FTH101, were individually 5′-labeled with polynucleotide kinase and then mixed to generate the probe for hybridization. The membrane was prehybridized at 66°C for 15 min. Three different oligonucleotide probes (5 pmol each) were 5′-labeled by using polynucleotide kinase and then added, and the membrane was hybridized at 66°C overnight. The membrane was washed with 2× SSC/0.5% SDS for 10 min twice and with 0.1× SSC/0.5% SDS for 10 min twice. The membrane was exposed overnight.
Supplementary Material
Acknowledgments
This work was supported by National Institutes of Health Grant GM56984 (to M.R.L.).
Abbreviation
- CSR
class switch recombination.
Footnotes
Conflict of interest statement: No conflicts declared.
This paper was submitted directly (Track II) to the PNAS office.
References
- 1.Chaudhuri J., Alt F. W. Nat. Rev. Immunol. 2004;4:541–552. doi: 10.1038/nri1395. [DOI] [PubMed] [Google Scholar]
- 2.Yu K., Lieber M. R. DNA Repair. 2003;2:1163–1174. doi: 10.1016/j.dnarep.2003.08.010. [DOI] [PubMed] [Google Scholar]
- 3.Janeway C. A., Travers P., Walport M., Shlomchik M. Immunobiology. New York: Garland; 2001. [Google Scholar]
- 4.Etzioni A., Ochs H. D. Pediatr. Res. 2004;56:519–525. doi: 10.1203/01.PDR.0000139318.65842.4A. [DOI] [PubMed] [Google Scholar]
- 5.Luby T. M., Schrader C. E., Stavnezer J., Selsing E. J. Exp. Med. 2001;193:159–168. doi: 10.1084/jem.193.2.159. [DOI] [PMC free article] [PubMed] [Google Scholar]
- 6.Stavnezer J., Amemiya C. T. Semin. Immunol. 2004;16:257–275. doi: 10.1016/j.smim.2004.08.005. [DOI] [PubMed] [Google Scholar]
- 7.Dunnick W. A., Hertz G. Z., Scappino L., Gritzmacher C. Nucleic Acids Res. 1993;21:365–372. doi: 10.1093/nar/21.3.365. [DOI] [PMC free article] [PubMed] [Google Scholar]
- 8.Lee C.-G., Kondo S., Honjo T. Curr. Biol. 1998;8:227–230. doi: 10.1016/s0960-9822(98)70087-9. [DOI] [PubMed] [Google Scholar]
- 9.Stavnezer J., Radcliff G., Lin Y.-C., Nietupski J., Berggren L., Sitia R., Severinson E. Proc. Natl. Acad. Sci. USA. 1988;85:7704–7708. doi: 10.1073/pnas.85.20.7704. [DOI] [PMC free article] [PubMed] [Google Scholar]
- 10.Coffman R. L., Lebman D. A., Rothman P. Adv. Immunol. 1993;54:229–270. doi: 10.1016/s0065-2776(08)60536-2. [DOI] [PubMed] [Google Scholar]
- 11.Xu L., Gorham B., Li S. C., Bottaro A., Alt F. W., Rothman P. Proc. Natl. Acad. Sci. USA. 1993;90:3705–3709. doi: 10.1073/pnas.90.8.3705. [DOI] [PMC free article] [PubMed] [Google Scholar]
- 12.Bottaro A., Lansford R., Xu L., Zhang J., Rothman P., Alt F. W. EMBO J. 1994;13:665–674. doi: 10.1002/j.1460-2075.1994.tb06305.x. [DOI] [PMC free article] [PubMed] [Google Scholar]
- 13.Tashiro J., Kinoshita K., Honjo T. Int. Immunol. 2001;13:495–505. doi: 10.1093/intimm/13.4.495. [DOI] [PubMed] [Google Scholar]
- 14.Mussmann R., Courtet M., Schwager J., Pasquier L. D. Eur. J. Immunol. 1997;27:2610–2619. doi: 10.1002/eji.1830271021. [DOI] [PubMed] [Google Scholar]
- 15.Sen D., Gilbert W. Nature. 1988;334:364–366. doi: 10.1038/334364a0. [DOI] [PubMed] [Google Scholar]
- 16.Dempsey L. A., Sun H., Hanakahi L. A., Maizels N. J. Biol. Chem. 1999;274:1066–1071. doi: 10.1074/jbc.274.2.1066. [DOI] [PubMed] [Google Scholar]
- 17.Duquette M. L., Handa P., Vincent J. A., Taylor A. F., Maizels N. Genes Dev. 2004;18:1618–1629. doi: 10.1101/gad.1200804. [DOI] [PMC free article] [PubMed] [Google Scholar]
- 18.Reaban M. E., Griffin J. A. Nature. 1990;348:342–344. doi: 10.1038/348342a0. [DOI] [PubMed] [Google Scholar]
- 19.Daniels G. A., Lieber M. R. Nucleic Acids Res. 1995;23:5006–5011. doi: 10.1093/nar/23.24.5006. [DOI] [PMC free article] [PubMed] [Google Scholar]
- 20.Shinkura R., Tian M., Khuong C., Chua K., Pinaud E., Alt F. W. Nat. Immunol. 2003;4:435–441. doi: 10.1038/ni918. [DOI] [PubMed] [Google Scholar]
- 21.Tian M., Alt F. W. J. Biol. Chem. 2000;275:24163–24172. doi: 10.1074/jbc.M003343200. [DOI] [PubMed] [Google Scholar]
- 22.Zarrin A. A., Alt F. W., Chaudhuri J., Stokes N., Kaushal D., DuPasquier L., Tian M. Nat. Immunol. 2004;5:1275–1281. doi: 10.1038/ni1137. [DOI] [PubMed] [Google Scholar]
- 23.Yu K., Chedin F., Hsieh C.-L., Wilson T. E., Lieber M. R. Nat. Immunol. 2003;4:442–451. doi: 10.1038/ni919. [DOI] [PubMed] [Google Scholar]
- 24.Li X., Manley J. L. Cell. 2005;122:365–378. doi: 10.1016/j.cell.2005.06.008. [DOI] [PubMed] [Google Scholar]
- 25.Yu K., Roy D., Bayramyan M., Haworth I. S., Lieber M. R. Mol. Cell. Biol. 2005;25:1730–1736. doi: 10.1128/MCB.25.5.1730-1736.2005. [DOI] [PMC free article] [PubMed] [Google Scholar]
- 26.SantaLucia J. Proc. Natl. Acad. Sci. USA. 1998;95:1460–1465. doi: 10.1073/pnas.95.4.1460. [DOI] [PMC free article] [PubMed] [Google Scholar]
- 27.Gopal V., Brieba L. G., Guajardo R., McAllister W. T., Sousa R. J. Mol. Biol. 1999;290:411–431. doi: 10.1006/jmbi.1999.2836. [DOI] [PubMed] [Google Scholar]
- 28.Westover K. D., Bushnell D. A., Kornberg R. D. Science. 2004;303:1014–1016. doi: 10.1126/science.1090839. [DOI] [PubMed] [Google Scholar]
- 29.Drolet M., Broccoli S., Rallu F., Hraiky C., Fortin C., Masse E., Baaklini I. Front. Biosci. 2003;8:d210–d221. doi: 10.2741/970. [DOI] [PubMed] [Google Scholar]
Associated Data
This section collects any data citations, data availability statements, or supplementary materials included in this article.