Abstract
Ecologists have long been puzzled by the fact that there are so many similar species in nature. Here we show that self-organized clusters of look-a-likes may emerge spontaneously from coevolution of competitors. The explanation is that there are two alternative ways to survive together: being sufficiently different or being sufficiently similar. Using a model based on classical competition theory, we demonstrate a tendency for evolutionary emergence of regularly spaced lumps of similar species along a niche axis. Indeed, such lumpy patterns are commonly observed in size distributions of organisms ranging from algae, zooplankton, and beetles to birds and mammals, and could not be well explained by earlier theory. Our results suggest that these patterns may represent self-constructed niches emerging from competitive interactions. A corollary of our findings is that, whereas in species-poor communities sympatric speciation and invasion of open niches is possible, species-saturated communities may be characterized by convergent evolution and invasion by look-a-likes.
Keywords: biodiversity, coexistence, competition, evolution, niche construction
One of the classical puzzles in biology is the question how so many species can coexist in nature (1). Niche differentiation is obviously an important aspect. However, it is clear that other mechanisms must be involved, as similarity in coexisting species is often striking. For instance, in planktonic communities, impressive numbers of species coexist in a seemingly homogeneous habitat with little scope for niche differentiation (2), and in tropical rainforests numerous similar tree species coexist (3). An explanation that is close to the intuition of many naturalists is that the niches of all of these seemingly similar species really differ in aspects that are not easily detected. Another, slightly less intuitive class of explanations for the coexistence of so many species in nature is that various mechanisms may help to prevent competitive exclusion. Examples are predation (4, 5), chaotic population dynamics (6, 7), environmental variability (2, 8, 9), and incidental disturbances (10, 11). The interaction of such mechanisms at multiple scales of space and time may maintain much of the biodiversity observed in nature (12, 13). A rather different aspect is stressed in the neutral theory of biodiversity (3, 14) that sparked some controversy over the past years (15). The essential assumption is that species are equivalent, so that no species can out-compete another. Although it may be argued that species sharing an ecological niche and facing the same fundamental tradeoffs will coevolve to have roughly the same competitive power (16), real neutrality is of course a limit case (17), and the results have been shown to be quite fragile to relaxation of the assumption (18, 19). Nonetheless, one may ask whether strong similarity might in some way still help to facilitate coexistence.
To explore how we might bring the seemingly disparate worlds of niche and neutral theory together, we use a classical Lotka–Volterra competition model
 |
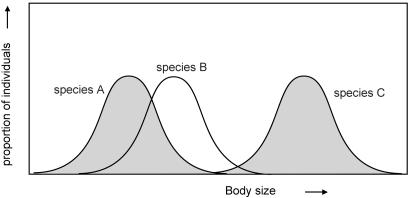
where Ni is the density of the species i, r is the maximum per capita growth rate, Ki is the carrying capacity of species i, and αi,j is the competition coefficient scaling the effect of species j on species i. We chose the competition coefficients in such a way (see Methods) that the model mimics competition between species along a niche gradient (Fig. 1).
Fig. 1.
To study competition, we place species randomly along a hypothetical niche axis. To facilitate an intuitive interpretation, one may think of the niche axis as a gradient that is related to the size of organisms. If we assume that individuals of the same size compete strongest, niche overlap and resulting competition coefficients can be computed (45) for sets of species of given size distributions (see Methods).
Pattern Formation in Communities of Competing Species
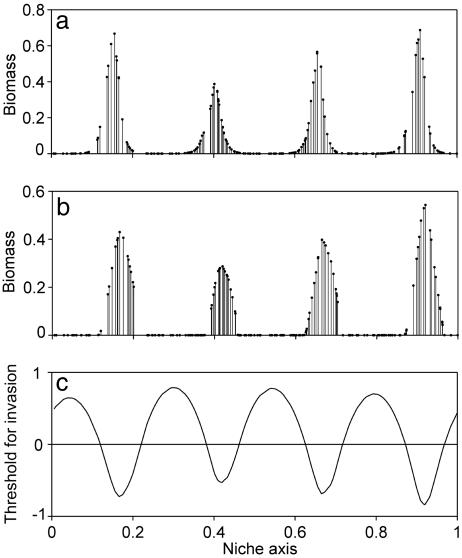
As a first approach to analyze how competition along a niche axis would structure a community, we place a large number of species at random positions on an infinite niche axis (mimicked by making it circular, see Methods) and compute the resulting competition coefficients. We then run the competition model to see to which state it converges. Although one would intuitively expect that the survivors of this competition game would be species that are equally spread out over the niche axis, the surprising result is that simulations converge to a very long transient pattern of self-organized lumps that contain multiple coexisting species of similar size (Fig. 2a). Numerical experiments (not shown) revealed that the distance between species lumps on the niche axis depends on the niche width of the species in the sense that the lumps are spread further apart if the standard deviations of the species size distributions (the niches) are broader. Thus, coexistence of different lumps is a straightforward effect of avoidance of competition. However, species that are similar enough apparently escape this rule of limiting similarity and may coexist within the lumps.
Fig. 2.
Self-organized lumpy patterns in the abundance of competing species along a niche axis. (a) A transient state after a simulation run of 1,000 generation times. (b) A stable pattern of species abundance reached after 5,000 generation times in the presence of mild density-dependent losses (g = 0.02, H = 0.1, Eq. 2). (c) The competitive threshold for invasion of a new species expressed as percentage deviation of its carrying capacity (K) relative to that of the resident species is lowest in the species lumps, showing that these represent relative windows of opportunity for invasion, and attractors in the fitness landscape. Note that the relatively low predation loss at low densities allows starting invaders to enter with a competitive power (K) slightly below that of residents.
Although this pattern of lumpy coexistence is transient, it can exist for thousands of generations (defined as 1/r). Eventually one species in each hump survives, giving rise to the intuitively expected pattern of equally spaced single species. However, it has been argued that long transients may be much more important than previously recognized (20, 21), and the rather persistent pattern of lumpy species distributions in our simulations may be an example in case. In fact, the extreme slowness of competitive exclusion among similar species is in line with what can be observed in simple two-species Lotka–Volterra models where the time to displacement tends to infinity as species become equivalent and their zero-growth isoclines coincide (17).
The apparently weak forces of competitive displacement in our lumps of species suggest that it might be relatively easy for the numerous processes known to reduce the risk of competitive exclusion to stabilize the coexistence in our species lumps. As an example of such a mechanism, we take top-down control because there is increasing evidence that natural enemies including pathogens are responsible for preventing most species from becoming very abundant (22, 23). We explored the effect of such a regulation assuming losses to increase (up to a maximum g) when population density exceeds a threshold (H)
 |
Indeed, this leads to permanent coexistence of similar species in lumps while leaving the gaps empty (Fig. 2b). The result is robust against change of the niche axis from circular (“infinite periodic”) to finite linear. The only change here is that there is an edge effect in that the lumps become somewhat narrower and species more abundant toward the ends of the niche axis (Fig. 6a, which is published as supporting information on the PNAS web site).
Note that, in view of earlier findings (4, 5), it is not surprising that predation stabilizes coexistence. Indeed, other processes known to facilitate coexistence (2, 4–11) would likely do the same job. What is new here is not the coexistence per se, but rather the self-organized pattern in which stable coexistence is found only for sufficiently similar and sufficiently dissimilar species and not for species of intermediate dissimilarity. In other words, not the lumps but the gaps are the surprising thing.
Invasion Resistance
It seems counterintuitive that coexistence can become easier if two species are more similar. After all, their competition becomes more intense. This apparent paradox can be explained by a rather universal mechanism. In situations where species are far apart in niche space, intermediate positions between these species are open niches (and obviously the best places for new invaders). However, it follows from classical niche theory that as niches of resident species become more closely packed, the positions between the species turn into the worst places in the “fitness landscape” (24). As more species interact, it becomes increasingly difficult to grasp the net effect in an intuitive way, as we end up with an intricate balance between direct and indirect competition effects. For instance, one can imagine that two competitors in a lump will facilitate each other indirectly by suppressing a common competitor that takes an intermediate position on the niche axis between them.
The counterintuitive phenomenon that competition in species lumps may be less severe than in the empty gaps can be revealed in our self-organized communities by looking at the critical conditions for new species to invade successfully at different points at the niche axis (Fig. 2c). The spaces between the species lumps can only be invaded by more competitive species, whereas the lumps are relative windows of opportunity in which a new species can invade even if it is a relatively weak competitor. Although the hills and valleys in the fitness landscape look convincing, they are in fact quite subtle. As a result, their effect can be easily disturbed by difference in competitive power between species. If the carrying capacity of the species is drawn randomly, the pattern becomes much less regular (Fig. 6b) due the effect of randomly occurring strong competitors. Thus, although on an ecological time scale the self-organized patterns of lumpy coexistence may be stabilized by processes such as density dependent predation, they are easily overwhelmed by intrinsic differences in overall competitive power between species.
Evolution
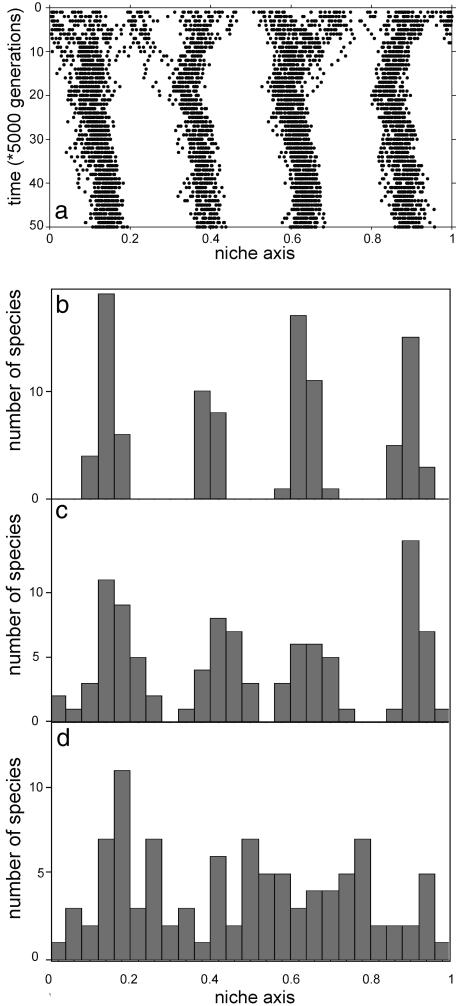
To explore how evolution would shape our model communities, we allowed the species to evolve slowly in the direction on the niche axis where they experience less competition (see Methods). Starting with species of randomly chosen sizes, the simulated evolution leads to convergence toward stable lumps of similar coexisting species (Fig. 3). In contrast to the patterns generated on an ecological time scale, these evolutionary results are remarkably robust. For instance, although variation in competitive power easily prevents a regular pattern to arise on an ecological time scale (Fig. 6b), evolutionary reshuffling of the species positions in the niche space enabled self-organization into regular smooth patterns (e.g., Fig. 3b) despite considerable random variation in competitive capacity used in these simulations. Obviously, as the relative importance of variation in other selection pressures (captured in our random factor) increases, the evolutionary process obviously becomes less directional and the lumpy pattern becomes more blurred (Fig. 3 c and d). In summary, the numerical experiments suggest that on an evolutionary time scale self-organization may be a strong directional force creating stable lumps of similar species even in the face of stochasticity in competitive power and evolutionary dynamics.
Fig. 3.
Simulated evolution of 100 species (dots in a) that are initially randomly distributed over the niche axis results in convergence toward self-organized lumps of similar species in the presence of density-dependent losses. The carrying capacity of the species is randomly drawn between 9 and 10. (b–d) Resulting frequency distributions of species sizes for increasing values of the parameter representing random variation in other factors that affect evolutionary pressure (w = 0.025, 0.04, and 0.05, respectively). g = 0.5, H = 5, Eq. 2.
Self-Organized Versus Preexisting Niches
An important simplifying assumption in our model so far is that initially (when all of the competing species are at negligible density), each place on the niche axis is equally good. In practice, this will of course rarely be the case. For instance, some body sizes will usually be better than others, as some types of food items, predators, or refugia are more abundant than others. As different species adapt to such preexisting niches, they will converge evolutionary. Indeed, all textbook examples of classical convergent evolution are of this type. An important question therefore is whether convergence to self-organized niches (the species lumps) might still be expected in a world which also has externally determined niches. We explored this by adding a function (f(L)) to the model that affects the net growth in a way that depends on its position (L) on the niche axis, modifying Eq. 1 to
 |
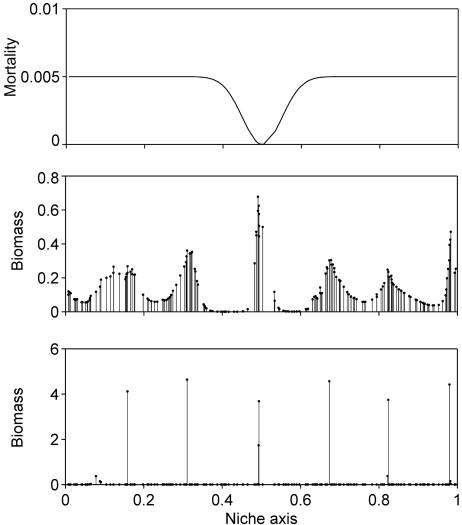
As a first step to see the effect of predetermined niches, we created a single niche in the middle of our niche axis by making mortality rates slightly lower there (Fig. 4). It appears that even if such predetermined niche opportunities are only providing a slight advantage (a dip of 0.005 d−1 in a background mortality rate), they may serve as a condensation point that anchors the self-organized pattern (Fig. 4). In the simulations with equally strong competitors in a homogeneous niche space (Fig. 2), coincidental clumps in the random initial species distributions serve as random condensation points to trigger the pattern formation, but apparently this effect is easily overwhelmed by the slightest heterogeneity in predetermined niche opportunity.
Fig. 4.
A slight preexisting niche, simulated by a tiny dip in the background mortality rate around the value 0.5 on the niche axis [Top; the function used to generate this particular example is f(L) = mA − a(1/2 + 1/2cos((L + 0.5)2π))20, mA = 0.005 d−1; a = 0.005 d−1], is enough to function as a “condensation point” that anchors the self-organized pattern of species lumps to a fixed position (Middle, after 5,000 time steps; Bottom, after 20,000 time steps).
To explore a more natural situation, we created niche opportunities that vary randomly over the niche axis. We used a red-noise function on 200 points of the niche axis (25) to create a realistic autocorrelation of opportunity along the axis rather than white noise. Not surprisingly, the resulting preexisting niches do affect the pattern of species distribution along the niche axis if they are strong enough. However, despite substantial external niche forcing (variation of ± 0.1 d−1 in net growth rates), regular patterns of species distribution arise that reflect the mechanism of self-organization (Fig. 7, which is published as supporting information on the PNAS web site). In summary, our model suggests that patterns in nature may often reflect a mix of the self-organized patterns and preexisting niche opportunities.
Robustness and Generality of the Results
Our somewhat counterintuitive results raise two questions. First, as with any theoretical prediction one should ponder how robust the results are against model assumptions and choice of numerical procedures. Second, on a more intuitive level, it seems puzzling that our results have not been obtained earlier by the productive generation of theoretical biologists working on niche theory in the 1960s and 1970s. With respect to the last point, the answer may simply be computer power. Emergence of spatial structure through symmetry breaking has been studied analytically in systems governed by a few equations (26), and possibly our systems could be mimicked in such a form. However, the emergence of the self-organized patterns in the systems of numerous interacting species we studied requires numerical approaches that were not available in the early days of niche theory. Certainly, our findings do not contradict the classical results. Rather, they extend what has been found earlier. Both the process of species spacing out over a niche axis and the possibility of evolutionary convergence between competing species have been predicted early on (24, 27). However, the convergence has always been assumed to eventually lead to competitive exclusion. The extension following from our work is that convergent evolution can lead to self-organized lumps of coexisting similar species that remain stable.
With respect to the question how robust our findings are, it should first be noted that this differs depending on whether evolution is considered. The simulations show that, on ecological time scales, competitive inequality easily blurs the pattern (Fig. 6b). One could argue that species have evolved to become practically equivalent in competitive power (3). However, even with relatively small variation in competitive power, stronger competitors simply dictate the pattern making the distance between lumps of species less regular and displacing weaker competitors in nearby niches. By contrast, the simulations with evolutionary reshuffling in niche space show that this process allows self-organization in a regular set of smooth and stable lumps despite variation in competitive power and stochasticity in the evolutionary process (Fig. 3). Thus, whereas the pattern formation is rather fragile on an ecological time scale, evolutionary adaptation may turn the self-organization into an apparently robust phenomenon.
Our numerical explorations also suggest that the mechanism of self-organization is robust enough to generate patterns in the face of the other main driver of convergent evolution: adaptation of different species to the same preexisting externally imposed niche. Of course, the relative role that the self-organizing mechanism might play in nature should be expected to ultimately depend on how much competition affects the “ecological niche.”
Clearly, our model analysis is just a starting point and numerous aspects remain to be explored. For instance, different, perhaps more realistic, competition models may be tested to see whether self-organized patterns still emerge. This emergence seems likely, as earlier work has shown that the essential phenomenon of convergent evolution (in the absence of preexisting niches) is quite generic in the sense that it does not hinge on the simple competition model assumed (24, 28, 29). However, many competition models may still be explored to test the generality of the phenomenon of self-organization. Also, it would be challenging to try more elaborate and realistic algorithms to simulate evolution, and to extend the analysis to more than one niche dimension, and explore what happens if generalists and specialists can evolve under certain tradeoff assumptions.
Finally, with respect to the generality of our results, it is important to note that our prediction of self-organized patterns along a niche axis applies to “saturated” communities in which the niche space is pretty much filled with species. In species-poor communities with much open niche space, one should rather expect competition to promote character displacement such that species become more dissimilar, and even to cause occasional splitting of species through sympatric speciation (30). Also, in communities where unoccupied niche space is available, one should expect invasions to be most successful if the invader is relatively dissimilar to the residents, and therefore occupies an open niche; this corresponds to Darwin's “naturalization hypothesis” (31, 32). By contrast, our analysis suggests that, for “saturated” communities in which species are already self-organized in their use of the niche space, we should expect diametrically opposed dynamics: convergent evolution and preferential invasion by look-a-likes.
Empirical Evidence
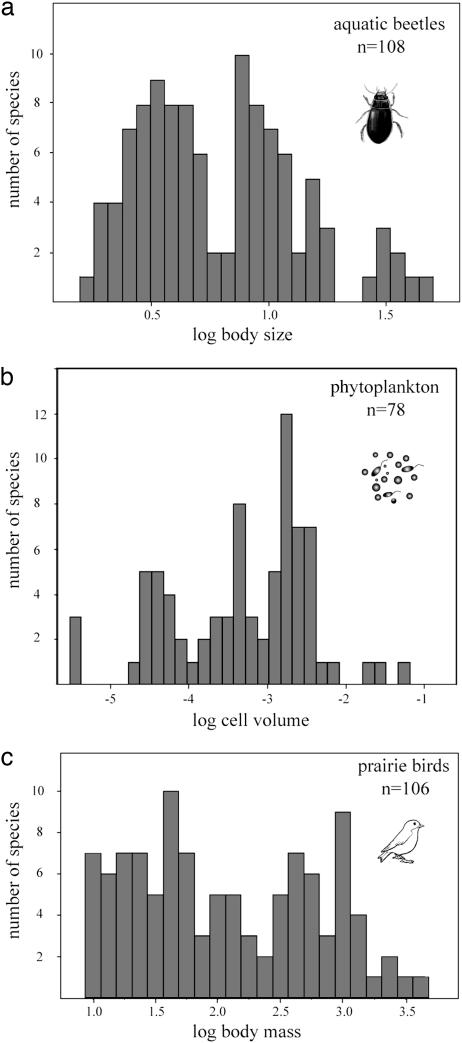
Various field observations are in line with our predictions. Examples are convergence between fish species in streams (33), preferential invasion of relatives of residents in New Zealand (34), and the fact that invaders very often shift in size compared to the population in their original habitat (35). However, the most suggestive class of empirical evidence for self-organized coexistence of similar species is the striking lumpiness in species size distributions that has been found for many groups of organisms. As an illustration, we show patterns for European aquatic beetles, Dutch freshwater algae, and American prairie birds (Fig. 5), but we are not the first to show this phenomenon. Earlier studies have demonstrated significant lumpiness in communities ranging from mammal and bird communities to lake plankton (36–38). Initial discovery of these puzzling patterns caused much excitement (39), and three hypotheses have been suggested to explain them: “Trophic Trough,” the “Textural Discontinuity Hypothesis,” and “Evolutionary Legacy” (38). None of these hypotheses have passed the tests against data over the years. Trophic interactions seem unlikely to be the general force shaping the size distributions, as plankton (notorious for size-specific top-down effects; ref. 40) shows the same gaps and lumps in size distribution if top-down control is altered by removing fish from a lake (36). The Textural Discontinuity Hypothesis, proposing that the clumps and gaps in body size distributions in biomes reflect structural characteristics of the vegetation and landscape, seems intuitively reasonable. However, remarkable similarity of size structure in structurally different settings within the same geographic region suggests that the clumps and gaps reflect properties of the regional species pool (36, 37). This could point at some Evolutionary Legacy effect. However, it seems hard to believe that evolution would have been unable to fill the relatively narrow gaps in size distributions that are observed (e.g., Fig. 3). Indeed, our results suggest that convergent evolution toward lumps rather than limitations of evolving away from the lumps might explain the patterns.
Fig. 5.
Size distributions of species in nature often show a lumpy pattern, illustrated here for European aquatic beetles (a, data compiled by Drost et al.; ref. 46), phytoplankton species of the Dutch Border Lakes (b, unpublished data from the RIZA Institute), and American prairie birds (c, data compiled by Holling; ref. 38).
Obviously, the fact that our mechanism can generate patterns that are found in nature is suggestive, but does not prove that it has actually been responsible for these patterns. It does seem a plausible candidate that is robust in models. However, just as it has proven remarkably hard to demonstrate the role of basic mechanisms such as competition and density dependence unequivocally in nature, it will be difficult to demonstrate that self-organized similarity is an important ingredient in the mix of mechanisms that shapes the patterns we see in nature. Possible tracks for empirical work would include the analysis of invadability and patterns of resource depletion along a niche axis in “lumpy” communities.
Conclusion
In conclusion, our analysis indicates that coevolution in species-rich communities may easily lead to self-organized patterns of groups of similar species. Our findings suggest a fresh look at the structuring effects of competition on patterns of species diversity in nature. Put simply, there are two contrasting windows of opportunity for coexistence: being sufficiently different or being sufficiently similar. Our results show that the interplay of these forces may result in a pattern of self-organized niches to which species converge evolutionary. Although adaptation to preexisting (externally imposed) niches remains an obvious explanation for the similarity between many species in nature, the striking regularity of many of the patterns observed suggests that the mechanism of self-organization we propose may play an important role in many systems too.
Finally, it is worth noting a remarkable link to Hotelling's theory (41) in social sciences suggesting that competition of companies or political parties will often lead to convergence rather than differentiation. In this field of research, the focus is on the problem that such convergence is not in the interest of the public. For instance, having more of the same kind of TV channels is not better (42). By contrast, the seeming redundancy of similar species in nature may be essential to ensure ecosystem functioning in the face of adverse impacts (43, 44).
Methods
As a starting point to compute competition coefficients that allow us to mimic competition of species for resources along a niche axis (Fig. 1 and Eq. 1) we characterize the width of the niche by normal distributions on the niche axis (L)
We assume that competition intensity between species i and species j is related to niche overlap, and thus to the probability P that individuals of the two species are at the same position on the niche axis, which is the product of both probabilities
 |
We calculate competition coefficients as the ratio of the probability of matching an individual of competing species j and the probability of matching a conspecific (45), which can be solved as follows (cf. 24)
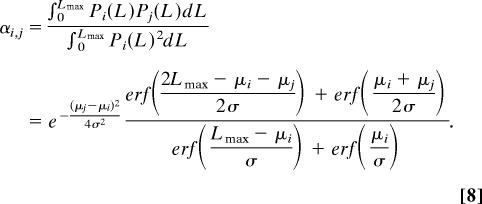
To avoid edge effects, the niche axis is defined circular (“periodic”) so that each species has equal numbers of competitors on both sides. Alternatively we checked the effect of having a finite linear niche axis of length Lmax. In this case, niche overlap is calculated as
 |
and the competition coefficients are computed as
 |
Time in the model is scaled in units of r (so r = 1) and the carrying capacity K is set default to 10. We used a fourth order Runga–Kutta solver as implemented in matlab. For the default simulations, 200 species were assigned randomly (following a uniform distribution) to a certain position (μi) on the niche axis, each with the same niche width (standard deviation σ = 0.15).
To mimic evolution, each species iterates its position on the niche axis each 5,000 time steps to increase its fitness. The fitness of the species is defined as the inverse of the carrying capacity that an invader would need to invade successfully, which can be computed from the condition for positive growth at low initial density (24)
The evolutionary step-size is set to 0.01 niche units, and the species move on the niche axis in the direction where their fitness increases. We also explored the effect of a variable evolutionary speed, by making the step size dependent on the steepness of the gradient in competition pressure along the niche axis. Because this gave basically the same result, we stuck to the simple version for the simulations presented in the manuscript. To capture variation in conditions that would also affect selection pressure we add a random factor to the evolutionary movement drawn randomly and uniformly between −w and w.
Supplementary Material
Acknowledgments
We thank Robert Holt, Simon Levin, Michel Loreau, Steve Carpenter, Tadashi Fukami, Peter Schippers, Luc De Meester, and Wim van der Putten for many interesting suggestions based on an earlier version of the manuscript and Jan Cuppen for pointing us to the aquatic beetle data. One of the anonymous referees not only suggested ways to improve the manuscript but also brought up novel ideas.
Conflict of interest statement: No conflicts declared.
This paper was submitted directly (Track II) to the PNAS office.
See Commentary on page 6083.
References
- 1.Hutchinson G. E. Am. Nat. 1959;93:145–159. [Google Scholar]
- 2.Hutchinson G. E. Am. Nat. 1961;95:137–145. [Google Scholar]
- 3.Hubbell S. P. The Unified Neutral Theory of Biodiversity and Biography. Princeton: Princeton Univ. Press; 2001. [Google Scholar]
- 4.Paine R. T. Am. Nat. 1966;100:65–75. [Google Scholar]
- 5.Chase J. M., Abrams P. A., Grover J. P., Diehl S., Chesson P., Holt R. D., Richards S. A., Nisbet R. M., Case T. J. Ecol. Lett. 2002;5:302–315. [Google Scholar]
- 6.Huisman J., Weissing F. J. Nature. 1999;402:407–410. [Google Scholar]
- 7.Scheffer M., Rinaldi S., Huisman J., Weissing F. J. Hydrobiologia. 2003;491:9–19. [Google Scholar]
- 8.Chesson P., Huntly N. Am. Nat. 1997;150:519–553. doi: 10.1086/286080. [DOI] [PubMed] [Google Scholar]
- 9.Sommer U. Limnol. Oceanogr. 1984;29:633–636. [Google Scholar]
- 10.Huston M. A. Am. Nat. 1979;113:81–101. [Google Scholar]
- 11.Connell J. H. Science. 1978;199:1302–1310. doi: 10.1126/science.199.4335.1302. [DOI] [PubMed] [Google Scholar]
- 12.Levin S. A. Ecology. 1992;73:1943–1967. [Google Scholar]
- 13.Levin S. A. Ecosystems. 2000;3:498–506. [Google Scholar]
- 14.Bell G. Am. Nat. 2000;155:606–617. doi: 10.1086/303345. [DOI] [PubMed] [Google Scholar]
- 15.Whitfield J. Nature. 2002;417:480–481. doi: 10.1038/417480a. [DOI] [PubMed] [Google Scholar]
- 16.Aarssen L. W. Am. Nat. 1983;122:707–731. [Google Scholar]
- 17.Loreau M. Oikos. 2004;104:606–611. [Google Scholar]
- 18.Yu D. W., Terborgh J. W., Potts M. D. Ecol. Lett. 1998;1:193–199. [Google Scholar]
- 19.Ricklefs R. E. Oikos. 2003;100:185–192. [Google Scholar]
- 20.Hastings A. Trends Ecol. Evol. 2004;19:39–45. doi: 10.1016/j.tree.2003.09.007. [DOI] [PubMed] [Google Scholar]
- 21.Hastings A., Higgins K. Science. 1994;263:1133–1136. doi: 10.1126/science.263.5150.1133. [DOI] [PubMed] [Google Scholar]
- 22.Mitchell C. E., Power A. G. Nature. 2003;421:625–627. doi: 10.1038/nature01317. [DOI] [PubMed] [Google Scholar]
- 23.Torchin M. E., Lafferty K. D., Dobson A. P., McKenzie V. J., Kuris A. M. Nature. 2003;421:628–630. doi: 10.1038/nature01346. [DOI] [PubMed] [Google Scholar]
- 24.MacArthur R. H., Levins R. Am. Nat. 1967;101:377–385. [Google Scholar]
- 25.Hasselmann K. Tellus. 1976;28:473–485. [Google Scholar]
- 26.Levin S. A., Segel L. A. Siam Rev. 1985;27:45–67. [Google Scholar]
- 27.Cody M. L. Annu. Rev. Ecol. Syst. 1973;4:189–211. [Google Scholar]
- 28.Abrams P. A. Theor. Popul. Biol. 1986;29:107–160. doi: 10.1016/0040-5809(86)90007-9. [DOI] [PubMed] [Google Scholar]
- 29.Abrams P. A. Am. Nat. 1987;130:271–282. [Google Scholar]
- 30.Dieckmann U., Doebeli M. Nature. 1999;400:354–357. doi: 10.1038/22521. [DOI] [PubMed] [Google Scholar]
- 31.Darwin C. The Origin of Species. London: Murray; 1859. [Google Scholar]
- 32.Daehler C. C. Am. Nat. 2002;158:324–330. doi: 10.1086/321316. [DOI] [PubMed] [Google Scholar]
- 33.Knouft J. H. Evolution (Lawrence, Kans.) 2003;57:2374–2382. doi: 10.1111/j.0014-3820.2003.tb00249.x. [DOI] [PubMed] [Google Scholar]
- 34.Duncan R. P., Williams P. A. Nature. 2002;417:608–609. doi: 10.1038/417608a. [DOI] [PubMed] [Google Scholar]
- 35.Grosholz E. D., Ruiz G. M. Ecol. Lett. 2003;6:700–705. [Google Scholar]
- 36.Havlicek T. D., Carpenter S. R. Limnol. Oceanogr. 2001;46:1021–1033. [Google Scholar]
- 37.Siemann E., Brown J. H. Ecology. 1999;80:2788–2792. [Google Scholar]
- 38.Holling C. S. Ecol. Monogr. 1992;62:447–502. [Google Scholar]
- 39.Baskin Y. Science. 1997;275:311. [Google Scholar]
- 40.Carpenter S. R., Kitchell J. F. The Trophic Cascade in Lakes. Cambridge, U.K.: Cambridge Univ. Press; 1993. [Google Scholar]
- 41.Hotelling H. Econ. J. 1929;39:41–57. [Google Scholar]
- 42.Liu Y., Putler D. S., Weinberg C. B. Marketing Sci. 2004;23:120–133. [Google Scholar]
- 43.Loreau M., Naeem S., Inchausti P., Bengtsson J., Grime J. P., Hector A., Hooper D. U., Huston M. A., Raffaelli D., Schmid B., et al. Science. 2001;294:804–808. doi: 10.1126/science.1064088. [DOI] [PubMed] [Google Scholar]
- 44.Ives A. R., Gross K., Klug J. L. Science. 1999;286:542–544. doi: 10.1126/science.286.5439.542. [DOI] [PubMed] [Google Scholar]
- 45.Levins R. Evolution in Changing Environments: Some Theoretical Explorations. Princeton: Princeton Univ. Press; 1968. [Google Scholar]
- 46.Drost M. B. H., Cuppen H. P. J. J., Van Nieukerken E. J., Schreijer M. De waterkevers van Nederland. Utrecht, The Netherlands: Uitgeverij; 1992. [Google Scholar]
Associated Data
This section collects any data citations, data availability statements, or supplementary materials included in this article.


