Abstract
Gaining a detailed understanding of the proton-pumping process in cytochrome c oxidase (COX) is one of the challenges of modern biophysics. Recent mutation experiments have highlighted this challenge by showing that a single mutation (the N139D mutation) blocks the overall pumping while continuing to channel protons to the binuclear center without inhibiting the oxidase activity. Rationalizing this result has been a major problem because the mutation is quite far from E286, which is believed to serve as the branching point for the proton transport in the pumping process. In the absence of a reasonable explanation for this important observation, we have developed a Monte Carlo simulation method that can convert mutation and structural information to pathways for proton translocation and simulate the pumping process in COX on a millisecond and even subsecond time scale. This tool allows us to reproduce and propose a possible explanation to the effect of the N139D mutation and to offer a consistent model for the origin of the “valve effect” in COX, which is crucial for maintaining uphill proton pumping. Furthermore, obtaining the first structure-based simulation of proton pumping in COX, or in any other protein, indicates that our approach should provide a powerful tool for verification of mechanistic hypotheses about the action of proton transport proteins.
Keywords: electrostatics, millisecond simulations
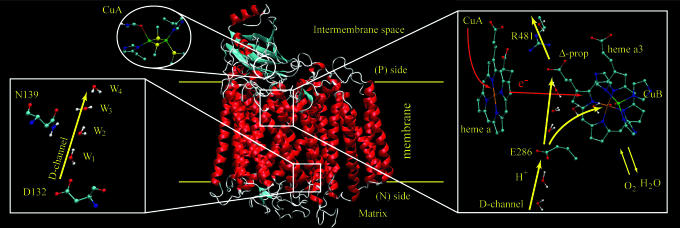
Cytochrome c oxidase (COX) couples the four-electron reduction of O2 to water and transmembrane proton transfer (PT) (e.g., refs. 1–3), which results in an electrochemical proton gradient that drives ATP synthesis. Solving the structure of COX (4, 5) and many other studies (e.g., refs. 6–10) have provided the opportunity to analyze coupled electron transfer and PT (ET/PT) on a molecular level. This system has long presented a conceptual challenge in the field of bioenergetics, and many of the mechanistic details are still not known. Previous studies have shed light on the overall pathways for the coupled ET/PT pumping process as outlined in Fig. 1. More specifically, protons are translocated from the mitochondria matrix side (the N-side) through the D-channel (and potentially other paths) and pass through E286 to the Δ-propionic group on heme a3 (Prd). Then, a second proton goes, with the help of an electron transfer (ET) process, to the binuclear center (Bn) where it participates in the chemical reduction of O2 to H2O, which pumps the proton from Prd to the mitochondria intermembrane space (the P-side of the membrane) (see, e.g., refs 2, 6, 7, and 11). However, despite the qualitative understanding of the pumping process, there is no accepted description of the detailed energetics and the nature of the gates that guarantee an uphill pumping process (see discussion in ref. 12).
Fig. 1.
A schematic description of the key elements in the COX systems. The figure considers heme a, heme a3, the two sides of the membrane, the entry, and the exit proton pathways. The pathways explored here are shown in yellow in the right side of the diagram (note that the orientation of the enlargements is not the same as for the protein).
The difficulties in elucidating the molecular details of the pumping process have been dramatized by a recent mutational study (10) that presented a unique yet extremely puzzling observation. It was found that mutating Asn-139, which is located at the beginning of the D-channel, to Asp inhibits proton pumping and accelerates the oxidase activity. That is, the N139D mutation changes the proton translocation (PTR) path so that the proton goes to the Bn site rather than to the P-side. The origin of this effect has not been understood, although some tentative suggestions have been proposed. For example, it has been suggested (e.g., ref. 7) that the negative charge of D139 changes the pKa value of E286, which will change the structure of the transient deprotonated state of E286 and lead to the observed effect. Although conformational changes of the type considered in ref. 7 are feasible, it was found in ref. 12 that E286 is unlikely to be deprotonated. Furthermore, a recent study pointed out that residue 139 is quite far from E286 and that the corresponding electrostatic interaction is rather small, which makes it unlikely to lead to a significant change in the pKa value of E286 (13). We believe that understanding this remarkable case, where a single mutation completely shuts down the proton pump by a relatively subtle effect that is difficult to rationalize, would be a major step in understanding the overall pumping mechanism of COX in detail.
It seems to us the best way to examine the elusive effect of the N139D mutation (as well as other aspects of the pumping process) is to use a computer-based structure–function correlation where it is possible to actually simulate the effect of the mutation on the pumping process. Although significant progress has been made in previous computer modeling studies of COX (11, 14–18), none of those studies have provided a framework for time-dependent simulation of the overall pumping process, which requires up to millisecond simulations.
The present work introduces a practical simulation approach that is based on the simplified empirical valence bond (EVB) effective potential (e.g., refs. 19–21) and reduces it to a modified Marcus equation. However, in contrast to our previous implementations of this idea, we are here interested in simulations that are efficient enough to allow studies of ET/PT processes in the range of milliseconds and explicit enough to allow one to monitor individual electrons and protons. The requirement of simulating individual electrons and protons prevents us from using a master equation approach (19), and the requirement of simulating long-time trajectories places severe restrictions on using regular molecular dynamics or Langevin dynamics approaches (22). Therefore, we introduce here a compromise that provides sufficiently reliable time dependence while overcoming the time-scale problem. This compromise is based on using Monte Carlo (MC) simulations combined with our effective modified Marcus potential (see Methods). This model allowed us to uncover the molecular origin of the effect of the N139D mutation and to rationalize the action of a remarkable biological valve. We also provide a previously undescribed simulation of the pumping process in the native COX.
Results and Discussion
Before simulating the proton pumping in COX, we validated the simulation approach outlined in Methods by a detailed study of PTR along a chain of six water molecules in an aqueous environment where the proton potential is identical on sites 1, 2, 5, and 6 and is gradually increased on sites 3 and 4. By using this test system we explored the dependence of the PTR transfer time on the free energy barrier (see related study in ref. 22). The simulated results (see Fig. 7, which is published as supporting information on the PNAS web site) showed an excellent agreement between the simulated rates and the rates predicted by Eq. 6 in Methods.
Simulating the Initial Pumping in the Native Enzyme.
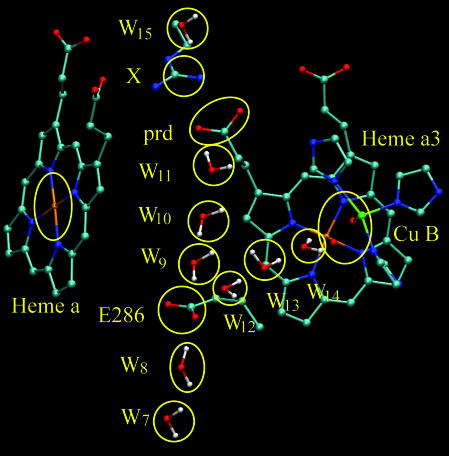
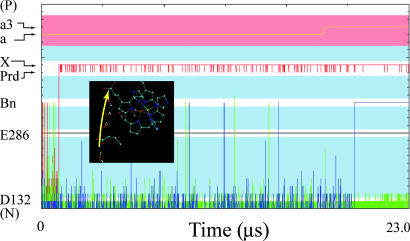
After validating the performance of our model, we moved to simulating the overall pumping process in COX in a somewhat tentative way by considering the time dependence of the ETs and PTs between the groups (protonatable and redox active residues) outlined by Fig. 2. Because this study focus on the effect of the N139D mutation we started by examining the initial step of PTR through the D-channel to the Prd group and to a few subsequent proton acceptors. Thus, we leave the examination of the exit channel, where there is less consensus, to a more careful subsequent study. The simulated PTR is depicted in Fig. 3, where the position of individual electrons and protons on different acceptors can be followed during the simulation (the labels of the most important groups are given on the y axis, whereas intervening water molecules are not labeled but have a light blue background; electron acceptors have a light red background). In the initial configuration we had protons on E286 and W1 (at the N side after D132). The effect of the bulk protons on the N-side was considered by allowing W1 to be reprotonated once the original proton has been moved away. The effect of this approximation will be considered below. In the initial phase of the simulation, protons moved through the D-channel, passed through E286 by a concerted transfer,† and continued to Prd (red line in Fig. 3). The nature of the concerted process is illustrated in a movie that is available from the authors upon request. The overall PTR from D132 to Prd took in this case ≈1 μs. The trajectory in our simulation that corresponds to this process is significantly faster than the experimental estimate of ≈100 μs (see, e.g., ref. 7). However, because our simulation started with a proton on W1, which was not allowed to go back to the bulk, we cannot directly compare these times. Instead, the overall average time for PTR from the bulk on the (N) side to the Prd should be given by Eq. 10 in Methods.
Fig. 2.
Some of the elements in our simulation system. The figure does not depict the chain D132, W1 to W6, which spans the D-channel up to position W7.
Fig. 3.
MC simulations of the time dependence of a PTR process that leads to pumping in the native system. The simulation starts with a proton on W1 and a PTR that moves the proton to Prd and to the next acceptor; this step is followed by a second PTR to the Bn, which is coupled with ET from heme a to heme a3. Longer trajectories (data not shown) lead to ejection of the first proton to the P side. The simulation time represents a trajectory that starts in W1 and is thus not directly related to the overall rate (see text).
We also were able to simulate the next step in the pumping process where a second PTR from D132 (blue line in Fig. 3) coupled to the ET from heme a to heme a3 (yellow line) reaches the Bn site. The generated configuration creates a barrier for back transfer of the proton residing on Prd and thus leads to overall pumping (see figure 10 in ref. 12 for the energetics of this pumping process). However, because the nature of the total pumping process and the corresponding pumping efficiency was not the subject of the present work, we have not pursued that challenging study here in a systematic way. Instead, we focus on the effect of the N139D mutation on the pumping process, which is done in the next section.
Exploring the Effect of the N139D Mutation on the Pumping Process.
Mutating residue N139, which is located at the beginning of the D-channel, to an Asp leads to the remarkable effect of changing the PTR path by inhibiting the pumping mechanism and making the proton go to the Bn site instead. The origin of this effect is far from obvious. Even the suggestion that the charge on residue 139 increases the pKa value of E286 by 1.6 pKa units (7) is hard to rationalize because the distance between these two residues is ≈18 Å, and it would take an effective dielectric of ≈8 to account for such a large effect. Such a value for a charge–charge dielectric constant is significantly smaller than what is found in protein interiors (e.g., ref. 23). Interestingly, a small shift also has been obtained in the recent macroscopic study of Michel and coworkers (13). It is furthermore not even clear why such a change in the pKa value would lead to the observed change in PTR.
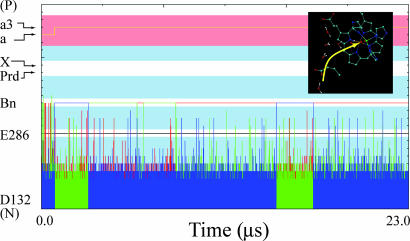
To resolve the above problem, we simulated the PTR in the mutant enzyme in the same way as for the native enzyme and compared the resulting trajectories with those depicted in Fig. 3. As can be seen from Fig. 4, our simulation reproduced the effect of the N139D mutation on the pumping process. That is, the PTR to the Prd seems to be slowed down substantially, and the proton goes instead to the Bn site by a coupled ET/PT. Once the coupled ET/PT occurs and the system relaxes to a low energy state, the cross-membrane gate is closed, and the PTR is prevented for this step in the O2 reduction cycle. As in the case of the native enzyme, the overall average time should be evaluated by Eq. 10 in Methods. The simulations include, however, the ET process that took in this case ≈1 μs. In this respect, we note that we obtain two types of productive trajectories: one with ET before the motion of the proton to Bn and one after the arrival of the proton to Bn. This issue is discussed below.
Fig. 4.
MC simulation of the time dependence of a trajectory for a PTR in the N139D mutant. The simulated trajectory involves an ET to Bn followed by a PTR to Bn. The system is then trapped in the Bn state.
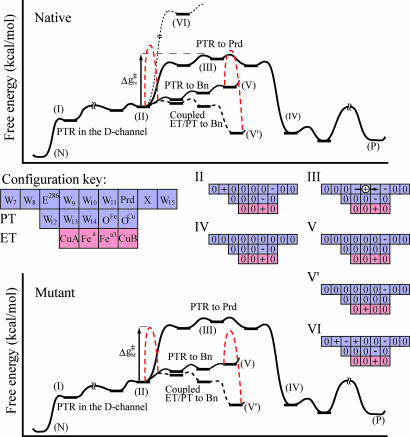
The simulated behavior seems to follow directly the results expected from the tentative energy diagram depicted in Fig. 5. According to this diagram, the barrier for coupled ET/PT to the oxygen at the Bn site is higher in the native enzyme than the barrier for transfer to Prd. However, when N139 is mutated, the barrier for PTR to Prd becomes too high to support a transfer to this site, and both the proton and the electron move to the Bn site. This movement can take place by either ET from state II to state II′ followed by PT from state II′ to state V′ or by PT from state II to state V followed by ET (V → V′). Because the mutation is likely to also push up the II → V segment of the free energy surface, it seems more probable that the ET occurs before PTR, but verifying this issue requires further study (including consideration of the possibility that the ET is faster in both cases).
Fig. 5.
A qualitative free energy surface for PTR in the native (Upper) and the N139D mutant (Lower) systems. In the case of the native system the proton starts from the N side, moves to the beginning of the D-channel (I), moves to W8 (II), and then is transferred through the hydrophobic region (III) to Prd (IV). The barrier for PTR to Prd (ΔgN‡) is sufficiently low to allow for a PT, whereas the PTR to Bn (V) results in return to the initial point (II). Once an electron is transferred to Bn in the V → V′ process (the corresponding kinetic barrier that includes the effect of the coupling term is represented by a dashed line between V and V′) we may have a PTR to this site, and the pumping will stop. In the case of the mutant system, the energy at point (II) is going down so that the barrier for PTR to Prd increases and the corresponding PTR is blocked. This step gives enough time for an ET to Bn and stops the pumping process. The occupation diagrams are given according to the rules established in ref. 12 for the elements drawn in the configuration key.
A remarkable finding of the present work is that we have managed to rationalize the effect of the mutation in terms of changes in the barrier for PTR to Prd. We have already established in a previous work (12) that the PTR through E286 could only occur in a concerted way. Thus, the actual change in pKa value of E286 due to the mutation (which is probably quite small) is not the issue and is not so relevant to the pumping process. More specifically, the barrier for concerted PTR is determined by the ΔG for PTR from W8 to W9 or W10 (depending on which site correspond to the highest barrier), which does not depend on the pKa value of E286 in a significant way. Now with a charge–charge dielectric constant of ≈10, we obtained a shift of ≈1 kcal/mol in the ΔG for a PTR from W8 to W10 due to the effect of D139. A further slowdown of the PTR may be due to the large stabilization of protons in the D-channel that increases the effective barrier for PTR. Another way to see the effect is to note that the barrier for PTR relative to point I stay the same as in the native enzyme, whereas on the other hand the barrier for the ET from state II (or in particular from earlier points in the D-channel) is reduced. Thus, in some respect we can view the effect of the mutation as a change in the balance between the PTR and ET rates (although it is also possible that we simply have a change in PT ratios).
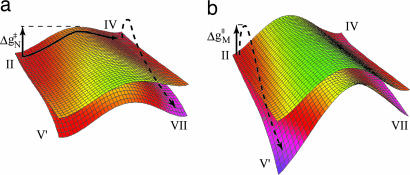
To further clarify the exquisite effect of E286, we provide in Fig. 6a two-dimensional diagram of the type introduced in ref. 12 (see Fig. 6 legend). The diagrams are presented for the two states of the electron (on Heme a or on the Bn site). As can be seen from the first diagram, the pumping occur by transferring the first proton to Prd (the x-direction; state II → IV), followed by transferring a second proton in the y-direction (coupled to an ET process that corresponds to a jump to the lower surface). This process creates a higher barrier for the back PTR from Prd to E286 (moving first to the left to IV and then down to VII creates a trap and prevent back PTR). In the mutant, on the other hand, there is a high barrier for PTR to Prd (moving from state II to IV) so that the PTR occurs in the E286–Bn path, most probably following an ET to the Bn site (the overall process involves motion from state II to V′). Once this transfer has happened, the system is trapped in state V′, and the pumping is stopped.
Fig. 6.
The free energy surfaces for the native (a) and mutant (b) enzyme. Shown is the dependence of the free energy surface on the coordinate of a proton that is being transferred to Prd (x axis) and the proton that is being transferred to Bn (y axis). The surfaces are given for electron on heme a (upper surface) and the electron on Bn (lower surface). The color code indicates the height of the different regions on the surface (green, high energy; red, low energy). (a) The pumping occurs by movement from II to IV and to VII as indicated by the black arrows (states II–VI are defined in Fig. 5, and state VII is the state where both Prd and O are protonated). (b) Conversely, in the mutant the barrier for II → IV increases, and the system moves instead from II to V′. The reduction of the energy in the front corner (which corresponds to an electron and proton at Bn) represents the assumed effect of additional relaxation.
Concluding Remarks
Gaining a molecular understanding of PTR in general and proton pumping in particular presents a major challenge in biophysics and bioenergetics. Elucidating the detailed action of COX has presented one of the most challenging problems, where despite the advance in structural and kinetic studies, we do not have a clear picture on the nature of the pumping process. That is, although there have been tentative attempts to account for the molecular nature of the pumping process and/or the corresponding gating mechanism (e.g., refs. 7, 14, and 24), it is essentially impossible to reach unique conclusions about the validity of different proposals unless they are formulated and examined by some type of structure–energy relationship and then translated to kinetic information by computer-simulation approaches. Such a structure–function correlation approach has recently been developed (12), but the absence of a proper simulation approach prevented its use in quantitative time-dependant studies. Apparently, although significant advances have been made in short time simulations of PTR in solutions and in biological systems (25–27), no method has been able to bridge the time gap and to simulate biological PTR in the long times that are typically involved in proton-pumping processes. This difficulty and other problems have so far prevented a faster progress in understanding PTR in COX and related systems.
The need for an effective simulation tool has become even clearer after finding that a single mutation (N139D) can completely change the nature of the pumping process in COX. The present work exploits our previous advances and develops a method that enables us to simulate biological PT/ET processes up to the millisecond time scale. Our method is illustrated in the first simulation studies of the overall pumping of COX and particularly in uncovering the origin of the N139D mutation effect. This simulation offers a feasible explanation of the effect of a distant residue that changes the electrostatic potential on the water molecules before E286 and provides a valve for proton pump stopping the flow to the P side and trapping the proton in the Bn center.
Although our simulation results are very encouraging, it is still possible that the observed valve effect is due to another change in the detailed operation of COX. It is clearly important to apply our simulation approach to other mutation experiments. For example, very recent experiments indicate that the N139C mutation has a similar effect as the N139D mutation (R. B. Gennis, personal communication). In this case, it is harder to rationalize the effect of the mutation unless the Cys residue becomes ionized when the proton is in the D-channel; this issue also should be explored by detailed simulations. Explaining the effect of other mutations is equally challenging. Thus, perhaps the main contribution of our study is the emergence of an approach that can be used as a general tool for studies of biological PTR rather than the absolute validity of a single mutation study. We believe that a consistent picture of the pumping process will eventually emerge by a combination of experimental studies and simulation approaches that will be used to examine the validity of different mechanisms and their consistency with available experiments.
Methods
Our approach is based on two elements: first, we construct the effective free energy surface of our system by a modified Marcus treatment, and, second, we simulate the time-dependent motion of the protons and electrons on these surfaces by a MC approach. These two elements will be described briefly below.
To describe the free energy surface for coupled ET/PT processes, we use a Marcus’ type state diagram in the quantitative framework of the EVB approach (25). Because this approach has been described before (12), we only consider the main points here. In this description, we start by combining our early picture of ET (28) and PT (19, 20) and obtain a general expression for the free energy of each feasible state of the system by (see e.g., refs. 20 and 28)
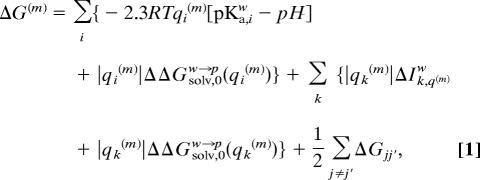 |
where m designates the vector of the charged states of the given configuration, i.e., m = (q1(m), q2(m) . . . . . qn(m)). i runs over the site of proton donors and acceptors, k runs over the sites of electron donor and acceptors, and j runs over both the i and k series. Here qi(m) is the actual charge of the ith group at the mth configuration. This value can be 0 or −1 for acids and 0 or 1 for bases (where we for simplicity restrict our formulation to mono ions). pKa,iw is the pKa value of the ith amino acid in water and ΔIk,qw is the free energy of forming the charged form of the kth group from its uncharged form in solution (this free energy is obtained from the corresponding reduction potential). The ΔGjj′ term represents the charge–charge interaction effect, and (ΔΔGsolv,0w→p(qi)) represents formally the energy of moving qi from water to its actual protein site when all other ionizable groups are neutral.
The most crucial term in the above expression is the ΔΔGsolv solvation term. This term is evaluated by the linear response approximation (LRA) version of the semimacroscopic protein dipoles Langevin dipole model (PDLD/S). Because this approach, the PDLD/S-LRA, has been used in studies of pKa values and reduction potentials in proteins and discussed extensively elsewhere (e.g., refs. 23, 29, and 30), it will not be addressed here. The ΔGjj′ interaction term is evaluated by using a distance-dependent effective dielectric constant that has been found to give reliable results in protein interiors (see discussion in ref. 23). In principle we can evaluate the free energy functions for each transfer by the EVB microscopic simulations and run time-dependent simulations using a simplified EVB/LD model (22). Here, however, we are mainly interested in the energetics, and thus we can use a semiquantitative estimate for each step. For example, when the transfer from m to m′ involves only one PT or one ET the activation energy is given by (19)
 |
where ΔGm,m′ is the free energy change for transfer between state m and m′, and λm,m′ is the corresponding reorganization energy [which can be evaluated as described elsewhere (25)]. Hm,m′ is the off-diagonal element that mixes the states m and m′. This term is taken as the EVB coupling term for PT between a donor and acceptor and the relevant coupling term (the tunneling matrix element) for an ET step. The proper coupling also can be evaluated for a concerted PT and for an ET/PT process.
The rate constant for each step is obtained by using transition state theory (see, e.g., ref. 25) for adiabatic PT steps and the semiclassical treatment of diabatic ET (see, e.g., ref. 31) for the ET steps. That is, we use
where A is kBT/h for PT reactions and the proper diabatic preexponential factor, which is proportional to Hm,m′2 for ET reactions.
The second element in our approach consists of simulating the time evolution of the system by using the previous state energies and activation barriers. As discussed in the introduction, this simulation constitutes a compromise between use of master equation and the explicit use of the Langevin dynamics approach that provides sufficiently reliable time dependence while overcoming the time scales problem. Our approach is based on a MC procedure that considers the effective potential defined by the ΔGm,m′ of Eq. 1 and the Δg‡ of Eq. 3 (see ref. 22 for a more explicit definition of this potential) and then scales the MC moves in a way that they reproduce the rate constants of Eq. 4. The use of MC for studies of rate processes is clearly not new (see, e.g., refs. 32–35). However, the application of this approach in studies of PTR processes is previously undescribed and very useful. That is, to apply the MC scheme in time-dependent simulations, it is essential to have a clear description of the activation barriers and the elementary time steps, which have not been introduced in previous studies of PTR in proteins or solutions. To clarify our approach, let us start with the migration of a single proton from a site i along a network of proton acceptors. To simulate this process, we consider random jumps of the proton to any possible site but accept only jumps to sites i − 1, i, and i + 1 (or in the more general case to sites that are closer than 3.5 Å from site i). Furthermore, these jumps are accepted only if they satisfy the standard MC criterion when either
or if the energy of the new configuration is higher than the previous one, when
where R is a random number between zero and one. Here, we use the notation ΔGn+1′ to represent the fact that in principle we should consider the activation barrier Δgn→n+1‡ rather than ΔGn+1′ − ΔGn (see below). The MC procedure is converted to time-dependent simulation by exploiting the isomorphism between the probability obtained from the MC procedure and the probability factor of Eq. 3. That is, because the probability of the MC jump satisfies the Boltzmann probability of Eq. 3 we can write
where τi→j is the real time required for a move from site i to site j and Ni→j is the number of MC steps that were required for this move. The factor S is given here by
where 0.165 is the average time, in picoseconds, it takes for a productive trajectory to reach the TS at room temperature (see, e.g., ref. 25). The factor δ represents the solute and solvent reorganization barrier for a transfer between states of similar energy, i.e., δ = Δgn→n+1‡ − ΔGn→n+1 (for endothermic steps). In this study we use an effective δ of 2 kcal/mol, which is reasonable for transfers where the donor and acceptor are comparatively close (19). This type of treatment allows us to use the actual ΔGn+1 rather than Δgn→n+1‡ in Eq. 5. At any rate, using Eqs. 4–7 guarantees that the rate of the PT steps will follow Eq. 3.
The simulation of ET steps can be performed in the same way as the PT simulation steps, but requires a different S that introduces a nonuniform time scale. Thus, we choose to keep SPT as our uniform time step also for the ET processes and to introduce the corresponding correction by modifying (ΔGn+1′ − ΔGn) of Eq. 5 to
 |
This treatment allows us to use Eq. 6 also for ET processes and still guarantees that τi→j will correspond to the rate constant for the ET process. In the present case, we took AET−1 as 104 ps for the ET from heme a to heme a3 (this value expresses our conservative estimate based on the discussion in refs. 36–38). Now with Eqs. 5–8 the probability of barrierless ET is exp{−ln(AET−1/0.165)} = 0.165/AET−1, so that 〈Ni→j〉 ≈ APT−1/0.165, and thus 〈τ〉 is ≈104 ps. Of course, Δg‡ can make the process slower.
In the general case of a system with many protons and electrons, we basically follow the same philosophy. That is, we start with a chain of protonation sites and redox sites, defined by water molecules and other feasible proton donors and acceptors as well as by the electron acceptors that participate in the coupled PT/ET process (see Fig. 2 for the system used in the present work). We then assign the initial proton and electron configuration and perform MC moves according to Eqs. 4 and 5 and the ΔG of Eq. 1. However, we restrict the PT to only include sites that are <3.5 Å and ET to sites that are <21.5 Å away. As in the single proton case considered above, we determined the time dependence according to Eq. 6. However, in this case, we must consider the fact that each of our MC moves involves all of the particles in the system. Thus, when we consider the movement of the ith particle, we should account for the fact that each of the other particles (j ≠ i) can move to mj sites (typically m = 3, which corresponds to a moving a particle to the left, to the right, and to keeping it at the same site). Now, because some of these moves are excluded due to energy considerations, we should normalize SPT by a factor L (S → S/L) where the average L can be approximated by
 |
Here, n is the number of particles, and pj is the probability that a move out of the jth site will be accepted (note that if this move is excluded because of the energy of the jth particle, we also have to exclude the move of the ith particle). Thus, if all particles are free to move, L = 1. However, typically m = 3 and 〈p〉 = 0.2, so that for a system with 3 protons 〈L〉 ≈ 10. More exact treatment is left to a subsequent work.
The present work generates productive trajectories from W1 without simulating the population of W1. Thus, the overall average time, τ, of trajectories that start in the bulk on the (N) side and move to Prd is given by
where p(W1) is the probability that a proton will reach W1, and τ(W1) is the average time for the MC trajectory that starts from W1 and moves forward.
The pKa values were evaluated by the semimacroscopic protein dipoles Langevin dipole model (PDLD/S)–linear response approximation (LRA) approach (23) and averaged over 50 protein configurations, which were obtained at each 1 ps from a 50-ps molecular dynamics simulation. The simulations used the ENZYMIX force field of the molaris program package (39) and a step size of 0.5 fs. The redox difference between heme a and heme a3 was taken as −40 mV (37) for the case where the proton is still in the D-channel, and λ was taken as 17 kcal/mol (19). The effect from the PTR on the difference in redox potential was taken into account during the simulation by the ΔGjj′ term of Eq. 1.
As mentioned previously, the validity of our simulation approach has been verified by detailed studies of PTR along a chain of six water molecules in water, where the proton potential on is identical on sites 1, 2, 5, and 6 and is gradually increased on sites 3 and 4. Using this test system allows one to explore the dependence of the PTR transfer time on the free energy barrier (see related study in ref. 22). The simulated results (Fig. 7) yielded an excellent agreement between the simulated rates and the rates predicted by Eq. 6.
Supplementary Material
Acknowledgments
We thank Prof. Wikstrom for introducing us to this challenging problem and Prof. Siegbahn for inspiring discussions. This work was supported by National Institutes of Health Grant R01 GM 40283.
Abbreviations
- COX
cytochrome c oxidase
- ET
electron transfer
- PT
proton transfer
- EVB
empirical valence bond
- MC
Monte Carlo
- PTR
proton translocation.
Footnotes
Conflict of interest statement: No conflicts declared.
This paper was submitted directly (Track II) to the PNAS office.
As already established in our previous work (12), the stepwise transfer involves an unrealistically large activation barrier to be consistent with experimental observations. E286 was also found to be protonated during the entire 23-μs simulation.
References
- 1.Wikstrom M. K. F. Nature. 1977;266:271–273. doi: 10.1038/266271a0. [DOI] [PubMed] [Google Scholar]
- 2.Michel H., Behr J., Harrenga A., Kannt A. Annu. Rev. Biophys. Biomol. Struct. 1998;27:329–356. doi: 10.1146/annurev.biophys.27.1.329. [DOI] [PubMed] [Google Scholar]
- 3.Mills D. A., Ferguson-Miller S. Biochim. Biophys. Acta. 2002;1555:96–100. doi: 10.1016/s0005-2728(02)00261-x. [DOI] [PubMed] [Google Scholar]
- 4.Ostermeier C., Harrenga A., Ermler U., Michel H. Proc. Natl. Acad. Sci. USA. 1997;94:10547–10553. doi: 10.1073/pnas.94.20.10547. [DOI] [PMC free article] [PubMed] [Google Scholar]
- 5.Yoshikawa S., Shinzawa-Itoh K., Nakashima R., Yaono R., Yamashita E., Inoue N., Yao M., Fei M. J., Libeu C. P., Mizushima T., et al. Science. 1998;280:1723–1729. doi: 10.1126/science.280.5370.1723. [DOI] [PubMed] [Google Scholar]
- 6.Ferguson-Miller S., Babcock G. T. Chem. Rev. 1996;96:2889–2907. doi: 10.1021/cr950051s. [DOI] [PubMed] [Google Scholar]
- 7.Brzezinski P., Larsson G. Biochim. Biophys. Acta. 2003;1605:1–13. doi: 10.1016/s0005-2728(03)00079-3. [DOI] [PubMed] [Google Scholar]
- 8.Mills D. A., Ferguson-Miller S. FEBS Lett. 2003;545:47–51. doi: 10.1016/s0014-5793(03)00392-2. [DOI] [PubMed] [Google Scholar]
- 9.Namslauer A., Brzezinski P. FEBS Lett. 2004;567:103–110. doi: 10.1016/j.febslet.2004.04.027. [DOI] [PubMed] [Google Scholar]
- 10.Pawate A. S., Morgan J., Namslauer A., Mills D., Brzezinski P., Ferguson-Miller S., Gennis R. B. Biochemistry. 2002;41:13417–13423. doi: 10.1021/bi026582+. [DOI] [PubMed] [Google Scholar]
- 11.Siegbahn P. E. M., Blomberg M. R. A., Blomberg M. L. J. Phys. Chem. B. 2003;107:10946–10955. [Google Scholar]
- 12.Olsson M. H. M., Sharma P. K., Warshel A. FEBS Lett. 2005;579:2026–2034. doi: 10.1016/j.febslet.2005.02.051. [DOI] [PubMed] [Google Scholar]
- 13.Olkhova E., Helms V., Michel H. Biophys. J. 2005;89:2324–2331. doi: 10.1529/biophysj.105.062091. [DOI] [PMC free article] [PubMed] [Google Scholar]
- 14.Wikstrom M., Verkhovsky M. I., Hummer G. Biochim. Biophys. Acta. 2003;1604:61–65. doi: 10.1016/s0005-2728(03)00041-0. [DOI] [PubMed] [Google Scholar]
- 15.Olkhova E., Hutter M. C., Lill M. A., Helms V., Michel H. Biophys. J. 2004;86:1873–1889. doi: 10.1016/S0006-3495(04)74254-X. [DOI] [PMC free article] [PubMed] [Google Scholar]
- 16.Hofacker I., Schulten K. Proteins. 1998;30:100–107. [PubMed] [Google Scholar]
- 17.Xu J. C., Voth G. A. Proc. Natl. Acad. Sci. USA. 2005;102:6795–6800. doi: 10.1073/pnas.0408117102. [DOI] [PMC free article] [PubMed] [Google Scholar]
- 18.Popovic D. M., Quenneville J., Stuchebrukhov A. A. J. Phys. Chem. B. 2005;109:3616–3626. doi: 10.1021/jp046535m. [DOI] [PubMed] [Google Scholar]
- 19.Sham Y., Muegge I., Warshel A. Proteins. 1999;36:484–500. [PubMed] [Google Scholar]
- 20.Warshel A. Photochem. Photobiol. 1979;30:285–290. doi: 10.1111/j.1751-1097.1979.tb07148.x. [DOI] [PubMed] [Google Scholar]
- 21.Burykin A., Warshel A. Biophys. J. 2003;85:3696–3706. doi: 10.1016/S0006-3495(03)74786-9. [DOI] [PMC free article] [PubMed] [Google Scholar]
- 22.Braun-Sand S., Strajbl M., Warshel A. Biophys. J. 2004;87:2221–2239. doi: 10.1529/biophysj.104.043257. [DOI] [PMC free article] [PubMed] [Google Scholar]
- 23.Schutz C. N., Warshel A. Proteins. 2001;44:400–417. doi: 10.1002/prot.1106. [DOI] [PubMed] [Google Scholar]
- 24.Wikstrom M., Ribacka C., Molin M., Laakkonen L., Verkhovsky M., Puustinen A. Proc. Natl. Acad. Sci. USA. 2005;102:10478–10481. doi: 10.1073/pnas.0502873102. [DOI] [PMC free article] [PubMed] [Google Scholar]
- 25.Warshel A. Computer Modeling of Chemical Reactions in Enzymes and Solutions. New York: Wiley; 1991. [Google Scholar]
- 26.Lu D., Voth G. A. J. Am. Chem. Soc. 1998;120:4006–4014. [Google Scholar]
- 27.Vuilleumier R., Borgis D. Chem. Phys. Lett. 1998;284:71–77. [Google Scholar]
- 28.Warshel A., Schlosser D. W. Proc. Natl. Acad. Sci. USA. 1981;78:5564–5568. doi: 10.1073/pnas.78.9.5564. [DOI] [PMC free article] [PubMed] [Google Scholar]
- 29.Churg A. K., Warshel A. Biochemistry. 1986;25:1675–1681. doi: 10.1021/bi00355a035. [DOI] [PubMed] [Google Scholar]
- 30.Muegge I., Qi P. X., Wand A. J., Chu Z. T., Warshel A. J. Phys. Chem. B. 1997;101:825–836. [Google Scholar]
- 31.Warshel A., Hwang J. K. J. Chem. Phys. 1986;84:4938–4957. [Google Scholar]
- 32.Gillespie D. T. J. Comp. Phys. 1976;22:403–434. [Google Scholar]
- 33.Hattne J., Fange D., Elf J. Bioinformatics. 2005;21:2923–2924. doi: 10.1093/bioinformatics/bti431. [DOI] [PubMed] [Google Scholar]
- 34.Henkelman G., Jonsson H. J. Chem. Phys. 2001;115:9657–9666. [Google Scholar]
- 35.Mukherjee D., Sonwane C. G., Zachariah M. R. J. Chem. Phys. 2003;119:3391–3404. [Google Scholar]
- 36.Tan M. L., Balabin I., Onuchic J. N. Biophys. J. 2004;86:1813–1819. doi: 10.1016/S0006-3495(04)74248-4. [DOI] [PMC free article] [PubMed] [Google Scholar]
- 37.Brzezinski P. Biochemistry. 1996;35:5611–5615. doi: 10.1021/bi960260m. [DOI] [PubMed] [Google Scholar]
- 38.Regan J. J., Ramirez B. E., Winkler J. R., Gray H. B., Malmstrom B. G. J. Bioenerg. Biomembr. 1998;30:35–39. doi: 10.1023/a:1020551326307. [DOI] [PubMed] [Google Scholar]
- 39.Lee F. S., Chu Z. T., Warshel A. J. Comp. Chem. 1993;14:161–186. [Google Scholar]
Associated Data
This section collects any data citations, data availability statements, or supplementary materials included in this article.


