

Abstract
Context
The health and policy implications of the marked regional variations in intensity of invasive compared with medical management of patients with acute myocardial infarction (AMI) are unknown.
Objectives
To evaluate patient clinical characteristics associated with receiving more intensive treatment; and to assess whether AMI patients residing in regions with more intensive invasive treatment and management strategies have better long-term survival than those residing in regions with more intensive medical management strategies.
Design, Setting, and Patients
National cohort study of 158 831 elderly Medicare patients hospitalized with first episode of confirmed AMI in 1994–1995, followed up for 7 years (mean, 3.6 years), according to the intensity of invasive management (performance of cardiac catheterization within 30 days) and medical management (prescription of β-blockers to appropriate patients at discharge) in their region of residence. Baseline chart reviews were drawn from the Cooperative Cardiovascular Project and linked to Medicare health administrative data.
Main Outcome Measure
Long-term survival over 7 years of follow-up.
Results
Patient baseline AMI severity was similar across regions. In all regions, younger and healthier patients were more likely than older high-risk patients to receive invasive treatment and medical therapy. Regions with more invasive treatment practice styles had more cardiac catheterization laboratory capacity; patients in these regions were more likely to receive interventional treatment, regardless of age, clinical indication, or risk profile. The absolute unadjusted difference in 7-year survival between regions providing the highest rates of both invasive and medical management strategies and those providing the lowest rates of both was 6.2%. For both ST- and non–ST-segment elevation AMI patients, survival improved with regional intensity of both invasive and medical management. In areas with higher rates of medical management, there appeared to be little or no improvement in survival associated with increased invasive treatment.
Conclusions
In elderly Medicare patients with AMI, more intensive medical treatment provides population survival benefits. However, routine use of more costly and invasive treatment strategies may not be associated with an overall population benefit beyond that seen with excellent medical management. Efforts should focus on directing invasive clinical resources to patients with the greatest expected benefit.
More than 280 000 Medicare enrollees are admitted to hospitals with acute myocardial infarction (AMI) annually.1 These patients face a high risk of short-term death: 18% die within 30 days of admission. Much of the effort to reduce this high mortality rate has focused on invasive diagnostic and therapeutic interventions. A recent quantitative review of randomized trials comparing primary angioplasty with thrombolytic therapy in ST-segment elevation myocardial infarction (STEMI) patients demonstrated long-term survival benefit in the more invasively treated group.2 Randomized trials comparing early invasive with conservative strategies in non–ST-segment elevation myocardial infarction (NSTEMI) patients demonstrated mixed survival results but improved cardiac morbidity.3–7 Evidence suggests that invasive management strategies primarily benefit elderly or high-risk patients and may not be warranted in lower-risk patients.8–11 However, in practice these interventions have been primarily directed to younger, lower-risk patients.12
Noninvasive, inexpensive, medical management, including aspirin, angiotensin-converting enzyme inhibitors, and β-blockers, as well as thrombolysis, reduces mortality following AMI.13 Substantial variation in use of these evidence-based medications across regions1,14–18 and health plans19 following AMI, as well as underuse,16,20 have been well documented. High-risk patients who are most likely to gain from these services are less likely to receive therapy,20 although recent improvements have been published.18
See also p 1383.
Studies have found tremendous variability in the intensity of invasive diagnostic and therapeutic treatment of AMI patients across regions,1,14,21–27 health plans,28,29 and hospitals,30–33 which is not explained by patient AMI severity.1,27,34,35 Most studies found no relationship between greater use of coronary angiography and mortality,14,22,24,30,32 although some found a reduction27,31 and others23,33 found an increase in mortality. These studies were from selected populations in limited geographic regions, mostly using data lacking clinical detail, and did not compare the population-based effects of routine invasive with medical strategies in AMI patients.
Randomized trials are performed under ideal conditions on selected populations and may not necessarily translate into a similar magnitude of benefit in the general population. To investigate the long-term population impact of greater regional intensity of cardiac management, we addressed the following questions: Do patient clinical characteristics explain the differences in intensity of provision of different types of cardiac services across regions? In regions with higher treatment intensity, do patients who are more likely to benefit receive more treatment? Finally, do AMI patients residing in regions with more intensive invasive management strategies have better long-term mortality than those in regions with more intensive medical strategies?
METHODS
Design Overview
Observational studies comparing the benefits of patient-level treatment are often confounded by selection bias in terms of who receives treatment, particularly invasive treatment. Those who receive treatment are generally younger and healthier and may differ in unobserved ways from those who do not receive treatment.12,27 Multivariable risk-adjustment or propensity score methods analyzing patient-level treatment may not remove this bias.27,36
The effect of regional treatment intensity is less prone to such bias because admission severity of elderly hospitalized AMI patients tends to be relatively similar across areas.1,34,35 We used the natural experiment of “assignment” of patients to regional, “treatment groups” of differing AMI management intensity to assess post-AMI outcomes and treatment. We demonstrate that AMI severity was similar at baseline across regions, but that subsequent treatment type and regional treatment intensity were dramatically different.
Study Cohort
The study cohort was drawn from the Cooperative Cardiovascular Project (CCP), a US national sample of 234 754 Medicare enrollees hospitalized with first admission for AMI (International Classification of Diseases, Ninth Revision, Clinical Modification 410, excluding fifth digit 2) in nonfederal acute care hospitals during 1994 and 1995.37 The CCP included clinical data systematically abstracted from medical records during the admission, including presentation characteristics, comorbidities, in-hospital treatments, and outcomes. The CCP records were linked to Medicare health administrative files to follow-up patients for 7 years (patients were followed up for 7 years unless they died) for vital status and post-admission diagnoses and procedures, and to exclude those with AMI in the prior year, as in previous studies.34,35
Confirmed AMI was defined as elevated creatine kinase-MB or elevated lactate dehydrogenase with the first lactate dehydrogenase level being higher than the second lactate dehydrogenase level measured; or 2 of the following: chest pain, 2-fold elevation of creatine kinase, or electrocardiographic evidence of AMI. The AMIs were classified as (1) NSTEMI, which was defined as non–Q-wave or subendocardial AMI, or (2) STEMI. We further restricted patients to those who were aged 65 to 99 years, who were eligible for Medicare part A and B, and who were not enrolled in a health maintenance organization at the index admission.
The study obtained institutional review board approval through the Centers for Medicare & Medicaid Services review process. No informed consent was obtained. Race was coded as black or nonblack using Medicare Denominator File data.
Area-Level Exposures
Using traditional methods of small area analysis, we defined 589 coronary angiography service areas (CASAs) as discrete geographic regions describing the delivery of cardiac diagnostic services,1,21 and computed numbers of cardiac catheterization laboratories per 100 000 area residents for each CASA.1 Each study patient was assigned to a CASA based on his/her ZIP code of residence.
Area-level invasive treatment intensity was computed as the 30-day rate of cardiac catheterization among eligible patients. Eligibility was defined as American College of Cardiology and American Heart Association class I (ideal) or II (uncertain),13 and coded as in previous CCP studies.28 Using linked CCP-Medicare data, we identified all cardiac catheterizations performed within 30 days of admission for eligible patients.
For each CASA, cardiac catheterization intensity was defined as the number of eligible study patients receiving cardiac catheterization within 30 days divided by the number of eligible study patients residing in the CASA.
We used rate of prescription of β-blockers at discharge among β-blocker–appropriate patients as the indicator of area-level medical management intensity. β-Blocker–appropriate patients were those discharged alive and not transferred out of the index hospital, in whom β-blockers were not contraindicated.37 To minimize confounding by indication, those ineligible for β-blockers were not used in the exposure definition, but were used in outcomes assessment. For each CASA, the area-level β-blocker intensity was defined as the number of appropriate patients receiving a β-blocker at discharge divided by the number of β-blocker–appropriate patients residing in the CASA.
Patients living in CASAs with fewer than 10 cardiac catheterization–appropriate patients or β-blocker–appropriate patients were excluded, resulting in a final study cohort of 158 831 patients residing in 566 CASAs. Area-level rates were indirectly adjusted for differences in age, sex, and race. Adjusted rates were categorized according to quintiles, using the CASA study population. Patients were assigned to the quintiles of regional invasive intensity and regional medical management intensity according to their region of residence.
Patient Follow-up and Outcomes
Each patient was followed up from date of AMI admission (index event) through December 31,2001. More than half of the cohort was followed up for 3.6 years. Date of death was obtained from the Medicare enrollment database. Data regarding post-AMI diagnostic cardiac catheterizations and revascularization procedures were obtained from Medicare part A and B claims data.
Statistical Analysis
All analyses used the patient as the unit of analysis and regional management intensity as the exposure measure. Based on Cox proportional hazards modeling, we developed an AMI severity index to predict 1 -year mortality risk including baseline patient characteristics of age, sex, race, and their interactions, socioeconomic status, comorbidities, and clinical presentation (c statistic=0.77).38 Mean predicted mortality was used as the summary measure of regional patient AMI severity because it incorporated all measured patient risk factors. We used a logistic regression test for trend to assess whether baseline characteristics were related to regional treatment intensity of cardiac catheterization and β-blocker use, measured as continuous variables.
Cox proportional hazards models were used to compare rates of mortality among cardiac catheterization-eligible patients across cardiac catheterization and β-blocker intensity regions, censoring when a patient moved from the region. We reasoned that benefits from invasive therapy would be strongest in those eligible for cardiac catheterization. Separate models were run for NSTEMI and STEMI patients. All models adjusted for 62 patient, hospital, and ZIP code socioeconomic characteristics associated with post-AMI mortality. Patient characteristics included age, sex, race, and their interactions; presentation characteristics included AMI location, atrial fibrillation, heart block, congestive heart failure, hypotension, shock, peak creatinine kinase level of higher than 1000 U/L, and cardiopulmonary resuscitation; comorbidities included history of congestive heart failure, dementia, diabetes, hypertension, metastatic cancer, nonmetastatic cancer, low-ejection fraction, peripheral vascular disease, angina, and smoking; preadmission status included ambulatory status and admission from nursing home; hospital characteristics included annual AMI volume and teaching status; and ZIP code socioeconomic characteristics included median social security income and percentage of patients in a Medicare health maintenance organization. Effects were assessed using (1) quintiles of combined regional intensity of medical and invasive management, and (2) stratum-specific estimates of the effect of each management style (as a continuous variable), stratified by quintiles of regional intensity of the other management style. Because patients admitted to the same hospital may have correlated outcomes, we used survival models that incorporated this clustering by hospital to adjust the SEs appropriately.39 Model fit and proportionality of hazards were assessed using residual analyses.40,41 All analyses were performed using STATA statistical software (version 5.0, STATA Corp, College Station, Tex); the level of significance used was α = .05 and P values were 2-sided.
RESULTS
Although there were differences in age and specific risk factors, overall baseline AMI severity was similar across regions (Table 1 and Table 2). Mean predicted 1-year mortality risk was slightly lower (30.8%) in the highest-intensity cardiac catheterization region compared with the lowest-intensity cardiac catheterization region (32.6%); it was slightly lower (31.7%) in the lowest quintile of area-level β-blocker prescription compared with the highest-intensity β-blocker region (32.3%). Patients in high-intensity β-blocker prescription and low-intensity cardiac catheterization regions were slightly older and had a higher mortality risk. Patients in low-intensity β-blocker prescription and high-intensity cardiac catheterization regions were slightly younger and had a lower mortality risk. These differences were small and did not demonstrate consistently higher AMI severity burden in higher-intensity β-blocker and cardiac catheterization regions (Table 1 and Table 2). There were 40% more cardiac catheterization laboratories in the highest compared with lowest cardiac catheterization regions (1.34 vs 0.96 per 100 000 residents) and 16% fewer in the highest compared with lowest β-blocker prescription regions (1.06 vs 1.26 per 100 000 residents).
Table 1.
Select Patient Characteristics According to Area-Level Cardiac Catheterization Rate*
| Quintile of Area-Level Cardiac Catheterization Rate
|
||||||
|---|---|---|---|---|---|---|
| Q1 (Lowest) (n = 32 799) | Q2 (n = 31 413) | Q3 (n = 32 082) | Q4 (n=31 329) | Q5 (Highest) (n = 31 208) | P for Trend | |
| Cardiac catheterization laboratories† | 0.96 | 1.11 | 1.24 | 1.22 | 1.34 | |
| Predicted 1-year mortality (AMI severity) | 32.6 | 32.3 | 32.0 | 31.8 | 30.8 | <.001 |
| Demographic and social characteristics | ||||||
| Age 65–74 y | 43.3 | 44.7 | 45.0 | 45.7 | 46.2 | <.001 |
| Male sex | 49.8 | 50.5 | 51.3 | 51.9 | 52.9 | <.001 |
| Black race | 4.0 | 7.8 | 5.9 | 5.5 | 5.3 | .06 |
| Social Security income <$1700/mo | 15.1 | 18.2 | 19.7 | 20.7 | 20.9 | <.001 |
| Comorbidities | ||||||
| Previous myocardial infarction | 30.2 | 29.9 | 29.5 | 29.0 | 27.2 | <.001 |
| Previous revascularization | 14.3 | 16.3 | 18.5 | 17.8 | 19.6 | <.001 |
| Congestive heart failure | 22.3 | 21.9 | 21.3 | 20.8 | 18.9 | <.001 |
| Diabetes | 31.6 | 30.9 | 30.9 | 29.9 | 29.0 | <.001 |
| AMI clinical presentation characteristics | ||||||
| Non–ST-segment elevation | 40.0 | 41.1 | 40.1 | 38.9 | 38.6 | <.001 |
| Hypotension | 3.8 | 3.8 | 3.8 | 3.8 | 3.8 | .82 |
| Peak creatinine kinase >1000 U/L | 30.2 | 30.6 | 30.4 | 31.7 | 32.3 | <.001 |
| Indication for cardiac catheterization‡ | ||||||
| Class I (ideal) | 62.6 | 64.7 | 64.1 | 64.8 | 64.4 | <.001 |
| Class II (uncertain) | 24.7 | 23.6 | 24.1 | 23.3 | 23.8 | .008 |
| Class III (not indicated) | 12.6 | 11.7 | 11.8 | 11.9 | 11.8 | .002 |
| Appropriate for β-blocker use at discharge§ | 51.5 | 52.1 | 51.8 | 52.1 | 52.8 | <.001 |
Abbreviation: AMI, acute myocardial infarction.
Values in table are percentages unless otherwise indicated.
Per 100 000 residents, indirectly adjusted for age and sex.
Classification system according to the American College of Cardiology and American Heart Association.
Among patients discharged alive and not transferred.
Table 2.
Select Patient Characteristics According to Area-Level Discharge β-Blocker Rate*
| Quintile of Area-Level Discharge β-Blocker Rate
|
||||||
|---|---|---|---|---|---|---|
| Q1 (Lowest) (n = 30 940) | Q2 (n = 32 134) | Q3 (n = 32 023) | Q4 (n = 31 580) | Q5 (n = 32 154) | P Value | |
| Cardiac catheterization laboratories† | 1.26 | 1.17 | 1.25 | 1.15 | 1.06 | NA |
| Predicted 1 -year mortality (AMI severity) | 31.7 | 31.8 | 31.8 | 32.0 | 32.3 | <.001 |
| Demographic and social characteristics | ||||||
| Age 65–74 y | 46.2 | 45.2 | 45.1 | 45.2 | 43.1 | <.001 |
| Male sex | 52.0 | 51.8 | 51.2 | 51.4 | 49.8 | <.001 |
| Black race | 7.1 | 6.1 | 4.2 | 7.0 | 4.1 | <.001 |
| Social Security income <$1700/mo | 22.4 | 23.7 | 18.2 | 16.5 | 13.8 | <.001 |
| Comorbidities | ||||||
| Previous myocardial infarction | 27.2 | 28.6 | 29.6 | 29.7 | 30.7 | <.001 |
| Previous revascularization | 18.8 | 17.6 | 17.4 | 17.0 | 15.6 | <.001 |
| Congestive heart failure | 19.9 | 20.8 | 20.8 | 21.5 | 22.3 | <.001 |
| Diabetes | 29.4 | 29.7 | 30.8 | 31.2 | 31.2 | <.001 |
| AMI clinical presentation characteristics | ||||||
| Non–ST-segment elevation | 38.0 | 37.9 | 40.3 | 40.7 | 42.0 | <.001 |
| Hypotension | 3.9 | 3.8 | 3.9 | 3.8 | 3.6 | .09 |
| Peak creatinine kinase >1000 U/L | 32.4 | 31.9 | 31.1 | 30.8 | 29.0 | <.001 |
| Indication for cardiac catheterization‡ | ||||||
| Class I (ideal) | 63.8 | 64.3 | 64.5 | 64.4 | 63.6 | .38 |
| Class II (uncertain) | 24.3 | 23.8 | 23.7 | 24.0 | 24.0 | .63 |
| Class III (not indicated) | 12.0 | 11.9 | 11.8 | 11.7 | 12.4 | .05 |
| Appropriate for β-blocker use at discharge§ | 52.5 | 51.5 | 51.5 | 53.3 | 51.5 | .003 |
Abbreviations: AMI, acute myocardial infarction; NA, comparison not appropriate.
Values in table are percentages unless otherwise indicated.
Per 100 000 residents, indirectly adjusted for age and sex.
Classification system according to the American College of Cardiology and American Heart Association.
Among patents discharged alive and not transferred.
Use of cardiac catheterization ranged from 29% to 93% across the 566 CASAs (mean, 49%). Younger and lower-risk patients had a higher likelihood of receiving cardiac catheterization (Table 3). For every subgroup, the proportion receiving cardiac catheterization within 30 days increased with area-level cardiac catheterization intensity (P<.001 for every subgroup) and was on average 1.58-fold higher (95% confidence interval [CI], 1.55–1.60) in the highest vs lowest rate regions.
Prescription of β-blockers at discharge among patients discharged alive and not transferred (n = 102 573) ranged from 5% to 93% across the 566 CASAs (mean, 39%). Younger and lower-risk patients were more likely to receive a prescription for β-blockers (Table 4). There was underuse of β-blockers in patients eligible for β-blocker use. For every subgroup, the proportion receiving a prescription for β-blockers at discharge increased with area-level β-blocker intensity (P<.001 for every subgroup) and was on average 1.95-fold higher. (95% CI, 1.88–2.01) in the highest compared with lowest rate regions.
About 80% of patients received an aspirin prescription at discharge in all regions. In the highest-rate cardiac catheterization region, the likelihood of receiving a revascularization procedure within 30 days was 76% higher and the likelihood of receiving a prescription for β-blockers or angiotensin-converting enzyme inhibitors at discharge was 12% lower than in the lowest-rate cardiac catheterization region. In the highest β-blocker region, the likelihood of receiving a revascularization procedure within 30 days was 16% lower than in the lowest-rate β-blocker prescription region, but about twice as many appropriate candidates received β-blockers and 16% more received angiotensin-converting enzyme inhibitors.
During a mean follow-up of 3.6 years, there were 99 006 deaths (40 648 among patients with NSTEMI and 58358 among STEMI patients). Survival was best among patients in regions providing the highest rates of cardiac catheterization and β-blocker prescription and worst among patients in regions providing the lowest rates of both (Figure). The absolute unadjusted overall difference in survival at 7 years between these 2 regional groups was 6.2%. The absolute survival difference for cardiac catheterization-eligible NSTEMI patients was 10.4% and for STEMI was 5.4%.
For both NSTEMI and STEMI cardiac catheterization-eligible patients, mortality was lower in regions with higher intensity invasive and medical management styles (Table 5). There was a clear gradient in improved survival from regions with the lowest (upper left) to highest (bottom right) combined intensity of both management styles. However, strong interactive effects were found between the 2 regional management styles (P<.001). Improvements in survival associated with increased regional medical management were seen at all levels of invasive management intensity, but were strongest in regions with the lowest invasive management intensity (cardiac catheterization quintile 1) (P for trend <.001). The strongest improvements in survival associated with invasive management were in regions with the lowest intensity of medical management (β-blocker quintiles 1 and 2; P for trend <.01 for NSTEMI; P for trend <.001 for STEMI). There was no significant marginal improvement associated with increased invasive management in regions with the highest levels of medical management (β-blocker quintiles 3–5) for either NSTEMI or STEMI patients. The findings were similar when we analyzed 1- and 2-year follow-up post-AMI. There was slight non-proportionality of hazards in the first 6 months post-AMI in that regions that had both high-intensity cardiac catheterization and low-intensity β-blocker use had higher mortality rates than expected, possibly due to early mortality from revascularization.
COMMENT
We conducted a population-based cohort study of elderly AMI patients living in US regions with vastly different practice patterns to assess which patients received more intensive treatment, and to study their associations with long-term population mortality. Patient baseline AMI severity was similar across regions; however, treatment differed dramatically after onset of AMI. Regions with more cardiac catheterization laboratory capacity had a commensurately more intensive invasive management style and provided higher rates of cardiac catheterization to all patients, regardless of age, risk profile, or clinical presentation. Availability of cardiac technology and lower patient risk appeared to be the factors driving invasive treatment, as others have also found.12,31,32,34,35,42 The treatment-risk paradox, whereby the propensity to receive treatment is inversely related to expected patient improvement when it is provided to patients at lower risk, possibly due to physician misconceptions about benefit-harm tradeoffs or concerns about treatment complications, has been shown for other cardiovascular therapies.43,44 Our study confirmed that clinicians were more likely to provide invasive treatments to lower-risk than higher-risk patients in this population, despite evidence demonstrating that these treatments are associated with greater absolute improvements in older, higher-risk patients.8–11
Second, a more intensive medical management style was associated with improved survival regardless of the level of invasive management in the region; however, in regions with high medical management intensity, there appeared to be little or no marginal improvement associated with additional invasive treatment, as was also found by McClellan et al.27 Although clinical trials have demonstrated that more intensive use of cardiac technology may improve survival for specific AMI subgroups under ideal conditions,2 this strategy does not always translate into population benefit because clinical settings do not replicate the ideal conditions of the trial. First, even for ideal patients, the benefits of receiving invasive care may not be achievable in routine clinical practice, especially in lower volume settings with less experienced clinicians, or with long transfer times to a hospital with an onsite cardiac catheterization laboratory. Second, the benefits have not been demonstrated in different subgroups of patients with AMI, even though our study and others show that invasive strategies are being routinely used in these patients.12 Finally, underuse of invasive cardiac technology in patients at high risk who could benefit most, serves to dilute population effectiveness. For the vast majority of patients, these findings point to the need for caution about the routine use of cardiac technology in populations in which the marginal improvements may be small, when simpler, lower-cost, evidence-based medical alternatives exist.
The regional exposure used in this study is an example of an “instrumental variable”27,45 or a “natural experiment.” By definition, an instrumental variable is associated with regional treatment intensity, but not with attributes that might affect mortality, such as AMI severity. It is a device that attempts to achieve pseudo-randomization so that the estimated treatment effects are not confounded by unmeasured selection bias from healthier patients receiving cardiac catheterization. Our regional intensity exposures appear to have these properties. Similar designs were used by McClellan et al27 and Fisher et al34,35 to assess the effects of regional exposures on survival of chronic disease populations. These types of analyses estimate treatment effects on the marginal patient, defined as those who would receive the treatment in a higher but not in a lower-intensity area.
Careful interpretation of the effects of the area-level exposures is necessary. Area-level analyses do not imply that the entire effect of the management strategy derives from the specific exposures that were measured, that is, prescription of β-blockers at discharge or use of cardiac catheterization. Instead, they imply that the survival effect is attributable to any and all treatments provided to the residents of the area. In this study, we documented that regions with a more intensive invasive management style provided more revascularization and less medical management. Regions prescribing more β-blockers at discharge also provided more intensive medical therapeutics of all types at discharge and less revascularization. The survival improvements observed are the combined effects of general management strategies that emphasize particular types of care.
Several limitations should be considered. Our results might be confounded by unmeasured regional AMI severity differences, although this is unlikely because mean baseline AMI severity risk was similar across regions. The risk adjustors were based on a systematic chart review and encompassed a rich mixture of patient characteristics that strongly predict mortality. Data were not available on postdischarge medications, but inpatient initiation of post-AMI therapies is strongly related to postdischarge use.46–48 Second, this study is somewhat dated in that current AMI treatment strategies include primary angioplasty and routine use of statins. However, unlike primary angioplasty, revascularization in the convalescent phase of AMI is likely to show improvement only after longer-term follow-up. In addition, only a minority of patients are eligible for primary angioplasty so that increasing use of this therapy is unlikely to significantly affect population outcomes. Studies such as this are the only way to evaluate long-term survival effects of different treatment styles in actual practice settings because population benefit is often not apparent for many years.49 Finally, we could not examine the implications of regional treatment intensity on severity of angina, quality of life, and functional status post-MI.
Debate continues regarding the value of routine use of high technology treatment for cardiac patients.50–53 While AMI survival has improved compared with 30 years ago, invasive treatment and medical management are not optimal as practiced in the United States. Administration of evidence-based medications has improved since 1994–1995,16,18 but invasive management rates have increased as well. Therefore, the message from our study regarding the need to direct optimal treatments to patients with the greatest expected improvement may still be relevant. We recommend first, that a comprehensive, systems-minded approach to delivering evidence-based medical management to AMI patients be a national priority. Second, because health care resources should be provided in such a way as to maximize clinical improvement and efficiency of Medicare spending, continuous large-scale population-based evaluations of the long-term community effectiveness of expensive, invasive cardiac technology must also be a national priority. The stakes are high in terms of patient outcomes and health care spending.
Figure.
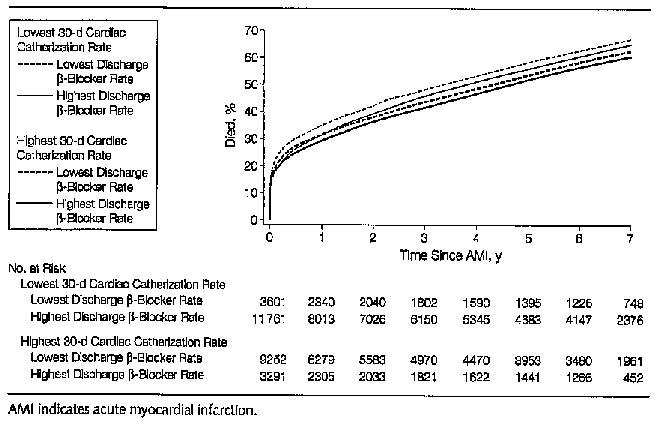
Kaplan-Meier Mortality Curves for the Overall AMI Population
Table 3.
Patients Receiving Cardiac Catheterization Within 30 Days According to Area-Level Cardiac Catheterization Rate*
| Quintile of Area-Level Cardiac Catheterization Rate
|
||||||
|---|---|---|---|---|---|---|
| Q1 (Lowest) (n = 32 799) | Q2 (n = 31 413) | Q3 (n = 32 082) | Q4 (n = 31 329) | Q5 (Highest) (n = 31 208) | Ratio of Q5 to Q1 (95% CI)† | |
| Overall population | 38.1 | 45.4 | 49.6 | 52.9 | 60.0 | 1.58 (1.55–1.60) |
| Demographic and social characteristics | ||||||
| Age, y | ||||||
| 65–74 | 56.6 | 63.8 | 68.3 | 71.5 | 77.6 | 1.37 (1.35–1.40) |
| 75–84 | 30.8 | 38.9 | 43.4 | 47.2 | 55.0 | 1.76 (1.73–1.84) |
| 85–99 | 6.7 | 9.5 | 10.7 | 12.3 | 17.3 | 2.59 (2.30–2.93) |
| Black race | 30.1 | 37.5 | 42.5 | 43.1 | 50.9 | 1.69 (1.54–1.86) |
| Comorbidities | ||||||
| Previous myocardial infarction | 35.4 | 41.5 | 44.4 | 48.1 | 54.9 | 1.55 (1.50–1.60) |
| Previous revascularization | 48.4 | 55.0 | 57.0 | 61.3 | 67.6 | 1.40 (1.35–1.44) |
| Congestive heart failure | 19.2 | 23.5 | 25.6 | 27.5 | 33.2 | 1.73 (1.63–1.84) |
| AMI clinical presentation characteristics | ||||||
| Non–ST-segment elevation | 38.4 | 45.4 | 48.6 | 51.4 | 58.0 | 1.51 (1.47–1.55) |
| ST-segment elevation | 22.7 | 26.8 | 30.1 | 32.9 | 37.6 | 1.66 (1.61–1.70) |
| Hypotension | 24.3 | 28.5 | 29.8 | 35.2 | 41.2 | 1.70 (1.51–1.91) |
| Predicted 1-year mortality risk | ||||||
| Low (0–17.9%) | 64.0 | 72.8 | 77.1 | 80.4 | 84.6 | 1.32 (1.30–1.34) |
| Medium (18%–36.9%) | 37.8 | 45.9 | 51.4 | 53.9 | 62.6 | 1.66 (1.61–1.71) |
| High(37%–100%) | 14.8 | 18.6 | 20.3 | 23.9 | 29.0 | 1.96 (1.86–2.07) |
| Indication for catheterization‡ | ||||||
| Class 1 (ideal) | 44.4 | 51.7 | 56.1 | 60.4 | 67.7 | 1.52 (1.50–1 .55) |
| Class II (uncertain) | 37.2 | 45.7 | 50.9 | 52.4 | 61.3 | 1.65 (1.59–1.70) |
| Class III (not indicated) | 8.2 | 9.8 | 11.4 | 13.0 | 15.4 | 1.88 (1.65–2.13) |
| Appropriate for β-blocker use at discharges§ | 34.3 | 42.3 | 48.9 | 53.3 | 62.2 | 1.81 (1.76–1.87) |
Abbreviations: AMI, acute myocardial infarction; CI, confidence interval.
Values in table are percentages unless otherwise indicated.
Relative rate of receiving therapy for patients residing in Q5 compared with Q1 regions. Computed using unadjusted logistic regression with a log link to estimate relative rates.
Classification system according to the American College of Cardiology and American Heart Association.
Among 102 573 patients discharged alive and not transferred.
Table 4.
Patients Receiving Discharge β-Blockers According to Area-Level Discharge β-Blocker Rate*
| Quintile of Area-Level Discharge β-Blocker Rate
|
||||||
|---|---|---|---|---|---|---|
| Q1 (Lowest) (n = 20 238) | Q2 (n = 20 723) | Q3 (n = 20 607) | 04 (n = 20 112) | Q5 (Highest) (n = 20 893) | Ratio of Q5 to Q1 {95% CI)† | |
| Overall population | 26.5 | 33.4 | 37.8 | 43.7 | 51.4 | 1.95 (1.90–3.00) |
| Demographic and social characteristics | ||||||
| Age, y | ||||||
| 65–74 | 29.7 | 37.5 | 42.5 | 49.1 | 58.1 | 1.95 (1.88–2.01) |
| 75–84 | 25.1 | 32.7 | 36.3 | 42.3 | 49.5 | 1.98 (1.90–2.07) |
| 85–99 | 20.5 | 23.1 | 28.4 | 32.6 | 39.9 | 1.96 (1.81–2.12) |
| Black race | 25.8 | 31.6 | 34.7 | 41.7 | 51.5 | 1.99 (1.80–2.21) |
| Comorbidities | ||||||
| Previous myocardial infarction | 24.8 | 30.3 | 34.8 | 40.1 | 48.8 | 1.97 (1.88–2.07) |
| Previous revascularization | 28.0 | 35.7 | 40.7 | 45.2 | 55.2 | 1.97 (1.86–2.08) |
| Congestive heart failure | 14.0 | 18.7 | 21.8 | 24.5 | 34.0 | 2.48 (2.29–2.70) |
| AMI clinical presentation characteristics | ||||||
| Non–ST-segment elevation | 25.4 | 30.9 | 35.2 | 41.5 | 49.6 | 1.98 (1.90–2.06) |
| ST-segment elevation | 16.9 | 21.7 | 23.7 | 26.9 | 30.6 | 1.81 (1.78–1.97) |
| Hypotension | 15.2 | 23.8 | 29.1 | 30.3 | 35.4 | 2.40 (1.91–3.07) |
| Predicted 1-year mortality risk | ||||||
| Low (0–1 7.9%) | 35.0 | 44.4 | 49.0 | 57.9 | 66.2 | 1.87 (1.81–1.93} |
| Medium (18%–36.9%) | 26.7 | 34.1 | 39.1 | 44.3 | 53.3 | 1.98 (1.90–2.07} |
| High (37%–100%) | 15.8 | 20.2 | 24.2 | 27.7 | 35.2 | 2.26 (2.12–2.41) |
| Indication for catheterization‡ | ||||||
| Class I (ideal) | 27.6 | 34.6 | 39.5 | 45.7 | 53.9 | 1.95 (1.89–2.01) |
| Class II (uncertain) | 26.8 | 34.3 | 38.4 | 44.4 | 51.2 | 1.93 (1.84–2.02) |
| Class III (not indicated) | 17.8 | 21.4 | 23.5 | 27.2 | 36.8 | 2.08 (1.86–2.33) |
| Appropriate for β-blocker use at discharge | 30.3 | 39.0 | 44.5 | 51.4 | 60.7 | 2.00 (1.94–2.07) |
Abbreviations: AMI, acute myocardial infarction; CI, confidence interval.
Values in table are percentages unless otherwise indicated. Among 102 573 patents discharged alive and not transferred.
Relative rate of receiving therapy for patients residing in Q5 compared with Q1 regions. Computed using unadjusted logistic regression with a log link to estimate relative rates.
Classification system according to the American College of Cardiology and American Heart Association.
Table 5.
Adjusted Relative Mortality Rate Across Quintiles of Area-Level Cardiac Catheterization and β-Blocker Intensity*
| Quintile of Area-Level Cardiac Catheterization Rate
|
||||||
|---|---|---|---|---|---|---|
| Quintile of Area-Level Discharge β-Blocker Rate | Q1 (Lowest) | Q2 | Q3 | Q4 | Q5 (Highest) | P for Trend |
| NSTEMI Catheterization Class I and II Patients (n= 56 828) | ||||||
| Q1 (lowest) | 1.00 | 0.92 (0.82–1.03) | 0.92 (0.84–1.02) | 0.95 (0.87–1.05) | 0.91 (0.83–0.99) | .01 |
| Mortality risk | 0.666 | 0.649 | 0.643 | 0.649 | 0.621 | |
| Q2 | 0.94 (0.84–1.04) | 0.88 (0.80–0.98) | 0.89 (0.81–0.98) | 0.88 (0.80–0.96) | 0.83 (0.75–0.92) | .02 |
| Mortality risk | 0.659 | 0.635 | 0.642 | 0.635 | 0.590 | |
| Q3 | 0.90 (0.81–0.99) | 0.95 (0.86–1 .05) | 0.90 (0.83–0.99) | 0.92 (0.84–1.02) | 0.87 (0.79–0.97) | .44 |
| Mortality risk | 0.641 | 0.657 | 0.639 | 0.635 | 0.608 | |
| Q4 | 0.94 (0.85–1.05) | 0.92 (0.84–1 .01) | 0.89 (0.80–0.99) | 0.87 (0.79–0.96) | 0.90 (0.81–0.99) | .07 |
| Mortality risk | 0.660 | 0.644 | 0.635 | 0.626 | 0.634 | |
| Q5 (highest) | 0.83 (0.76–0.91) | 0.87 (0.79–0.95) | 0.83 (0.75–0.92) | 0.85 (0.76–0.96) | 0.78 (0.70–0.88) | .38 |
| Mortality risk | 0.632 | 0.640 | 0.614 | 0.615 | 0.562 | |
| P for trend | <.001 | .07 | .005 | .02 | .01 | |
| STEMI Catheterization Class I and II Patients (n = 82 995) | ||||||
| Q1 (lowest) | 1.00 | 0.98 (0.89–1.07) | 0.93 (0.86–1.01) | 0.93 (0.86–1.01) | 0.90 (0.83–0.97) | <.001 |
| Mortality risk | 0.615 | 0.617 | 0.594 | 0.585 | 0.562 | |
| Q2 | 0.98 (0.90–1.06) | 0.99 (0.91–1.09) | 0.94 (0.87–1.02) | 0.93 (0.87–1.01) | 0.84 (0.77–0.91) | <.001 |
| Mortality risk | 0.615 | 0.601 | 0.568 | 0.587 | 0.534 | |
| Q3 | 0.93 (0.86–1.01) | 0.92 (0.84–1.01) | 0.93 (0.86–1.01) | 0.89 (0.82–0.97) | 0.89 (0.82–0.97) | .08 |
| Mortality risk | 0.583 | 0.575 | 0.581 | 0.563 | 0.546 | |
| Q4 | 0.91 (0.83–0.99) | 0.93 (0.86–1.00) | 0.85 (0.77–0.93) | 0.91 (0.84–0.99) | 0.88 (0.81–0.96) | .23 |
| Mortality risk | 0.585 | 0.582 | 0.563 | 0.573 | 0.546 | |
| Q5 (highest) | 0.88 (0.82–0.95) | 0.93 (0.86–1.00) | 0.89 (0.82–0.97) | 0.84 (0.75–0.95) | 0.88 (0.81–0.97) | .78 |
| Mortality risk | 0.589 | 0.596 | 0.563 | 0.546 | 0.565 | |
| P for trend | <.001 | .05 | .02 | .01 | .54 | |
Abbreviations: NSTEMI, non–ST-segment elevation myocardial infarction; STEMI, ST-segment elevation myocardial infarction.
Relative mortality rates and 95% confidence intervals were adjusted for all patient, hospital, and ZIP code characteristics. Mortality risk indicates 7-year Kaplan-Meler mortality estimates.
Acknowledgments
We acknowledge the insightful contributions of Elliott Fisher, David Alter, Dan Gottlieb, and Doug Staiger. We thank Dan Gottlieb for assistance with data analysis and Nancy MacCallum for assistance with manuscript preparation.
Footnotes
Author Contributions: Dr Stukel had access to all of the data in the study and takes responsibility for the integrity of the data and the accuracy of the data analysis.
Study concept and design: Stukel, Lucas, Wennberg.
Analysis and interpretation of data: Stukel, Lucas.
Drafting of the manuscript: Stukel.
Critical revision of the manuscript for important intellectual content: Stukel, Lucas, Wennberg.
Statistical analysis: Stukel, Lucas.
Obtained funding: Wennberg.
Study supervision: Stukel.
Financial Disclosures: None reported.
Funding/Support: Funding was provided by the Robert Wood Johnson Foundation and grant 1PO1-AG19783-01 from the US National Institute on Aging. The analyses of the Cardiovascular Cooperative Project data were funded by contract number 500-99-NH01 titled “Utilization and Quality Control Peer Review Organization for the State of New Hampshire,” sponsored by the Centers for Medicare & Medicaid Services (formerly the Health Care Financing Administration), Department of Health and Human Services.
Role of the Sponsor: The Robert Wood Johnson Foundation and the National Institute on Aging had no role in design and conduct of the study, collection, data management, analysis and interpretation of the data, or preparation, review, and approval of the manuscript. The Health Care Quality Improvement Program initiated by the Centers for Medicare & Medicaid Services encouraged identification of quality improvement projects derived from analysis of patterns of care and required no special funding on the part of this contractor.
Disclaimer: The content of this publication does not necessarily reflect the views or policies of the Department of Health and Human Services, the Centers for Medicare & Medicare Services, or the National Institute on Aging, nor does mention of trade names, commercial products, or organizations imply endorsement by the US government.
References
- 1.Wennberg DE; Dartmouth Atlas of Cardiovascular Health Care Working Group. The Dartmouth Atlas of Cardiovascular Health Care Chicago, III: AHA Press; 1999.
- 2.Keeley EC, Boura JA, Grines CL. Primary angioplasty versus intravenous thrombolytic therapy for acute myocardial infarction: a quantitative review of 23 randomised trials. Lancet. 2003;361:13–20. doi: 10.1016/S0140-6736(03)12113-7. [DOI] [PubMed] [Google Scholar]
- 3.Boden WE, O’Rourke RA, Crawford MH, et al. Veterans Affairs Non-Q-Wave infarction Strategies in Hospital (VANQWISH) Trial investigators. Outcomes in patients with acute non-Q-wave myocardial infarction randomly assigned to an invasive as compared with a conservative management strategy. N Engl J Med. 1998;338:1785–1792. doi: 10.1056/NEJM199806183382501. [DOI] [PubMed] [Google Scholar]
- 4.Cannon CP, Weintraub WS, Demopoulos LA, et al. Comparison of early invasive and conservative strategies in patients with unstable coronary syndromes treated with the glycoprotein IIb/IIIa inhibitor tirofiban. N Engl J Med. 2001;344:1879–1887. doi: 10.1056/NEJM200106213442501. [DOI] [PubMed] [Google Scholar]
- 5.Fox KA, Poole-Wilson PA, Henderson RA, et al. Interventional versus conservative treatment for patients with unstable angina or non-ST-elevation myocardial infarction: the British Heart Foundation RITA 3 randomised trial: Randomized intervention Trial of unstable Angina. Lancet. 2002;360:743–751. doi: 10.1016/s0140-6736(02)09894-x. [DOI] [PubMed] [Google Scholar]
- 6.Henderson RA, Pocock SJ, Clayton TC, et al. Seven-year outcome in the RITA-2 trial: coronary angioplasty versus medical therapy. J Am Coll Cardiol. 2003;42:1161–1170. doi: 10.1016/s0735-1097(03)00951-3. [DOI] [PubMed] [Google Scholar]
- 7.Lagerqvist B, Husted S, Kontny F, et al. A long-term perspective on the protective effects of an early invasive strategy in unstable coronary artery disease: two-year follow-up of the FRISC-II invasive study. J Am Coll Cardiol. 2002;40:1902–1914. doi: 10.1016/s0735-1097(02)02572-x. [DOI] [PubMed] [Google Scholar]
- 8.Yusuf S, Zucker D, Peduzzi P, et al. Effect of coronary artery bypass graft surgery on survival: overview of 10-year results from randomised trials by the Coronary Artery Bypass Graft Surgery Trialists Collaboration. Lancet. 1994;344:563–570. doi: 10.1016/s0140-6736(94)91963-1. [DOI] [PubMed] [Google Scholar]
- 9.Solomon DH, Stone PH, Glynn RJ, et al. Use of risk stratification to identify patients with unstable angina likeliest to benefit from an invasive versus conservative management strategy. J Am Coll Cardiol. 2001;38:969–976. doi: 10.1016/s0735-1097(01)01503-0. [DOI] [PubMed] [Google Scholar]
- 10.Braunwald E. Application of current guidelines to the management of unstable angina and non-ST-elevation myocardial infarction. Circulation. 2003;108:III28–III37. doi: 10.1161/01.CIR.0000086952.14979.32. [DOI] [PubMed] [Google Scholar]
- 11.Bach RG, Cannon CP, Weintraub WS, et al. The effect of routine, early invasive management on outcome for elderly patients with non-ST-segment elevation acute coronary syndromes. Ann Intern Med. 2004;141:186–195. doi: 10.7326/0003-4819-141-3-200408030-00007. [DOI] [PubMed] [Google Scholar]
- 12.Pilote L, Miller DP, Califf RM, et al. Determinants of the use of coronary angiography and revascularization after thrombolysis for acute myocardial infarction. N Engl J Med. 1996;335:1198–1205. doi: 10.1056/NEJM199610173351606. [DOI] [PubMed] [Google Scholar]
- 13.Ryan TJ, Antman EM, Brooks NH, et al. American College of Cardiology/American Heart Association Task Force on Practice Guidelines (Committee on Management of Acute Myocardial infarction). 1999 update: ACC/AHA guidelines for the management of patients with acute myocardial infarction. J Am Coll Cardiol. 1999;34:890–911. doi: 10.1016/s0735-1097(99)00351-4. [DOI] [PubMed] [Google Scholar]
- 14.Pilote L, Califf RM, Sapp S, et al. GUSTO-1 investigators. Regional variation across the United States in the management of acute myocardial infarction. N Engl J Med. 1995;333:565–572. doi: 10.1056/NEJM199508313330907. [DOI] [PubMed] [Google Scholar]
- 15.Krumholz HM, Radford MJ, Wang Y, et al. National use and effectiveness of beta-blockers for the treatment of elderly patients after acute myocardial infarction: National Cooperative Cardiovascular Project. JAMA. 1998;280:623–629. doi: 10.1001/jama.280.7.623. [DOI] [PubMed] [Google Scholar]
- 16.Jencks SF, Cuerdon T, Burwen DR, et al. Quality of medical care delivered to Medicare beneficiaries: a profile at state and national levels. JAMA. 2000;284:1670–1676. doi: 10.1001/jama.284.13.1670. [DOI] [PubMed] [Google Scholar]
- 17.Krumholz HM, Chen J, Rathore SS, Wang Y, Radford MJ. Regional variation in the treatment and outcomes of myocardial infarction: investigating New England’s advantage. Am Heart J. 2003;146:242–249. doi: 10.1016/S0002-8703(03)00237-0. [DOI] [PubMed] [Google Scholar]
- 18.Jencks SF, Huff ED, Cuerdon T. Change in the quality of care delivered to Medicare beneficiaries, 1998–1999 to 2000–2001. JAMA. 2003;289:305–312. doi: 10.1001/jama.289.3.305. [DOI] [PubMed] [Google Scholar]
- 19.Petersen LA, Normand SL, Leape LL, McNell BJ. Comparison of use of medications after acute myocardial infarction in the Veterans Health Administration and Medicare. Circulation. 2001;104:2898–2904. doi: 10.1161/hc4901.100524. [DOI] [PubMed] [Google Scholar]
- 20.Krumholz HM, Radford MJ, Wang Y, Chen J, Marciniak TA. Early beta-blocker therapy for acute myocardial infarction in elderly patients. Ann Intern Med. 1999;131:648–654. doi: 10.7326/0003-4819-131-9-199911020-00003. [DOI] [PubMed] [Google Scholar]
- 21.Wennberg DE, Kellett MA, Dickens JD, et al. The association between local diagnostic testing intensity and invasive cardiac procedures. JAMA. 1996;275:1161–1164. [PubMed] [Google Scholar]
- 22.Mark DB, Naylor CD, Hlatky MA, et al. Use of medical resources and quality of life after acute myocardial infarction in Canada and the United States. N Engl J Med. 1994;331:1130–1135. doi: 10.1056/NEJM199410273311706. [DOI] [PubMed] [Google Scholar]
- 23.Guadagnoli E, Hauptman PJ, Ayanian JZ, et al. Variation in the use of cardiac procedures after acute myocardial infarction. N Engl J Med. 1995;333:573–578. doi: 10.1056/NEJM199508313330908. [DOI] [PubMed] [Google Scholar]
- 24.Tu JV, Pashos CL, Naylor CD, et al. Use of cardiac procedures and outcomes in elderly patients with myocardial infarction in the United States and Canada. N Engl J Med. 1997;336:1500–1505. doi: 10.1056/NEJM199705223362106. [DOI] [PubMed] [Google Scholar]
- 25.O’Connor GT, Quinton HB, Traven ND, et al. Geographic variation in the treatment of acute myocardial infarction: the Cooperative Cardiovascular Project. JAMA. 1999;281:627–633. doi: 10.1001/jama.281.7.627. [DOI] [PubMed] [Google Scholar]
- 26.Guadagnoli E, Landrum MB, Normand SL, et al. Impact of underuse, overuse, and discretionary use on geographic variation in the use of coronary angiography after acute myocardial infarction. Med Care. 2001;39:446–458. doi: 10.1097/00005650-200105000-00005. [DOI] [PubMed] [Google Scholar]
- 27.McClellan M, McNell BJ, Newhouse JP. Does more intensive treatment of acute myocardial infarction in the elderly reduce mortality? analysis using instrumental variables. JAMA. 1994;272:859–866. [PubMed] [Google Scholar]
- 28.Guadagnoli E, Landrum MB, Peterson EA, et al. Appropriateness of coronary angiography after myocardial infarction among Medicare beneficiaries: managed care versus fee for service. N Engl J Med. 2000;343:1460–1466. doi: 10.1056/NEJM200011163432006. [DOI] [PubMed] [Google Scholar]
- 29.Petersen LA, Normand SL, Leape LL, McNell BJ. Regionalization and the underuse of angiography in the Veterans Affairs Health Care System as compared with a fee-for-service system. N Engl J Med. 2003;348:2209–2217. doi: 10.1056/NEJMsa021725. [DOI] [PubMed] [Google Scholar]
- 30.Krumholz HM, Chen J. Murillo JE, Cohen DJ, Radford MJ. Admission to hospitals with on-site cardiac catheterization facilities:impact on long-term costs and outcomes. Circulation. 1998;98:2010–2016. doi: 10.1161/01.cir.98.19.2010. [DOI] [PubMed] [Google Scholar]
- 31.Selby JV, Fireman BH, Lundstrom RJ, et al. Variation among hospitals in coronary-angiography practices and outcomes after myocardial infarction in a large health maintenance organization. N Engl J Med. 1996;335:1888–1896. doi: 10.1056/NEJM199612193352506. [DOI] [PubMed] [Google Scholar]
- 32.Alter DA, Naylor CD, Austin PC, Tu JV. Long-term MI outcomes at hospitals with or without on-site revascularization. JAMA. 2001;285:2101–2108. doi: 10.1001/jama.285.16.2101. [DOI] [PubMed] [Google Scholar]
- 33.Van de WF, Gore JM, Avezum A, et al. Access to catheterisation facilities in patients admitted with acute coronary syndrome; multinational registry study. BMJ. In press. [DOI] [PMC free article] [PubMed]
- 34.Fisher ES, Wennberg DE, Stukel TA, et al. The implications of regional variations in Medicare spending, part 1: the content, quality, and accessibility of care. Ann Intern Med. 2003;138:273–287. doi: 10.7326/0003-4819-138-4-200302180-00006. [DOI] [PubMed] [Google Scholar]
- 35.Fisher ES, Wennberg DE, Stukel TA, et al. The implications of regional variations in Medicare spending, part 2: health outcomes and satisfaction with care. Ann Intern Med. 2003;138:288–298. doi: 10.7326/0003-4819-138-4-200302180-00007. [DOI] [PubMed] [Google Scholar]
- 36.Rosenbaum PR. Observational Studies. 2nd ed. New York, NY; Springer; 2002.
- 37.Marciniak TA, Ellerbeck EF, Radford MJ, et al. Improving the quality of care for Medicare patients with acute myocardial infarction: results from the Cooperative Cardiovascular Project. JAMA. 1998;279:1351–1357. doi: 10.1001/jama.279.17.1351. [DOI] [PubMed] [Google Scholar]
- 38.Cox DR, Oakes D. Analysis of Survival Data. New York, NY: Chapman & Hall; 1984.
- 39.Lin DY. Cox regression analysis of multivariate failure time data: the marginal approach. Stat Med. 1994;13:2233–2247. doi: 10.1002/sim.4780132105. [DOI] [PubMed] [Google Scholar]
- 40.Cox DR, Snell EJ. A general definition of residuals. J R Stat Soc B. 1968;30:248–275. [Google Scholar]
- 41.Schoenfield D. Partial residuals for the proportional hazards regression model. Biometrika. 1982;69:239–241. [Google Scholar]
- 42.Blustein J. High-technology cardiac procedures: the impact of service availability on service use in New York State. JAMA. 1993;270:344–349. doi: 10.1001/jama.270.3.344. [DOI] [PubMed] [Google Scholar]
- 43.Krumholz HM, Murillo JE, Chen J, et al. Thrombolytic therapy for eligible elderly patients with acute myocardial infarction. JAMA. 1997;277:1683–1688. [PubMed] [Google Scholar]
- 44.Ko DT, Mamdani M, Alter DA. Lipid-lowering therapy with statins in high-risk elderly patients: the treatment-risk paradox. JAMA. 2004;291:1864–1870. doi: 10.1001/jama.291.15.1864. [DOI] [PubMed] [Google Scholar]
- 45.Newhouse JP, McClellan M. Econometrics in outcomes research: the use of instrumental variables. Annu Rev Public Health. 1998;19:17–34. doi: 10.1146/annurev.publhealth.19.1.17. [DOI] [PubMed] [Google Scholar]
- 46.Fonarow GC, Gawlinski A, Moughrabi S, Tillisch JH. Improved treatment of coronary heart disease by implementation of a Cardiac Hospitalization Atherosclerosis Management Program (CHAMP) Am J Cardiol. 2001;87:819–822. doi: 10.1016/s0002-9149(00)01519-8. [DOI] [PubMed] [Google Scholar]
- 47.Aronow HD, Novaro GM, Lauer MS, et al. In-hospital initiation of lipid-lowering therapy after coronary intervention as a predictor of long-term utilization: a propensity analysis. Arch Intern Med. 2003;163:2576–2582. doi: 10.1001/archinte.163.21.2576. [DOI] [PubMed] [Google Scholar]
- 48.Gattis WA, O’Connor CM, Gallup DS, Hasselblad V, Gheorghiade M. Predischarge initiation of carvedilol in patients hospitalized for decompensated heart failure: results of the initiation Management Predischarge: Process for Assessment of Carvedilol Therapy in Heart Failure (IMPACT-HF) trial. J Am Coll Cardiol. 2004;43:1534–1541. doi: 10.1016/j.jacc.2003.12.040. [DOI] [PubMed] [Google Scholar]
- 49.Kaul P, Armstrong PW, Chang WC, et al. Long-term mortality of patients with acute myocardial infarction in the United States and Canada: comparison of patients enrolled in Global Utilization of Streptokinase and t-PA for Occluded Coronary Arteries (GUSTO)-I. Circulation. 2004;110:1754–1760. doi: 10.1161/01.CIR.0000142671.06167.91. [DOI] [PubMed] [Google Scholar]
- 50.Hlatky MA. Evidence-based use of cardiac procedures and devices. . N Engl J Med. 2004;350:2126–2128. doi: 10.1056/NEJMp048071. [DOI] [PubMed] [Google Scholar]
- 51.Keeley EC, Grines CL. Primary percutaneous coronary intervention for every patient with ST-segment elevation myocardial infarction: what stands in the way? Ann Intern Med. 2004;141:298–304. doi: 10.7326/0003-4819-141-4-200408170-00010. [DOI] [PubMed] [Google Scholar]
- 52.Brophy JM, Bogaty P. Primary angioplasty and thrombolysis are both reasonable options in acute myocardial infarction. Ann Intern Med. 2004;141:292–297. doi: 10.7326/0003-4819-141-4-200408170-00009. [DOI] [PubMed] [Google Scholar]
- 53.Wennberg DE, Lucas FL, Siewers AE, Kellett MA, Malenka DJ. Outcomes of percutaneous coronary interventions performed at centers without and with on-site coronary artery bypass graft surgery. JAMA. 2004;292:1961–1968. doi: 10.1001/jama.292.16.1961. [DOI] [PubMed] [Google Scholar]