

Abstract
The temperature-induced denaturation of the photosynthetic reaction center from Rhodobacter sphaeroides has been studied through the changes that occur in the absorption spectrum of the bound chromophores on heating. At elevated temperatures, the characteristic absorbance bands of the bacteriochlorins bound to the polypeptides within the reaction center are lost, and are replaced by features typical of unbound bacteriochlorophyll and bacteriopheophytin. The kinetics of the spectral changes cannot be explained by a direct conversion from the functional to the denatured form of the protein, and require the presence of at least one intermediate. Possible mechanisms for the transformation via an intermediate are examined using a global analysis of the kinetic data, and the most likely mechanism is shown to involve a reversible transformation between the native state and an off-pathway intermediate, coupled to an irreversible transformation to the denatured state. The activation energies for the transformations between the three components are calculated from the effect of temperature on the individual rate constants, and the likely structural changes of the protein during the temperature-induced transformation are discussed.
INTRODUCTION
One of the principal aims of structural biology is to understand the factors that contribute to the structural stability of protein-based systems. Proteins have evolved to operate under wide ranges of temperature, pH, salinity, and pressure, and there is enormous interest in the strategies adopted by enzymes and other proteins to deal with challenges of environmental extremes. In contrast to the wealth of information gathered for soluble proteins (see (1) for a recent review), relatively little is known about the extent to which integral membrane proteins need to be adapted for efficient operation in extreme environments, and the nature of any adaptations. This difference mirrors the relative lack of atomic-level structural information for membrane proteins, and limitations in our understanding of how membrane proteins are folded and how different structural features and the membrane lipids contribute to their overall stability.
One of the simplest ways to examine the stability of a protein is to look at its response to elevated temperatures. The thermal stability of a protein is usually assessed by examining the kinetics or thermodynamics of a loss of structural or functional integrity in response to temperature. A large number of soluble proteins have been studied in this way, and their folding and unfolding transitions explored in great detail. Investigations into the thermal stability of membrane proteins have been far more limited, and only the sequence of unfolding transitions of bacteriorhodopsin has been explored in any depth (2,3). The unfolding of membrane proteins has been reviewed by Haltia and Freire (4), membrane protein design has been reviewed by Popot and Engelman (5), and the thermodynamics of membrane protein folding and stability have been discussed in detail by White and Wimley (6). As indicated above, this field is hampered by a lack of structural information to guide the interpretation of thermodynamic or kinetic data. As discussed by White and Wimley (6), secondary structure elements of membrane proteins such as membrane-spanning α-helices typically show great stability, and are highly resistant to thermal denaturation. Loss of functional activity or structural integrity of membrane proteins is instead often due to separation of subunits of multimeric systems, the loss of interactions between elements such as membrane spanning α-helices, or the unfolding of domains lying outside the membrane itself. Unfolding of proteins from detergent suspension or SDS-containing micelles has been studied, but these obviously lack any contribution from the stabilizing effect of the lipid bilayer itself and/or specific lipids, which is often the aspect of most interest with respect to membrane proteins.
In the case of soluble proteins, one useful approach is to compare the x-ray crystal structures of a protein from closely related thermophilic and mesophilic organisms. The first opportunity to carry out such an analysis for a membrane protein has recently arrived with the publication of a high-resolution x-ray crystal structure for the reaction center from the moderately thermophilic purple photosynthetic bacterium Thermochromatium (Tch.) tepidum (7). Although this bacterium is not an extreme thermophile, its optimum temperature for growth (50°C) is ∼15°C higher than that of other purple bacteria whose reaction centers have also been characterized by x-ray crystallography, such as Rhodobacter (Rb.) sphaeroides (8–11) and Blastochloris viridis (12–14). Accordingly, there has been some discussion of factors that may contribute to an enhanced thermal stability of the Tch. tepidum reaction center (7,15). Despite the fact that it is not an extreme thermophile, soluble proteins from Tch. tepidum such as ribulose-1,5-bisphosphate carboxylase/oxygenase (RuBisCO) do exhibit enhanced thermal stability (16), indicating that some adaptation to growth at elevated temperature has occurred in this organism.
The purple bacterial reaction center is a robust and tractable membrane protein that has been used extensively as a model system for investigating photosynthetic energy transduction and the principles governing biological electron transfer (17,18). Rather less is known about how different structural features of the protein contribute to the overall stability of the complex, and there is very little information on how the complex of polypeptides and bound cofactors is assembled in the native bacterial membrane. However, the same features that have made the bacterial reaction center a useful tool for studying energy transduction and electron transfer also make this an attractive subject for study of membrane protein stability and assembly. In particular the Rb. sphaeroides reaction center is amenable to mutagenesis, the x-ray crystal structure is known to a resolution of ∼2 Å (7,19–23), and the bacteriochlorin cofactors have strong and highly distinctive absorbance properties that are acutely sensitive to the structural integrity of the surrounding protein (and which also report on the functional integrity of the complex).
The Rb. sphaeroides reaction center consists of three polypeptides, termed L, M, and H, that bind 10 cofactors (Fig. 1 A). These are two bacteriopheophytin a (BPhe), four bacteriochlorophyll a (BChl), two ubiquinones, a carotenoid, and a nonheme iron atom. The ubiquinone and bacteriochlorin cofactors are arranged in two membrane-spanning branches (Fig. 1 B). Detailed spectroscopic studies have shown that absorbed light energy drives electron transfer from a pair of excitonically coupled BChls (P, the primary donor of electrons) near the periplasmic side of the protein, to a ubiquinone (QA) on the opposite side of the membrane, via an accessory BChl and a BPhe. The transfer occurs along only one of the two cofactor branches (the so-called active branch), and occurs on a timescale of a few hundreds of picoseconds (for reviews, see (17,18,24)).
FIGURE 1.

The x-ray crystal structure of the Rb. sphaeroides reaction center. (A) Overall structure. Helical areas of the L-, M-, and H-polypeptides are shown as ribbons. The L- and M-polypeptides each have five membrane-spanning helices and are arranged around an axis of twofold symmetry that runs approximately perpendicular to the plane of the membrane (dotted line). These polypeptides form the binding pockets of the reaction center cofactors. The approximate position of the membrane is shown by the solid lines. (B) Structural organization of the cofactors, shown in expanded view. The bacteriochlorin and quinone cofactors are arranged in two membrane-spanning branches around the same symmetry axis (dotted line) that runs from the center of the pair of primary donor BChls (P) to the nonheme iron (Fe). Each branch consists of a monomeric BChl (BA or BB), a BPhe (HA or HB), and a ubiquinone (QA or QB). The route of light-driven electron transfer is indicated by the arrows. The major part of the hydrocarbon side chain of each of the BChl, BPhe, and ubiquinone cofactors has been omitted for clarity, and the monomeric BChls shaded to distinguish them from adjacent cofactors.
A small number of previous reports have examined the thermal stability of bacterial reaction centers. Pierson et al. (25) compared the stability of detergent-solubilized Rb. sphaeroides and Chloroflexus (C.) aurantiacus reaction centers while Nozawa and Madigan (26) investigated reaction centers from Tch. tepidum and Chloroflexus (C.) aurantiacus as a function of temperature and exposure to organic solvents, again using detergent-solubilized protein. Antolini et al. (27) examined the stability of reaction centers from Rb. sphaeroides solubilized in detergents with reaction centers in Langmuir-Blodgett films. The effect of illumination on the stability of the protein was considered by Tokaji et al. (28), and it was reported that prolonged illumination severely degraded the ability of the protein to withstand elevated temperatures. In a recent study, we compared the stability of Rb. sphaeroides reaction centers in antenna-deficient native membranes and solubilized in lauryldimethylamine oxide (LDAO), and showed that the membrane environment has a major stabilizing influence (15). In all of these studies, the stability of the protein was assessed in terms of the changes that occur to its absorbance spectrum on heating and, to our knowledge, previous studies have not addressed kinetic or thermodynamic aspects of the unfolding of the reaction centers in any depth. Rather, authors have simply reported temperatures at which the native spectrum was lost, or was degraded by 50%.
To make progress in studying factors that influence the thermal stability of a complex, multicomponent membrane protein such as the reaction center, an analysis of the dissociation kinetics of the wild-type protein is necessary. In this report, we describe such an analysis for the reaction center from Rb. sphaeroides reconstituted into phosphatidylcholine liposomes as a simplified membrane environment. We show that the thermally induced dissociation of the protein must occur via at least one intermediate, which must lie off the main pathway from the native to the denatured state. Based on the kinetic mechanism, we discuss the likely structural transformations that occur during the degradation of the native structure of the protein.
MATERIALS AND METHODS
Protein isolation and purification
Full details of the growth of mutant bacterial strains under dark/semiaerobic conditions have been given elsewhere (29). Reaction centers were isolated as described in detail in McAuley-Hecht et al. (30); the procedure involved solubilization of the complex in LDAO, followed by ion exchange on DE52 (Whatman, Brentford, Middlesex, UK) and Sepharose Q (Pharmacia, Milton Keynes, UK) columns, and gel filtration on a Sephadex 200 preparative grade (Pharmacia) column. The final material had an index of purity (A280/A802) of ≤1.3.
Protein reconstitution into liposomes
The detergent in LDAO-solubilized reaction centers was exchanged for β-octyl glucoside (β-OG) using the procedure described by Alegria and Dutton (31). This involved loading the reaction centers onto a DEAE Sepharose ion exchange column (Sigma-Aldrich, St. Louis, MO), washing the column with copious detergent-free buffer (20 mM Tris-HCl, pH 8.0), and then with 30 mM β-OG, 20 mM Tris-HCl (pH 8.0). The reaction centers were eluted by washing with 30 mM β-OG, 200 mM NaCl/20 mM Tris-HCl (pH 8.0). Liposomes were prepared by suspending dry 1-palmitoyl-2-oleoyl-sn-glycero-3-phosphocholine (POPC) powder (Avanti Polar Lipids, Alabaster, AL) in 20 mM Tris-HCl (pH 8.0) by mechanical agitation, followed by high pressure extrusion through a 200 nm pore membrane.
Reaction centers suspended in β-OG were added to the pre-prepared liposome suspension in a 1000:1 lipid/protein ratio. The detergent/lipid ratio was never allowed to exceed 13:1. The detergent was removed by overnight dialysis versus 20 mM Tris-HCl (pH 8.0).
Absorbance spectroscopy
Absorption spectra were recorded using a Perkin-Elmer Lambda 35 spectrophotometer (Boston, MA) in dual-beam mode. The reference cuvette contained 20 mM Tris-HCl (pH 8.0). Sodium ascorbate (Aldrich) was added to the blank and sample cuvettes to a concentration of 1 mM immediately before heating. This was to ensure full reduction of the reaction center bacteriochlorins. Water-jacketed cuvettes were used (model No. 160.001QS, Hellma, Plainview, NY), and both the blank and sample cuvettes were heated simultaneously using water from a circulating thermostated water bath. Sample temperature was monitored to an accuracy of 0.1°C using an immersed k-type thermocouple, and the temperature of the samples was allowed to equilibrate for 3 min before data collection. Spectra were collected between 600 nm and 1100 nm (scan time ∼20 s) at intervals of 1.5 min. Temperature-quenching experiments were performed using two water baths held at different temperatures, connected to the cuvettes using three-way valves allowing either the hot or cold water bath to be selected.
The genetic algorithm
Data analysis was carried out using a real-valued, multipopulation genetic algorithm. Each population comprised 100 individuals, and 10 populations were used. Migration of individuals between populations was allowed every 10 iterations, and migration was bidirectional between randomly chosen populations. Selection of migrating individuals was random, and insertion into the target population was carried out on a fitness selection basis, where the 10 least-fit individuals were replaced by the incoming individuals. At each iteration, the fitness of the individuals was calculated and they were ranked on a linear scale. Individuals were then selected for breeding using a stochastic universal sampling algorithm (32). Crossover was carried out using discrete recombination, and mutation was applied to the offspring using the breeder genetic algorithm (33). The mutation rate was the inverse of the number of variables per individual. The fitness of the mutated offspring was then calculated, and reinsertion of the mutated offspring into the original population was via a fitness-based replacement strategy, with the 10 worst individuals being replaced by the 10 best in the offspring. The fitness of the individuals was the χ-squared goodness-of-fit parameter. For curve fits of multiple curves, the fitness was defined as the sum of the χ-squared parameter for each individual curve. Convergence was defined as a lack of improvement of the fitness over 30 consecutive iterations. The algorithm was implemented in the MatLab environment (The MathWorks, Natick, MA), using the public domain Genetic Algorithm Toolbox (http://www.shef.ac.uk/∼gaipp/ga-toolbox/).
RESULTS
The effect of heating on the absorbance spectrum of the reaction center
The room temperature absorbance spectrum of the Rb. sphaeroides reaction center reconstituted into POPC liposomes is shown in Fig. 2 a (corrected for the sloping baseline caused by the wavelength-dependent scattering of incident light). In the region between 650 and 920 nm the reaction center bacteriochlorins gave rise to four absorbance bands. The band around 760 nm is attributable to the Qy transitions of the two reaction center BPhes (termed the 760 band), and the band around 800 nm is principally assigned to the Qy transitions of the two monomeric accessory BChls, with a minor contribution from a high energy exciton component of the Qy transition of the special-pair P BChls (termed the 800 band). The band around 860 nm is attributable to the low energy exciton component of the of Qy transition of the two P BChls (termed the 860 band). The precise absorbance maximum of each band varied somewhat with sample conditions, such as the presence of the membrane, and type and concentration of detergent present. In addition, the maximum of the 860 band was dependent on sample temperature, being positioned at 867 nm in membrane-embedded reaction centers at room temperature, and shifting to the blue as the incubation temperature was increased. This can be seen in Fig. 2 b, where a sample of reaction centers in POPC liposomes had been heated for 2 min at 79°C. There was also a small band centered at 670 nm, which is usually visible in spectra of both membrane-bound and purified reaction centers, the assignment of which is unclear. The spectrum could be deconvoluted into four Gaussian peaks as shown in Fig. 2.
FIGURE 2.

The near-infrared absorbance spectrum of reaction centers reconstituted into liposomes. (a) The spectrum at room temperature, corrected for background scatter from the liposomes. The spectrum was well represented by four Gaussians, as shown by the dotted lines. (b–e) The effect of heating at 79°C on the absorption spectrum of the reaction center after (b) 2 min, (c) 10 min, (d) 1 h, and (e) 2 h.
On prolonged heating, the spectrum changed as shown in the sequence shown in Fig. 2, b–d, which covers a 2 h incubation at 79°C. The characteristic absorbance spectrum of the bacteriochlorin cofactors was lost, with both the 800 and the 860 absorbance bands decreasing in amplitude. At the same time absorbance around 760 nm showed a net increase. Because both BChl and BPhe in organic solvents show an absorbance maximum in the range 750–770 nm (34), the increase in absorbance at 760 nm is attributed to the loss of BChl and BPhe from their native protein environments. As a result the dissociation kinetics of the reaction center BPhes were masked by the appearance of free BChl and, presumably, free BPhe. For this reason, most of the discussion in this report relates to the kinetics of the BChl cofactors. However, to make progress in understanding the kinetics of the denaturation process both the loss of the native state and the appearance of the breakdown products must be accounted for, and any model describing this process must therefore account for the composite nature of the 760-nm band.
Fig. 3 shows the (deconvoluted) heights of the 760, 800, and 860 absorbance bands over time for reaction centers heated at 79°C. The kinetics of the loss of the 800 band was clearly biphasic, which hinted at a more complex mechanism for denaturation of the protein than a simple linear first-order process. As expected, the 760 band showed a net growth as free BChl appeared. The inset to Fig. 3 shows normalized kinetic traces (normalized as  ) for the 860 and 800 bands and, as can be seen, they were coincident to within the accuracy of the measurement, indicating that a single kinetic model should be able to describe the loss of absorbance from both the accessory and primary donor BChls. It was not possible to ascertain whether the kinetics of BPhe dissociation were also the same as those of the BChls, as the spectra of both the native BPhes and any BPhe that was released from the complex were obscured by the absorbance of free BChl. The BPhe unbinding kinetics could therefore differ from that of the BChls, and these were treated separately in the kinetic model.
FIGURE 3.

Time-dependence of the intensities of the 760, 800, and 860 absorbance bands at 79°C. The inset shows normalized kinetics for the 800- and 860-nm bands.
Kinetic model and fitting strategy
The aim of the kinetic analysis was to describe the effects of heating on the absorption spectrum of the reaction center in terms of the simplest possible mechanism, and to obtain Arrhenius-type activation energies for each kinetic pathway. The biphasic kinetics shown in Fig. 3 suggested that at least one intermediate must be present during the mechanism, since the appearance of n exponential terms in kinetic data generally requires the presence of at least n + 1 participating species (35). These are conventionally assumed to be linked by a series of first-order transformations, some or all of which may be reversible. To assess the reversibility of the dissociation, the protein was heated at 79°C and then quenched to 25°C (where the protein is stable), and the response of the 800 band was monitored. As can be seen from Fig. 4, some recovery of the 800 band was observed on quenching. The recovery was not complete, and the absolute magnitude of the recovery decreased with increasing heating time, as shown in the inset to Fig. 4.
FIGURE 4.

Reversibility of the loss of intensity of the 800-nm absorbance band. The protein was heated to 79°C and then rapidly quenched to 25°C after 10, 40, 60, 80, and 200 min, respectively. The amount of reversal decreases with heating time (inset), suggesting that there cannot be a fully reversible pathway between the native and denatured state.
At very long heating times (where the native spectrum had completely disappeared), no recovery was seen (data not shown). This suggests that while there must be some reversible component to the mechanism, there cannot be a completely reversible pathway between the native and the denatured state. There are two minimal mechanisms involving one intermediate that satisfy these criteria, and these are shown in Fig. 5. In Scheme 1(a) (commonly known as the Lumry-Eyring model (36)), the intermediate (I) lies on the kinetic pathway from the native (N) to the denatured (D) state. Alternatively, in mechanism 1(b) in Fig. 5 the intermediate may lie off the main kinetic pathway as a species which must refold to the native state before the subsequent unfolding transition (the “offset” mechanism). The first goal of the kinetic analysis was to distinguish between these possibilities.
FIGURE 5.

Schemes for the denaturation of the reaction center involving an intermediate state.
To simulate the time-dependence of the absorbance data, the relevant differential equations for each candidate mechanism were integrated using the eigenvalue method (35), as summarized in the Appendix. From the Beer-Lambert relation, the kinetics of the absorption data is then given by the time-dependence multiplied by the relevant extinction coefficient of the absorbance band in question. For absorbance data taken at a range of temperatures, the analysis yields a set of curves that vary in terms of the rate constants, but have common values for the extinction coefficients.
The integrated rate equations described in the Appendix calculate the time-dependence of the concentrations of the native state N(t), the intermediate I(t), and the denatured state D(t). Thus, for the 800 absorption band of the accessory BChls,
 |
(1) |
where ɛ800 is the extinction coefficient of the bound accessory BChls (ɛ800 = 288 × 103 cm−1 mol−1 (34)). The appearance of the unbound accessory BChls will be given by the third integrated differential equation of the same set as N(t), but since there are two equivalent accessory BChls, the free accessory BChl will appear at twice the rate, or
 |
(2) |
Since the macroscopic kinetics of the absorbance band of the primary donor BChls (A860) were identical to those of the 800-absorbing BChls, it was assumed that the microscopic kinetics were also identical (i.e., that both absorbance bands were lost with the same mechanism and with the same microscopic rate constant). Therefore,
 |
(3) |
where N(t) is identical to that in Eq. 1. The total appearance of free primary donor BChl will again be given by Eq. 2 and, therefore, the combined kinetics of the free BChl component of the 760 absorbance band will be
 |
(4) |
As discussed above, spectral overlap prevents direct access to the BPhe kinetics. However, we have chosen to assume that the BPhe kinetics will have a biphasic dependence, since if the rest of the protein appears to denature via an intermediate, then it is likely that the same will be true for the loss of BPhe. The decay of the BPhe peak is therefore represented using the same mechanism as that of BChl, but with a different set of rate constants. The decay of the 760-nm absorption band of BPhe is given by
 |
(5) |
with the subsequent appearance of free BPhe as
 |
(6) |
and the composite 760 band is then given by
 |
(7) |
To evaluate the two alternative mechanisms, curves arising from the linear (Scheme 1a) and offset (Scheme 1b) mechanisms were fitted to the experimental data for the time-dependence of the 760 and 800 absorbance bands when the reaction center solution was heated at 79°C. This was done using Eqs. 1–7, and those given in the Appendix. The resulting best-fit curves are shown in Fig. 6. As can be seen, for the linear model, the 800-nm peak was reproduced quite well, but the fit to the 760-nm peak was very poor. Other fits were obtained where the reverse case was true (i.e., good fit to the 760 nm with a poor fit to the 800-nm peak), which are omitted for clarity, but in general, the model was able to reproduce one or other of the traces but never both simultaneously. The fit of the offset model, however, was excellent, and both traces are well reproduced. The summed χ-squared value for the offset model is two orders-of-magnitude smaller than that of the linear model, and it is clear that the offset model is by far the most successful at reproducing the kinetic data.
FIGURE 6.

Best fits of the linear (dotted lines) and offset (solid lines) mechanism to the kinetic data for the 800 and 760 absorbance bands during incubation at 79°C.
The next aim was to determine the effect of temperature on the rate constants in the offset mechanism, and from these to calculate Arrhenius activation energies for each. The dataset at each temperature (i.e., 800 band decrease and 760 band increase) was described by 10 fitting parameters—the three BChl rate constants (k1, k2, and k3), the three BPhe rate constants (kp1, kp2, and kp3), and the three unknown extinction coefficients for bound BPhe ( ), free BPhe (
 ), and free BChl (
 ). In principle, it should have been possible to obtain the initial zero-time concentration from the spectrum taken before heating, but in practice the dead-time of the measurement made this problematic. The cuvettes took up to 3 min to reach the constant set temperature, and during this time, the kinetics was variable. Extrapolation of the temperature curves to zero time would therefore reach the axis at a different absorbance to that measured from the unheated solution, and therefore the initial concentration of the protein, A0, was also included as a fitting parameter.
Of these 11 parameters, four were common between all the datasets (the three extinction coefficients and A0) and hence were expected to be identical for each curve. As a result, the main goal was a global analysis of the data, with the kinetics at a range of temperatures being fitted simultaneously. In practice, it was beneficial to fit the datasets individually in the first instance, and to use the values obtained to constrain the search space of the global fits. This was done for purely practical reasons, since genetic algorithms are stochastic search algorithms, and large parameter spaces can lead to very slow convergence.
For the initial individual fits, the datasets for each temperature were fitted 10 times and mean parameter values for each fit were obtained (Table 1). These were then used to constrain the search space for the global fit. If the global fit had been set up with the rate constants for each temperature as individual fitting parameters, the fits would have become intractable due to the large number of parameters required—24 rate constants alone, plus the four common parameters. Also, although the extinction coefficients would have been global, the rate constants for each curve would essentially still have been independent fits. To circumvent this problem, the Arrhenius dependence of the rate constants was used to calculate the rate constants at the higher temperature from the rate constants of the lowest temperature, using the activation energies associated with each. In other words, if kT1 is the rate constant at temperature T1, and the Arrhenius activation energy associated with this constant is Ea, then the rate constant at the higher temperature, kT2, is given by
 |
(8) |
where R is the gas constant. This procedure, of course, assumed that the behavior of the rate constants was indeed of Arrhenius type. Fig. 7 shows an Arrhenius plot for the three rate constants, with the points being the mean values of the fitted rate constants for each temperature (from the individual fits in Table 1) and the error bars showing the standard deviation. As can be seen, the behavior was approximately linear, with the gradients giving the activation energies of 328, 171, and 94 kJ mol−1 associated with k1, k2, and k3, respectively. The parameters used in the global fits were thus as follows: the initial concentration (A0), the three unknown extinction coefficients ( ), the six rate constants for BChl (k1, k2, k3), and BPhe (kp1, kp2, and kp3), and the six activation energies associated with each rate constant (Ea1, Ea2, Ea3, Eap1, Eap2, and Eap3). The allowed ranges for each parameter are given in column 2 of Table 2. As the analysis encompassed data for the decay of the 800 band and increases of the 760 band at four temperatures, it involved fitting eight curves simultaneously using 16 parameters, with each of the parameters being globally shared between all the curves. The global fit was carried out using the equations given above (Eqs. 1–7) and those in the Appendix. The genetic algorithm used was that described in Materials and Methods. The resulting best fit is shown in Fig. 8, and the best-fit parameter values are given in column 3 of Table 2.
TABLE 1.
Best-fit parameters for individual fits of the data
| Temperature (°C)
|
||||
|---|---|---|---|---|
| Parameter | 79° | 81° | 83° | 85° |
| Ao (mol) | 5.77e-7 (± 5.73e-9) | 5.84e-7 (± 2.15e-8) | 5.36e-7 (± 3.32e-8) | 3.13e-7 (± 1.31e-8) |
 (mol−1) (mol−1) |
1.51e5 (± 6.13e3) | 1.48e5 (± 8.06e3) | 1.57e5 (± 7.14e3) | 1.33e5 (± 1.63e4) |
 (mol−1) (mol−1) |
2.79e4 (± 3.37e3) | 1.19e5 (± 1.01e4) | 1.53e5 (± 2.59e4) | 1.55e5 (± 1.1155e4) |
 |
9.94e4 (± 5.45e3) | 1.25e5 (± 4.17e3) | 1.26e5 (± 4.65e3) | 1.25e5 (± 5.68e3) |
| k1 (min−1) | 2.00e-2 (± 1.66e-3) | 4.93e-4 (± 5.00e-5) | 8.50e-4 (± 8.30e-5) | 1.70e-3 (± 9.60e-5) |
| k2 (min−1) | 6.33e-3 (± 1.88e-4) | 1.03e-4 (± 4.98e-6) | 1.54e-4 (± 9.46e-6) | 2.26e-4 (± 1.07e-5) |
| k3 (min−1) | 6.08e-2 (± 4.68e-3) | 7.82e-4 (± 6.90e-5) | 8.17e-4 (± 6.20e-5) | 1.11e-3 (± 3.97e-5) |
FIGURE 7.

Arrhenius plots for the three BChl rate constants from the individual curve fits at four selected temperatures.
TABLE 2.
Parameter ranges for the global fits and output values
| Parameter | Range for fit | Value from fit |
|---|---|---|
| A0 | 4e-7 to 8e-7 | 5.65e-7 ± 1.8e-9 |
| k1 | 1e-3 to 1e-1 | 1.57e-2 ± 2.8e-4 |
| k2 | 1e-4 to 1e-2 | 5.17e-3 ± 3.7e-4 |
| k3 | 1e-3 to1e-1 | 4.14e-2 ± 3.4e-3 |
| Ea1 | 100–500 | 320 ± 2.77 |
| Ea2 | 50–150 | 172 ± 13.8 |
| Ea3 | 10–150 | 82.3 ± 15.2 |
| kp1 | 1e-6 to 1e-1 | 1.73e-2 ± 7.1e-3 |
| kp2 | 1e-6 to 1e-1 | 5.7e-2 ± 1.8e-2 |
| kp3 | 1e-6 to 1e-1 | 4.8e-3 ± 1.4e-3 |
| Eap1 | 10–1000 | 1.05 ± 0.38 |
| Eap2 | 10–1000 | 245 ± 26.9 |
| Eap3 | 10–1000 | 500 ± 43.3 |
FIGURE 8.

Simultaneous global fits of the offset mechanism to the kinetics of the 760-nm (upper traces) and 800-nm (lower traces) absorbance bands at four selected incubation temperatures.
DISCUSSION
The Rb. sphaeroides reaction center is clearly highly resistant to thermal denaturation when in the lipid bilayer environment. It can be heated to upwards of 70°C and still maintain integrity over periods of hours, as assessed by the absorbance spectrum of the bacteriochlorin cofactors. At low temperatures, all reaction centers occupy the native state (N). On heating, a proportion of the reaction centers gained sufficient energy to irreversibly transform to the denatured state (D) and, from the kinetic analysis, the activation barrier for this irreversible process was 172 kJ mol−1 (Table 2; Ea2). A proportion of the reaction centers also crossed to the intermediate state (I) across a larger activation barrier of 320 kJ mol−1 (Table 2; Ea1). However, the activation barrier for the return process from the intermediate to the native state was considerably smaller, at 82 kJ mol−1 (Table 2; Ea3), and so population of the intermediate state would be expected to be low. Fig. 9 shows the relative concentrations of the N-, I-, and D-states over a 200-min period at 79°C, calculated from the best-fit parameters in Table 2. As can be seen, the proportion of the reaction centers in the intermediate state was always considerably less than that in the native state. This is consistent with Fig. 4, where the recovery of absorption on quenching (which must be due to reaction centers returning from the intermediate state) was always small compared to the total remaining absorption.
FIGURE 9.

Relative concentrations of the native (N), intermediate (I), and denatured (D) states over 200 min, calculated from the best-fit parameters from Table 2.
In Fig. 9, the appearance of the D-state can be seen to be linear. As an independent probe of this behavior, we examined the time-dependence of fluorescence from the reaction-center bacteriochlorins under heating. Ordinarily, the bacteriochlorins within the reaction center do not fluoresce to any significant extent as the function of the protein is to transduce light energy, and losing energy via fluorescence would be wasteful. Free BChl and BPhe, however, do exhibit fluorescence, since the energy of absorbed photons cannot be redistributed to adjacent cofactors and will be released dissipatively or radiatively as photons. Both bound and unbound BChl and BPhe have a Qx absorbance between 500 and 600 nm, with the maximum of the BPhe Qx band at 531 nm and that of BChl at 597 nm. When excited at these wavelengths, free bacteriochlorins fluoresce at 770 nm, somewhat to the red of their Qy absorbance when not bound to the reaction center. The time-dependence of the fluorescence during heating is shown in Fig. 10 for BPhe (squares) and BChl (circles). As can be seen, the fluorescence rose monotonically, which is consistent with Fig. 9. (It should be noted that while the fluorescence could, in principle, be used as an independent probe of the D-state in the global fit, thus circumventing the problem of overlap of the BPhe absorbance with free bacteriochlorins, in this case we elected not to do so. The fluorescence data is considerably noisier than the absorbance data, and also the precise nature of the free form of the bacteriochlorins is unknown. Thus, we have no knowledge of the fluorescence yield and this would become an extra, unknown fitting parameter in the global fit. We therefore only use the fluorescence data to show that the linear increase is in qualitative agreement with Fig. 9.)
FIGURE 10.

Appearance of fluorescence at 760 nm with time at 79°C, in response to excitation at 531 nm (for BPhe) and 597 nm (for BChl).
The activation energies obtained for the loss of BPhe (Table 1; Eap1–Eap3) were considerably different to those for BChl, with, in this case, the N→I transition appearing to be the most favorable. However, some caution must be exercised in the interpretation of these values. Fig. 11 indicates the difficulty in interpreting the fitted BPhe values associated with the data on the composite 760-nm absorbance band. The figure shows three pairs of curves for decay of bound BPhe and appearance of free BPhe, calculated using different values of  and the three rate constants. Although the three sets of curves are markedly different, the overall behavior (i.e., the sum of the decay and appearance curves) in all three cases is coincident, as represented by the thick uppermost line. The values of the individual rate constants obtained from the fit, along with the apparent activation energies, are therefore the particular choice of the minimization algorithm rather than having any physical significance. The same problems do not apply to the parameters calculated from the 804-nm data, since the spectra of bound and free BChl are not coincident.
FIGURE 11.

Three pairs of curves for the decay of bound BPhe (lower) and the rise of free BPhe (upper), calculated at different values of  and kp3. The sum of each pair of decay and rise curves is given by the thicker solid line.
What do the changes in spectrum indicate in terms of overall changes in the structure of the reaction center? Measurement of the state of the protein, using the absorbance spectrum, probes the effect of temperature on the environment of the bacteriochlorin cofactors, rather than on the protein itself. The measurement, therefore, has the limitation that it probes only part of the overall unfolding process. However, from the standpoint of examining the resilience of protein function to temperature stress, the measurement probes the most important part of the unfolding process, as loss of the native spectrum reports the conversion of the protein-cofactor complex from a functional to nonfunctional state. From the point of view of reaction-center design, the key stabilization must be the retention of the electron transfer cofactors in their native binding pockets. As with bacteriorhodopsin, even minor structural changes that cause loss of the native states of the cofactors are terminal to protein function, irrespective of whether the protein component retains a largely native tertiary structure.
Loss of the native absorption spectrum of the BChl cofactors is accompanied by the appearance of absorbance characteristic of free BChl. Although the actual state of this free BChl is not yet known, if it is physically separate from the protein husk then it is not surprising that there is no reversible path from the final to the initial state, whether directly or through the intermediate state. For the process to be fully reversible, all the cofactors would have to simultaneously diffuse back into an appropriate bonding site in the protein husk, which is statistically unlikely.
The binding pockets of the bacteriochlorin cofactors lay at the interface between the L- and M-polypeptides, and each cofactor makes contacts with both (e.g., see Tables in (9) for details). In the case where a protein consists of a number of noncovalently associated polypeptides, irrespective of whether these associations are strong or weak, the initial stage of unfolding almost always involves disruption of these interpolypeptide contacts and their subsequent separation (6). Given that the kinetics of loss of the native spectra of the accessory and primary donor BChls were identical, it seems plausible that the irreversible N→D transition represents a separation of the L- and M-polypeptides, disrupting all of the bacteriochlorin binding pockets and leading to simultaneous (and irreversible) release of the bacteriochlorin cofactors from the protein scaffold.
In the case of the intermediate, the fact that it is kinetically distinct suggests some disruption of the tertiary structure of the protein, but the easy reversibility suggests that this disruption is too small to allow full unbinding of the bacteriochlorin cofactors. It is well known that the absorbance spectrum of these cofactors is acutely sensitive to the protein environment, and so in principle it would take only very subtle alterations in structure for dramatic spectral changes to occur. If the tertiary structure of the protein were to become loosened, such that the binding pockets of the BChl cofactors were sufficiently disrupted that the native spectrum was lost, but that the cofactors themselves were still associated with the protein, it would be possible to lose the native absorbance spectrum in a reversible manner.
Intuitively, in the case of this system one could reasonably expect that a loosened intermediate state could also progress directly to the denatured state in which the cofactors have been irreversibly lost. In fact, there is nothing in the absorbance data presented above to exclude this as a possibility. The offset mechanism shown as Scheme 1(b) in Fig. 5 is a submechanism of the fully triangular mechanism shown as Scheme 2(a) in Fig. 5. The lack of complete reversibility from D to N (see Fig. 5) indicates that kDN is effectively zero under these conditions. Similarly, the alternative path from D to N via I does not seem to occur, whereas reversal from the intermediate does, which suggests that kDI must be vanishingly small. However, the mechanism shown as Scheme 2(b) in Fig. 5 is not excluded by any of these arguments, and indeed this alternative mechanism describes the data just as well as the offset mechanism discussed above (Fig. 5, Scheme 1(b)). Ikai and Tanford (37) have shown that the so-called offset and triangular mechanisms can only be distinguished if both the forward and reverse kinetics are known. However, as can be seen from Fig. 4, the reversal of the premelting N→I transition is too rapid for our current method of measurement. In practice, when the fits described in the previous section were carried out with the triangular mechanism shown as Scheme 2(b) in Fig. 5 we encountered problems with their reproducibility. The extra degree of freedom introduced by inclusion of the additional I→D pathway leads to a level of complexity in the kinetic model that is not justified given the available data. Applying Occam's razor, the offset mechanism is the minimal possible mechanism that describes the data. Given that the I→D transition is likely to be feasible, it is probably more correct to represent the kinetics with the Scheme shown as Scheme 2(c) in Fig. 5, with a likely but unproven I→D kinetic pathway represented by a dotted line. For the case of bacteriorhodopsin, the rebinding of retinal to the apoprotein is seen in the presence of a large excess of retinal (3). If full reversibility could be observed under such circumstances for the reaction center, then it is possible that the kinetic Scheme would then become consistent with the full triangular mechanism of Scheme 2(a) in Fig. 5. The offset mechanism we describe here is thus the mechanism observed under the specific set of conditions described in Materials and Methods, and we cannot rule out that full reversibility is possible under conditions where this becomes more statistically favorable.
Returning to the motivation for this work—that of understanding factors that contribute to the thermal stability of complex membrane proteins—it would usually be appropriate to invoke a thermodynamic analysis of the system, since protein stability is usually discussed in terms of the free energy changes associated with the transitions between the kinetically distinct states. However, in the case of the present system, the similarity in the rates of the transitions precludes such analysis. For globular proteins, most transitions are seen to be fully reversible and as such are readily discussed in terms of classical equilibrium thermodynamic models. For many proteins, however, an irreversible step is often seen that cannot be analyzed thermodynamically, and is simply treated as a kinetic step with Arrhenius-type parameters. As discussed by Sanchez-Ruiz (38), such an approach is only strictly valid for systems where the rate constants of the reversible step are orders-of-magnitude faster than the accompanying irreversible transition, and so are approximately in a thermodynamic stationary state. The analysis of sigmoidal activity curves by thermodynamic models (a common method of analyzing protein stability), as described by Tokaji (28) for the reaction center, is therefore incorrect. In that work it was assumed that denaturation followed the linear Lumry-Eyring mechanism (i.e., Scheme 1a in Fig. 5), and that the initial reversible step was faster than the final irreversible transition. As described in this work, it is likely that neither assumption is valid, and investigations of the stability of the reaction center should therefore be carried out using a kinetic analysis.
A thermodynamic analysis of the kinetic Scheme described here is outside the scope of classical equilibrium thermodynamics. Classical irreversible thermodynamics would also be expected to be invalid, since protein folding transitions (and chemical transformations generally) are usually far from equilibrium events and hence outside the linear regime. A full thermodynamic analysis of this system would require a nonequilibrium thermodynamic description in the nonlinear regime (39)—which, to our knowledge, has yet to be developed for protein conformational changes.
Although the information obtained from Arrhenius activation energies is more limited than that derived from a thermodynamic description, it does allow comparative studies of the effect of variations in the system on the robustness of the protein. For example, if the N→I transition really is substantially caused by subunit separation as we have suggested here, this activation energy should be strongly affected by both membrane composition and by mutation of residues, whose function is to hold the subunits together. Similarly, it should be possible to gain insights into the nature of the off-pathway intermediate by monitoring the effects of targeted mutations on the rate constants of this transition. A large number of point mutants of the Rb. sphaeroides reaction center already exist, and for a subset of these the x-ray crystal structure is also known (21). Investigations of the effect of mutation on the kinetics of thermal inactivation of the reaction center are currently underway, and should allow the mechanism of inactivation of the reaction center to be studied in further detail.
CONCLUSIONS
The kinetics of the early stages of thermal denaturation of the reaction center from Rb. sphaeroides have been studied. Upon heating, the kinetic pathway of the stage of inactivation in which the bacteriochlorin cofactors lose their native absorption spectrum involves an off-pathway intermediate. The transition between the intermediate and the native state is reversible, and this reversible transition is coupled to an irreversible transition to the denatured state. A global analysis of the kinetic data suggests that the activation energy of the irreversible process is 172 kJ mol−1. The transition to the intermediate has a significantly higher activation energy of 320 kJ mol−1, although the activation energy of the reverse transition is significantly smaller at 82 kJ mol−1. The intermediate is therefore populated only to a minor extent during the transition. We suggest that the irreversible step represents a loss of the cofactors from the protein, and that this is most likely to be connected with a separation of the component polypeptides. We further suggest that the intermediate represents a misfolded state of the protein, with the structure disrupted sufficiently to affect the absorption spectrum, but with the cofactors remaining associated with the protein leading to the relatively easy reversibility of the N↔I transition.
Acknowledgments
This work was supported by the Biotechnology and Biological Sciences Research Council of the United Kingdom.
APPENDIX: INTEGRATED RATE EXPRESSIONS
The kinetic equations were integrated using the well-known matrix formalism. This has been discussed elsewhere (35), and so the purpose of this Appendix is mainly to provide the analytical forms for the eigenvalues and eigenvectors.
For the linear mechanism, the three differential equations for the individual species (native, intermediate, and denatured) are written
 |
(A1) |
or in matrix form
 |
(A2) |
This has eigenvectors
 |
(A3) |
and eigenvalues
 |
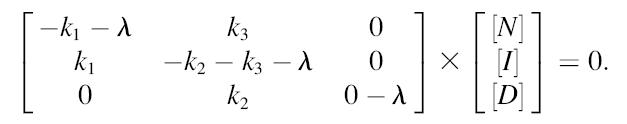
In the case of the offset mechanism,
 |
(A4) |
or in matrix form,
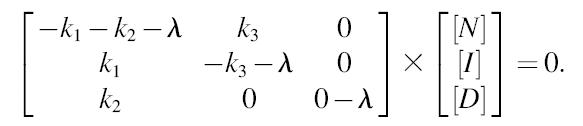 |
(A5) |
This has eigenvectors
 |
(A6) |
and eigenvalues
 |
where in Eqs. A5 and A6,  We then define
 |
(A7) |
where [N0], [I0], and [D0] are the initial concentrations. The time-dependence of each component is given by
 |
(A8) |
where λ1, λ2, and λ3 are the elements of the diagonal of the eigenvalue matrix.
A. V. Hughes's present address is ISIS, Rutherford Appleton Laboratory, Chilton, Didcot, Oxon, OX11 0PU, United Kingdom.
References
- 1.Kumar, S., and R. Nussinov. 2001. Review: How do thermophilic proteins deal with heat? Cell. Mol. Life Sci. 58:1216–1233. [DOI] [PMC free article] [PubMed] [Google Scholar]
- 2.Müller, J., C. Münster, and T. Salditt. 2000. Thermal denaturing of bacteriorhodopsin by x-ray scattering from oriented purple membranes. Biophys. J. 78:3208–3217. [DOI] [PMC free article] [PubMed] [Google Scholar]
- 3.Booth, P. J., and A. R. Curran. 1999. Membrane protein folding. Curr. Opin. Struct. Biol. 9:115–121. [DOI] [PubMed] [Google Scholar]
- 4.Haltia, T., and E. Friere. 1995. Forces and factors that contribute to the structural stability of membrane proteins. Biochim. Biophys. Acta. 1241:295–322. [DOI] [PubMed] [Google Scholar]
- 5.Popot, J. L., and D. M. Engelman. 1990. Membrane protein folding and oligomerization: the two-stage model. Biochemistry. 29:4031–4037. [DOI] [PubMed] [Google Scholar]
- 6.White, S. H., and W. C. Wimley. 1999. Membrane protein folding and stability. Physical principles. Annu. Rev. Biophys. Biomol. Struct. 28:319–365. [DOI] [PubMed] [Google Scholar]
- 7.Nogi, T., I. Fathir, M. Kobayashi, T. Nozawa, and K. Miki. 2000. Crystal structures of photosynthetic reaction center and high-potential iron-sulfur protein from Thermochromatium tepidum: thermostability and electron transfer. Proc. Natl. Acad. Sci. USA. 97:13561–13566. [DOI] [PMC free article] [PubMed] [Google Scholar]
- 8.Allen, J. P., G. Feher, T. O. Yeates, H. Komia, and D. C. Rees. 1987. Structure of the reaction center from Rhodobacter sphaeroides R-26—the cofactors. Proc. Natl. Acad. Sci. USA. 84:5730–5734. [DOI] [PMC free article] [PubMed] [Google Scholar]
- 9.Chang, C. H., O. El Kabbani, D. Tiede, J. Norris, and M. Schiffer. 1991. Structure of the membrane-bound protein photosynthetic reaction center from Rhodobacter sphaeroides. Biochemistry. 30:5352–5360. [DOI] [PubMed] [Google Scholar]
- 10.Ermler, U., G. Fritzsch, S. K. Buchanan, and H. Michel. 1994. Structure of the photosynthetic reaction center from Rhodobacter sphaeroides at 2.65 Å resolution—cofactors and protein-cofactor interactions. Structure. 2:925–936. [DOI] [PubMed] [Google Scholar]
- 11.Ermler, U., H. Michel, and M. Schiffer. 1994. Structure and function of the photosynthetic reaction center from Rhodobacter sphaeroides. J. Bioenerg. Biomembr. 26:5–15. [DOI] [PubMed] [Google Scholar]
- 12.Deisenhofer, J., O. Epp, K. Miki, R. Huber, and H. Michel. 1984. X-ray structure analysis of a membrane protein complex—electron-density map at 3 Å resolution and a model of the chromophores of the photosynthetic reaction center from Rhodopseudomonas viridis. J. Mol. Biol. 180:385–398. [DOI] [PubMed] [Google Scholar]
- 13.Deisenhofer, J., O. Epp, K. Miki, R. Huber, and H. Michel. 1985. Structure of the protein subunits in the photosynthetic reaction center of Rhodopseudomonas viridis at 3 Å resolution. Nature. 318:618–624. [DOI] [PubMed] [Google Scholar]
- 14.Deisenhofer, J., O. Epp, I. Sinning, and H. Michel. 1995. Crystallographic refinement at 2.3-Å resolution and refined model of the photosynthetic reaction center from Rhodopseudomonas viridis. J. Mol. Biol. 246:429–457. [DOI] [PubMed] [Google Scholar]
- 15.Watson, A. J., A. V. Hughes, P. K. Fyfe, M. C. Wakeham, P. Heathcote, and M. R. Jones. 2005. On the role of basic residues in adapting the reaction center-LH1 photosystem for growth at elevated temperatures in purple bacteria. Photosynth. Res. In press. [DOI] [PubMed]
- 16.Heda, G., and M. Madigan. 1989. Purification and characterization of the thermostable ribulose-1,5-bisphosphate carboxylase oxygenase from the thermophilic purple bacterium Chromatium tepidum. Eur. J. Biochem. 184:313–319. [DOI] [PubMed] [Google Scholar]
- 17.Hoff, A. J., and J. Deisenhofer. 1997. Photophysics of photosynthesis: structure and spectroscopy of reaction centers of purple bacteria. Phys. Rep. Rev. Phys. Lett. 287:247. [Google Scholar]
- 18.van Brederode, M. E., and M. R. Jones. 2000. Reaction centers of purple bacteria. In Enzyme-Catalyzed Electron and Radical Transfer. N. S. Scrutton and A. Holzenburg, editors. Kluwer Academic/Plenum Publishers, New York. 621–676.
- 19.Stowell, M. H. B., T. M. McPhillips, D. C. Rees, S. M. Soltis, E. Abresch, and G. Feher. 1997. Light-induced structural changes in photosynthetic reaction center: implications for mechanism of electron-proton transfer. Science. 276:812–816. [DOI] [PubMed] [Google Scholar]
- 20.McAuley, K. E., P. K. Fyfe, J. P. Ridge, N. W. Isaacs, R. J. Cogdell, and M. R. Jones. 1999. Structural details of an interaction between cardiolipin and an integral membrane protein. Proc. Natl. Acad. Sci. USA. 96:14706–14711. [DOI] [PMC free article] [PubMed] [Google Scholar]
- 21.Fyfe, P. K., and M. R. Jones. 2000. Re-emerging structures—continuing crystallography of the bacterial reaction center. Biochim. Biophys. Acta. 1459:413–421. [DOI] [PubMed] [Google Scholar]
- 22.Lancaster, C. R. D., M. V. Bibikova, P. Sabatino, D. Oesterhelt, and H. Michel. 2000. Structural basis of the drastically increased initial electron transfer rate in the reaction center from a Rhodopseudomonas viridis mutant described at 2.00-Ångstrom resolution. J. Biol. Chem. 275:39364–39368. [DOI] [PubMed] [Google Scholar]
- 23.Xu, Q., H. L. Axelrod, E. C. Abresch, M. L. Paddock, M. Y. Okamura, and G. Feher. 2004. X-ray structure determination of three mutants of the bacterial photosynthetic reaction center from Rb. sphaeroides: altered proton transfer pathways. Structure. 12:703–715. [DOI] [PubMed] [Google Scholar]
- 24.Woodbury, N. W., and J. P. Allen. 1995. The pathway, kinetics and thermodynamics of electron transfer in wild-type and mutant bacterial reaction centers of purple nonsulfur bacteria. In Anoxygenic Photosynthetic Bacteria. R. E. Blankenship, M. T. Madigan, and C. E. Bauer, editors. Kluwer Academic Publishers, The Netherlands. 527–557.
- 25.Pierson, B. K., J. P. Thornber, and R. B. Seftor. 1983. Partial purification, subunit structure and thermal stability of the photochemical reaction center of the thermophilic green bacterium Chloroflexus aurantiacus. Biochim. Biophys. Acta. 723:322–326. [Google Scholar]
- 26.Nozawa, T., and M. T. Madigan. 1991. Temperature and solvent effects on reaction centers from Chloroflexus aurantiacus and Chromatium tepidum. J. Biochem. (Tokyo). 110:588–594. [DOI] [PubMed] [Google Scholar]
- 27.Antolini, F., M. Trotta, and C. Nicolini. 1995. Effect of temperature on optical properties of reaction centers organized in Langmuir-Blodgett films. Thin Solid Films. 254:252–256. [Google Scholar]
- 28.Tokaji, Z., J. Tandori, and P. Maroti. 2002. Light- and redox-dependent thermal stability of the reaction center of the photosynthetic bacterium Rhodobacter sphaeroides. Photochem. Photobiol. 75:605–612. [DOI] [PubMed] [Google Scholar]
- 29.Jones, M. R., M. Heerdawson, T. A. Mattioli, C. N. Hunter, and B. Robert. 1994. Site-specific mutagenesis of the reaction center from Rhodobacter sphaeroides studied by Fourier-transform Raman spectroscopy—mutations at Tyrosine M210 do not affect the electronic structure of the primary donor. FEBS Lett. 339:18–24. [DOI] [PubMed] [Google Scholar]
- 30.McAuley-Hecht, K. E., P. K. Fyfe, J. P. Ridge, S. M. Prince, C. N. Hunter, N. W. Isaacs, R. J. Cogdell, and M. R. Jones. 1998. Structural studies of wild-type and mutant reaction centers from an antenna-deficient strain of Rhodobacter sphaeroides: monitoring the optical properties of the complex from bacterial cell to crystal. Biochemistry. 37:4740–4750. [DOI] [PubMed] [Google Scholar]
- 31.Alegria, G., and P. L. Dutton. 1991. Langmuir-Blodgett monolayer films of bacterial photosynthetic membranes and isolated reaction centers—preparation, spectrophotometric and electrochemical characterization. 1. Biochim. Biophys. Acta. 1057:239–257. [DOI] [PubMed] [Google Scholar]
- 32.Baker, J. E. 1987. Reducing bias and inefficiency in the selection algorithm. Proc. ICGA. 2:14–21. [Google Scholar]
- 33.Mühlenbein, H., and D. Schlierkamp-Voosen. 1993. Predictive models for the breeder genetic algorithm. I. Continuous parameter optimization. Evol. Comput. 1:25–49. [Google Scholar]
- 34.Van der Rest, M., and G. Gringas. 1974. The pigment complement of the photosynthetic reaction center isolated from Rhodospirillum rubrum. J. Biol. Chem. 249:6446–6453. [PubMed] [Google Scholar]
- 35.Matsen, F. A., and J. L. Franklin. 1950. A general theory of coupled sets of first-order reactions. J. Am. Chem. Soc. 72:3337–3341. [Google Scholar]
- 36.Lumry, R., and H. Eyring. 1954. Conformation changes of proteins. J. Phys. Chem. 58:110–120. [Google Scholar]
- 37.Ikai, A., and C. Tanford. 1973. Kinetics of unfolding and refolding of proteins. J. Mol. Biol. 73:145–163. [DOI] [PubMed] [Google Scholar]
- 38.M. Sanchez-Ruiz, J. 1992. Theoretical analysis of Lumrey-Eyring models in differential scanning calorimetry. Biophys. J. 61:921–935. [DOI] [PMC free article] [PubMed] [Google Scholar]
- 39.Kodepudi, D., and I. Prigogine. 1999. Modern Thermodynamics: From Heat Engines to Dissipative Structures. John Wiley and Sons, New York.