Abstract
Molecular dynamics simulations have been used to study structural and dynamic properties of fully hydrated mixed 1,2-dipalmitoyl-sn-glycero-3-phosphocholine (DPPC) and 1,2-dipalmitoyl-sn-glycero-3-phosphoethanolamine (DPPE) bilayers at 0, 25, 50, 75, and 100 mol % DPPE. Simulations were performed for 50 ns at 350 K and 1 bar for the liquid-crystalline state of the mixtures. Results show that the average area per headgroup reduces from 0.65 ± 0.01 nm2 in pure DPPC to 0.52 ± 0.01 nm2 in pure DPPE systems. The lipid tails become more ordered with increasing DPPE concentration, resulting in a slight increase in membrane thickness (3.43 ± 0.01 nm in pure DPPC to 4.00 ± 0.01 nm in pure DPPE). The calculated area per headgroup and order parameter for pure DPPE deviates significantly from available experimental measurements, suggesting that the force field employed requires further refinement. In-depth analysis of the hydrogen-bond distribution in DPPE molecules shows that the amine groups strongly interact with the phosphate and carbonyl groups through inter/intramolecular hydrogen bonds. This yields a bilayer structure with DPPE headgroups preferentially located near the lipid phosphate and ester oxygens. It is observed that increasing DPPE concentrations causes competitive hydrogen bonding between the amine groups (hydrogen-donor) and the phosphate/carbonyl groups or water (hydrogen-acceptor). Due to the increasing number of hydrogen-donors from DPPE molecules with increasing concentration, DPPE becomes more hydrated. Trajectory analysis shows that DPPE molecules in the lipid mixtures move laterally and randomly around the membrane surface and the movement becomes more localized with increasing DPPE concentrations. For the conditions and simulation time considered, no aggregation or phase separation was observed between DPPC and DPPE.
INTRODUCTION
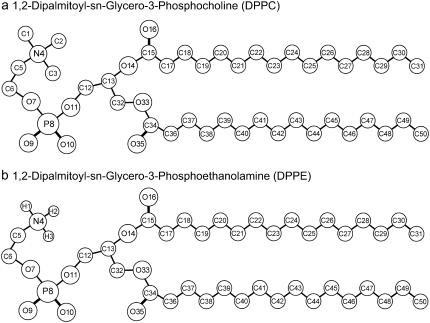
Phosphatidylethanolamine (PE) and phosphatidylcholine (PC) are two of the most important neutral lipid components found in all living organisms. The abundance of PE is highly variable among organisms and cell types. PE is found in high concentration in bacteria (70–80% in Escherichia coli), moderate-low concentration in blood cells (6%), and extremely low concentration in animal cell membranes (1). On the other hand, PC lipids are predominantly found in animal cell membranes (2). The difference between PE and PC lipids is in the chemical composition of the headgroups, namely the primary amine group for PE and the choline group for PC (see Fig. 1). Because of this difference, PE is associated with a wide variety of biological functions including cell division, growth, reproduction, and motility (3–6). Most often found concentrated in the inner leaflet of membranes, PE plays an important role in the membrane fusion mechanism and vesicle formation (7,8). The smaller headgroup in PE results in significantly lower area per lipid (9) and highly ordered hydrocarbon lipid tails (10,11) compared to other lipids. Comparative studies of PE and PC show that PE molecules can form inter- and intramolecular hydrogen bonds, including association with other types of lipids (12), where the amine group (hydrogen-donor) can interact strongly with the phosphate/carbonyl groups or water (hydrogen-acceptor). These strong intermolecular interactions cause an increase in the liquid-crystalline phase transition temperature (13), thus affecting membrane permeability, stability, and other biological properties normally associated with the functional operation of internal cell organelles. All these aspects make lipid research very attractive in terms of membrane organization and functionalities—in particular, in structural, and dynamic properties.
FIGURE 1.
Molecular structures and assigned numbering of atoms for (a) DPPC and (b) DPPE. Chemical symbols are carbon (C), hydrogen (H), nitrogen (N), oxygen (O), and phosphorus (P).
Several experimental studies have investigated the structure of model cell membranes (phospholipid bilayers), including pure PE, mixed PE/PC, and mixed PE lipids. Most of these studies focused on the mechanism of inter- and intramolecular hydrogen bonds and the consequences of these interactions on the structure and phase behavior of PE lipid bilayers. Hitchcock et al. (14) used x-ray diffraction to observe the structure and quantitatively measure the arrangement of artificial and natural membrane of 1,2-dimyristoyl-sn-glycero-3-phosphoethanolamine (DMPE) molecules that were specifically labeled to characterize vibrational isotope effects. They showed that the Sn-1 chain of lipid tails extends perpendicular to the bilayer plane, and the Sn-2 chain first extends in the bilayer plane and then bends and becomes parallel to the Sn-1 chain. This resulted in a different conformation of the ester carbonyl groups where preferential hydrogen bonding between PE lipids or lipid-water can occur. Blume et al. (12) used solid-state 13C and 2H NMR to exam the phase equilibria and dynamic structure of binary mixtures of 1,2-dipalmitoyl-sn-glycero-3-phosphocholine (DPPC) and 1,2-dipalmitoyl-sn-glycero-3-phosphoethanolamine (DPPE). They found a correlation that relates the phase transition of the bilayer to the PE concentration. They further described lipid mixtures as nonideal systems, where the existence of intermolecular hydrogen bonds in PE plays an important role in determining membrane properties. Boggs et al. (15) used differential scanning calorimetry to study the effect of hydrogen-bonding and nonhydrogen-bonding compounds on the phase transition temperature. They found that DPPE, as a hydrogen-donor, has the greatest effect on increasing the phase transition temperature. Hübner and Blume (16) used Fourier transform infrared spectroscopy to study intermolecular interactions of isotropically labeled lipids and water at the interface. Their findings showed that the molecular vibrational modes of the phosphate and ester carbonyl groups are greatly altered as a result of hydrogen bonding between DMPE lipids or DMPE mixtures. Using this method, they were able to distinguish different hydration sites that exist in PE type lipids. Recently, Dyck et al. (17) used surface-sensitive x-ray scattering to study the surface of PE and their mono-, di-, trimethylated (DPPC) derivatives in monolayer conformations. They determined that pure PE monolayer has the smallest headgroup and the orientation of the lipid nitrogen and phosphorus atoms aligned closer to the lipid/water interface as the headgroup size increases.
Several computational works have also been performed on pure PE and PE mixtures to investigate the mechanism of hydrogen-bonding. Damodaran and Merz (18) used molecular dynamics (MD) simulations to examine the water structure around 1,2-dimyristoyl-sn-glycero-3-phosphocholine (DMPC) and 1,2-dilauroyl-sn-glycero-3-phosphoethanolamine (DLPE). They were able to observe various structural properties, such as the hydrogen-bonding interactions between the amine group of DLPE and the neighboring phosphate oxygens, the tight alignment of lipid tails, and the ordering of lipid tail compared to experimental deuterium order parameters. The group of de Vries et al. (19) also used MD simulations to exam 1,2-dioleoyl-sn-glycero-3-phosphocholine (DOPC) and 1,2-dioleoyl-sn-glycero-3-phosphoethanolamine (DOPE) lipid mixtures at various concentrations. They were able to observe a significant reduction in the cross-sectional area of the bilayer by having a small content of DOPE in the model bilayer, which was attributed to the hydrogen-bonding formed by DOPE. They also noted that by increasing the concentration of DOPC in lipid mixtures, the reverse effect was not observed because DOPC cannot disrupt the hydrogen-bond network. Recently, Murzyn et al. (20) used MD to examine 1-palmitoyl-2-oleoyl-sn-glycero-3-[phospho-rac-(1-glycerol)] (POPG) and 1-palmitoyl-2-oleoyl-sn-glycero-3-phosphoethanolamine (POPE) mixtures to mimic the interior of bacteria membrane. They were able to quantify various hydrogen-bonded pairs that exist in the model membrane system. This included intra- and intermolecular hydrogen bonds between lipids, lipid-water hydrogen bonds, water bridges, and lipid-water bridges. Their observations included various structural properties, such as the atomic packing between POPG/POPE, average surface area per lipid molecule, and alkyl chain alignment (large effect in the membrane permeability and stability). In another recent study, Pitman et al. (21) performed molecular dynamics simulations of mixed 1-stearoyl-2-docosahexaenoyl-phophatidylethanolamine (SOPE) and 1-stearoyl-2-docosahexaenoyl-phophatidylcholine (SOPC) bilayer in the presence of cholesterol and rhodopsin to mimic the biological function of the photoreceptor protein. Their findings included various structural properties such as lipid-protein density profile and Voronoi area, which provided evidence for the mechanism by which cholesterol stabilizes rhodopsin. In a separate study, detailed structural and dynamic properties of SOPE bilayer has been reported by Suits et al. (22) and Pitman et al. (23), respectively; the properties analyzed included electron density distribution, lipid order parameter, amine-phosphate hydrogen-bonding network, compressibility modulus, lateral organization, and diffusion. Marrink and Mark (24) used a coarse-grained model with MD to study the fusion and budding mechanism using DOPC and DOPE mixtures. To mimic this phenomenon, they specifically enhanced the hydrogen-bonding capability of DOPE, so these strong interactions allowed a membrane fusion process to occur. Shi and Voth (25) also used a coarse-grained model with MD to investigate the phase separation of mixed DPPC/DPPE lipids. Using this model, they were able to simulate a large lipid mixture system containing 1:1 ratio of DPPC/DPPE (2048 lipid molecules in total). Their observations included various structural properties, such as the atomic packing, average surface area per lipid molecule, alkyl chain alignment, and lateral diffusion coefficient in both liquid-like and solid-like phases.
The molecular dynamics simulations reported in this study provide the essential steps in understanding the complexity of the membrane matrix using atomistic models of the lipids. The main advantage of atomistic MD over the coarse-grained MD is the ability to investigate structural details, but at the cost of computational time and smaller system size. As a result, the lipid systems proposed in this study are large enough to provide a basic building block of model membrane that can be used later to investigate its interactions with various embedded proteins (26–28), peptides (29–31), and other small molecules (32–36). Due to various types of PC and PE lipids that exist in biological systems (PC and PE derivatives), DPPC and DPPE lipid membranes were chosen because of their extensive use in modeling membrane interactions with highly acceptable force-field parameters for DPPC (37,38) and PE derivatives such as DLPE (18) and POPE (39,40). This article also resolves issues of the competition between PE/PC and water for hydrogen bonds for a number of lipid mixture concentrations. This work provides a detailed analysis of the structural and dynamic properties of DPPC/DPPE mixtures commonly encountered in biological systems.
SIMULATION DETAILS
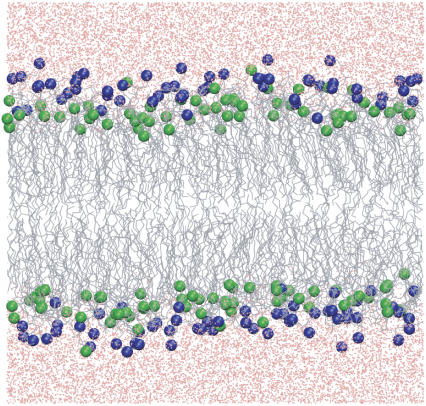
Molecular dynamics simulations were performed on systems containing a total of 256 lipid molecules (128 per leaflet) arranged in a bilayer structure. Fully hydrated systems (30 waters per lipid) containing DPPC and DPPE were studied for the compositions shown in Table 1. Fig. 1 shows the structure and the assigned numbering considered for the atoms in DPPC and DPPE. The initial configuration for Lipid-A (pure DPPC) was constructed from the replication of a previous equilibrated bilayer containing 64 lipids (41). The configurations for the mixed systems (Lipid-B, C, D) were created by randomly replacing DPPC molecules with DPPE molecules, namely the N(CH3)3 (choline) moiety of DPPC by the NH3 (amine) group of DPPE (in the united-atom representation used, the CH3 group is a single site, thus these were replaced by hydrogen atoms and the bond length with the nitrogen adjusted to 1.0 Å). Note that a force field for DPPE is currently unavailable but it is proposed to be composed of the combination of the lipid hydrocarbon tails from DPPC and the lipid headgroup from POPE (see http://www.ucalgary.ca/∼tieleman/download.html for more details). Fig. 2 shows a snapshot of Lipid-C system containing 128 DPPC (headgroups in blue) and 128 DPPE (headgroups in green) molecules. Note that a uniform distribution of DPPC/DPPE molecules was set for both leaflets. For the pure DPPE system (Lipid-E), all DPPC molecules from Lipid-A were converted to DPPE using the same approach described above.
TABLE 1.
Composition for mixed DPPC/DPPE bilayer systems
| System | DPPC/leaflet | DPPE/leaflet | Water |
|---|---|---|---|
| Lipid-A | 128 | 0 | 7680 |
| Lipid-B | 96 | 32 | 7680 |
| Lipid-C | 64 | 64 | 7680 |
| Lipid-D | 32 | 96 | 7680 |
| Lipid-E | 0 | 128 | 7680 |
A total of 256 lipids were used for all systems. Numbers for lipids are per leaflet and each leaflet contains the same number of DPPC and DPPE molecules.
FIGURE 2.
Snapshot of Lipid-C system at 350 K. Colored molecules are DPPC headgroup (blue), DPPE headgroup (green), lipid tails (gray), and water (pink). See Table 1 for additional information.
Intramolecular parameters for bonds, angles, proper dihedral, and improper dihedral were consistent with previous studies (42,43). The Ryckaert-Bellemans potential was used for the torsion potential of the hydrocarbon chains (44). Nonbonded interactions were described by the parameters from Berger et al. (45–47) and partial atomic charges were obtained from Chiu et al. (48). The single-point charge model was adopted for water (49). The united-atom representation was used for the methyl/methylene groups in the alkyl chains of both DPPC and DPPE.
Steepest-decent energy minimization was performed on each system before starting the simulations. Each lipid system was allowed to equilibrate for at least 1 ns, followed by 25 ns for Lipid-A and 50 ns runs for Lipid-B, C, D, and E. Simulations were performed in the NPT ensemble. Temperature and pressure of the simulation box were kept constant using the weak coupling technique (50), with correlation times τT = 0.1 ps and τP = 2.0 ps for the temperature and pressure, respectively. Temperature for all systems was set at 350 K, which is above the liquid-crystalline phase transition temperature of the fully hydrated pure and mixed DPPC/DPPE bilayers (10). Constant pressure was attained by adjustment of the three Cartesian directions (anisotropic pressure coupling) to a pressure of P = 1 bar (compressibility κ = 0.46 × 10⁻⁵ bar−1), thereby allowing the dimensions of the simulation box containing the bilayer to fluctuate independently. Periodic boundary conditions were imposed in all three directions.
The linear constraint solver (LINCS) algorithm was used to constrain all bonds of the lipid molecules (51), and the SETTLE algorithm for water molecules (52). This allowed simulations to be carried out with a 2-fs time-step using the leap-frog integration method (53). Nonbonded interactions were cut off beyond 9 Å. Due to the shortcomings of electrostatic interaction truncations resulting from a simple large cutoff and reaction-field dielectric (54), along with well-documented simulations of biological systems (55–58), we performed our simulations with particle-mesh Ewald (59,60) to account for the long-range electrostatic correction (0.12 nm for the grid size, eighth-order spline interpolation, and real-space cutoff at 9 Å). Trajectories were collected every 2 ps. All simulations were performed with the GROMACS 3.3-beta software package (61,62) (single-precision mode) in parallel (∼3.2 ns/day in 12 nodes) using Virginia Tech's System X (dual 2.3 GHz Apple Xserve G5) (63).
RESULTS AND DISCUSSION
Equilibrium properties, structure, and dynamics for the various DPPC/DPPE/water systems were calculated over the 50-ns simulation runs. To maintain the stability of the lipid system, all simulations were performed above the experimental liquid-crystalline phase transition temperature (∼315 K for pure DPPC (64), ∼324 K for 25 mol % DPPE, ∼329 K for 50 mol % DPPE, ∼333 K for 75 mol % DPPE, and ∼337 K for pure DPPE, as reported by Petrov et al. (10)). Since the abundance of PE across organisms and cell types is highly variable, we have chosen to exam compositions spanning the concentration spectrum (see Table 1). An evenly distributed bilayer of DPPC and DPPE molecules on each leaflet was necessary to create a stable system in which the average area per headgroup in each leaflet was not significantly different and distortion of the simulation box could be neglected. We verified the stability of fully equilibrated lipid systems by monitoring the average area per headgroup over the simulation runs and determining the short-time lateral diffusion coefficient for the lipids from the mean-squared displacement.
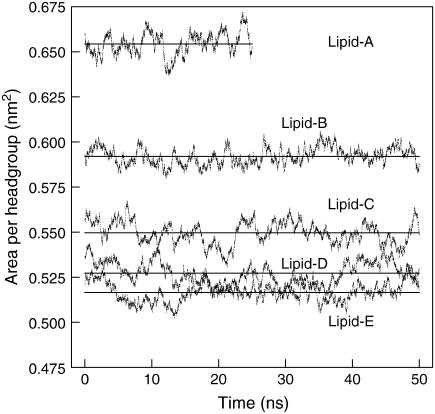
The average area per lipid was calculated from the cross-sectional area of simulation boxes (plane of the bilayer, in this case, along the xy plane) divided by the number of lipids per leaflet (128 lipids). Fig. 3 shows the area per headgroup for the fully equilibrated lipid systems. The average values for pure DPPC and DPPE systems are 0.65 ± 0.01 nm2 and 0.52 ± 0.01 nm2, respectively. For pure DPPC system, the value obtained agrees well with previous MD simulation results at 323 K of ∼0.62 nm2 (65), 0.62 ± 0.01 nm2 (45), ∼0.64 nm2 (54), 0.647 ± 0.002 nm2 (66), 0.645 ± 0.010 nm2 (67), and 0.668 ± 0.007 nm2 at 350 K (34). For the pure DPPE system, the value agrees well with previous simulation for pure DOPE of ∼0.524 nm2 (19) but it is significantly different from the ∼0.58 nm2 mentioned for pure DPPE at 343 K (19) and the experimental result of ∼0.60 nm2 for pure DPPE at 342 K (68). The large discrepancy in the area per headgroup for DPPE is most likely due to the force field, which, as discussed in the Simulation Details section, is a modified DPPC/POPE force field. Consequently, this difference in the area per headgroup will certainly affect the structural properties of the bilayer, in particular the inverse relationship between area per headgroup and the thickness of the bilayer (lipid order parameter) (68–71)—an increase of one results in a decrease of the other. Since the calculated area per headgroup for the pure DPPE system is smaller than the experimental value, the order parameter is reported at higher values (see later section). Coarse-grained MD simulation yielded an area per headgroup of 0.58 nm2 in the liquid-crystalline phase of a 1:1 DPPC/DPPE bilayer (25), a value larger than that obtained here for the same bilayer mixture (0.55 nm2). A summary of the average area per headgroup at the other lipid compositions considered is listed in Table 2. From the area per headgroup, we see that the DPPE force field plays an important role in determining the structural properties of lipid bilayers, since all properties are coupled to the packing of the lipids in the bilayer structure. Our selection of force field for DPPC and DPPE are similar to those reported in the literature (39,40). Our results indicate that further development of a DPPE force field is needed to better reproduce the properties of DPPE bilayers that are consistent with experimental observations. Nonetheless, the current force field provides a reasonable representation of DPPE molecules that results in stable systems in the current simulations.
FIGURE 3.
Area per headgroup for the mixed lipid systems over the course of the simulations. Straight lines show the average area per headgroup. See Table 1 for additional information.
TABLE 2.
Calculated properties of bilayer systems
| System | Area per lipid* | DDPPC† | DDPPE† | Distance P-P‡ |
|---|---|---|---|---|
| Lipid-A | 0.65 ± 0.01 | 0.79 ± 0.1 | — | 3.43 ± 0.01 |
| Lipid-B | 0.59 ± 0.01 | 0.59 ± 0.1 | 0.59 ± 0.1 | 3.66 ± 0.01 |
| Lipid-C | 0.55 ± 0.01 | 0.51 ± 0.1 | 0.48 ± 0.1 | 3.79 ± 0.01 |
| Lipid-D | 0.53 ± 0.01 | 0.57 ± 0.2 | 0.53 ± 0.2 | 3.86 ± 0.01 |
| Lipid-E | 0.52 ± 0.01 | — | 0.32 ± 0.2 | 4.00 ± 0.01 |
D represents two-dimensional (lateral) diffusion coefficient. All results are for simulations at 350 K.
Values reported in nm2.
Values reported as D × 106 cm2/s.
Values reported in nm.
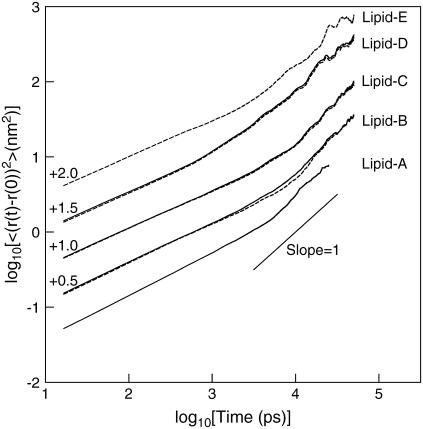
Fig. 4 shows the mean-squared displacement of the lipid molecules for all systems. The solid and dashed lines show the results for DPPC and DPPE, respectively. The calculated two-dimensional diffusion coefficients range from 0.32 ± 0.20 × 10⁻⁶ cm2/s to 0.79 ± 0.10 × 10⁻⁶ cm2/s. These results are in good agreement with previous MD simulations of pure DPPC at 323 K of 0.127 ± 0.005 × 10⁻⁶ cm2/s (67), at 350 K of 0.33 ± 0.1 × 10⁻⁶ cm2/s (34), and coarse-grained MD simulations in the liquid-crystalline phase of ∼0.32 × 10⁻⁶ cm2/s (25). The values of diffusion coefficient for the various lipid systems are also listed in Table 2. Due to a large uncertainty in determining the diffusion coefficients by fitting a line (slope = 1) in Fig. 4, we imposed a larger error estimate for Lipid-D and Lipid-E systems because of high fluctuations in the mean-squared displacement at the diffusive region (see values in Table 2). It is clear that the lipid molecules in Lipid-D and Lipid-E require a longer time to reach the diffusive regime.
FIGURE 4.
Mean-squared displacement of DPPC and DPPE for all lipid systems. Solid and dash-lines represent the displacement of PC and PE lipids, respectively. Short solid line has unity slope. Numbers are the displacement of the lines, shifted for clarity.
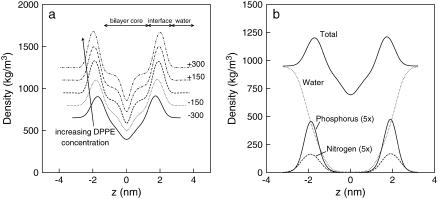
Fig. 5 a shows the total density profiles of the bilayer systems along the normal direction to the bilayer surface (averaged over the 50-ns runs). The interface is the region with the highest density (|1.5–2.5| nm), corresponding to the lipid headgroups. This location of the interface is also confirmed by the phosphorus density profile for pure DPPC systems (Fig. 5 b). Similar features are also observed for the mixed and pure DPPE bilayers (data not shown). The region (|2.5–4.0| nm) of ∼950 kg/m3 corresponds to the aqueous phase, and the section with the lowest density is at the center of the bilayer structure corresponding to the terminal lipid tails. From Fig. 5 a, the distance between the two peaks, which is directly related to the bilayer thickness, increases as the DPPE composition increases, from ∼3.43 nm in pure DPPC to ∼4.00 nm in pure DPPE (this thickness is referred as distance P-P in Table 2). The decrease in area per headgroup accompanied with increase bilayer thickness has been previously observed in both experiments and simulations, which is attributed to the smaller DPPE headgroups and results in a closer packing of the lipids according to the number of DPPE molecules in the system. From this simple quantitative analysis, we concluded that the smaller area per lipid headgroup reduces the mobility of lipid tails by partially constraining the lipid orientation in the plane of the bilayer surface, therefore causing the lipid tails to extend in the direction normal to the membrane. This reasoning is consistent with our observations of increased bilayer thickness with increasing DPPE concentration. However, other factors, such as hydrogen bonding, also play an important role in the structure and dynamics of the bilayer, and these will be considered in detail as well.
FIGURE 5.
(a) Total density profiles of fully hydrated bilayer systems at 350 K. Lines correspond to Lipid-A (solid), Lipid-B (dot), Lipid-C (dash), Lipid-D (dot-dash), and Lipid-E (dot-dot-dash). Numbers are the displacement of the profiles, shifted for clarity. (b) Components density profiles for fully hydrated pure DPPC system at 350 K. Numbers in parentheses are magnification of profiles.
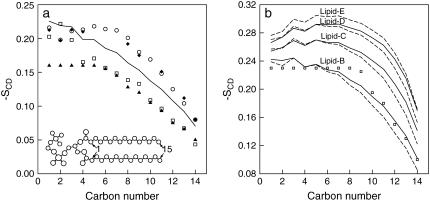
The lipid tail deuterium order parameter SCD (38) is a measure of the orientation and ordering of the phospholipid tails in the bilayer with respect to the bilayer normal. Note that a SCD value of −0.5 corresponds to perfect alignment of the lipid tail to the normal of the bilayer surface. Fig. 6 a shows SCD as a function of the carbon atom along the lipid tails for DPPC. The carbon tails are numbered as follow: Sn-1 chain consists of C34, C36–C50 and Sn-2 of C15, C17–C31 (see Fig. 1). Only the order parameter obtained for pure DPPC is shown in Fig. 6 a. Previous experimental and simulation results are also shown in Fig. 6 a for comparison, which includes NMR measurements of pure DPPC at 323 K (72) and 353 K (68) and simulation results of pure DPPC at 335 K (42) and 350 K (34). Some difference is seen from previous experiments and simulations; however, our result lies within an acceptable range with a similar trend in the order parameter of the lipid tails.
FIGURE 6.
(a) Deuterium order parameter SCD for phospholipid tails for DPPC at 350 K (solid line). Open circles and squares are previous simulation results at 335 K (42) and 350 K (34), respectively. Solid triangles and diamonds are experimental NMR measurement of pure DPPC at 323 K (68) and 353 K (72), respectively. (b) Deuterium order parameter SCD for phospholipid tails for mixed DPPC/DPPE bilayers and pure DPPE systems at 350 K. The average order parameter for DPPC and DPPE are shown as solid and dashed lines, respectively. Open circles are experimental NMR measurements of pure DPPE at 342 K (9).
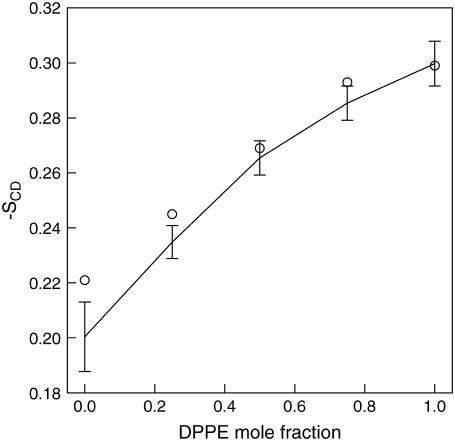
Fig. 6 b shows the order parameter for the mixed lipid systems and the pure DPPE system. Experimental results for DPPE at 342 K (9) are also shown. Currently, several simulations of PE derivatives are available; however, no simulation results of DPPE is available for direct comparison. For the pure DPPE system (Lipid-E), a large difference is also observed between the experimental and current simulation results. As discussed earlier, this is most likely due to the force field, which also affected the area per headgroup. The order parameter in Fig. 6 b indicates that the ordering of the lipid tails increases with increasing DPPE concentration. This behavior is similar to those obtained from the simulations for DOPC and DOPE mixed lipid systems by de Vries et al. (19), as shown in Fig. 7 for the average order parameter of the plateau region of lipid tails, which consists of carbon numbers 2–6. These results indicate that the bilayer is approaching a gel-like state at higher DPPE concentrations, which is directly related to the increase in the phase transition temperature and the number of hydrogen bonds present in DPPE. The results are also consistent with the increase in the bilayer thickness and the decrease in the area per headgroup for increasing concentrations of DPPE in the bilayer. All these properties are closely related since they are all linked to the structure and bilayer fluid state.
FIGURE 7.
Average order parameter in the plateau region for pure and mixed DPPC/DPPE bilayer systems. The average is calculated from the order parameter of the first five carbon atoms in the lipid tails (carbon numbers 2–6 for all lipids as shown in Fig. 6). Circles are the average order parameter for pure and mixed DOPC/DOPE lipid systems in the plateau region reported by de Vries et al. (19). Error bars are estimated standard deviation.
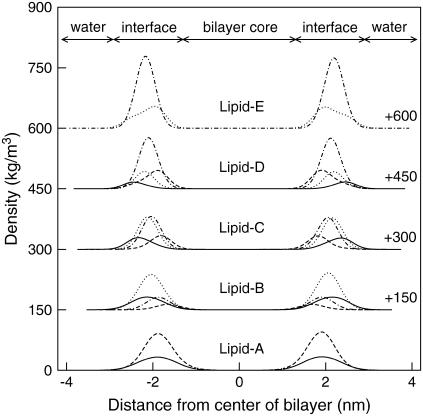
Another useful property to describe the structure of the bilayers is the nitrogen and phosphorus density profiles for both DPPC and DPPE, as shown in Fig. 8 (the height of the distributions corresponds well with the lipid compositions). For the pure DPPC system (Lipid-A), it is clear that the nitrogen density profile (solid line) is aligned at approximately the same position as the phosphorus density profile (dash line). A closer inspection shows that the distribution of nitrogen extends slightly further to the aqueous phase, that is, the N(CH3)3 (choline) group is fully hydrated. In contrast, the density profile of nitrogen (dot line) for the pure DPPE system (Lipid-E) extends toward the bilayer core beyond the phosphorus density profile (dot-dash line). This indicates that the NH3 (amine) group in DPPE favors interactions with the phosphate and/or carbonyl groups. One explanation for this behavior is the preferential hydrogen-bonding with the lipid oxygens located around the headgroups (experimentally observed by Hübner and Blume (16) and computationally by Damodaran and Merz (18), de Vries et al. (19), and Murzyn et al. (20)). This observation is more pronounced in the mixed lipids (Lipid-B, C, D) where the profile for the DPPC choline group (solid line) extends into the aqueous phase and the DPPE amine group (dot line) toward the bilayer core. Note that the profiles of the phosphorus atoms for DPPC and DPPE in the Lipid-C system are almost overlapping, and the profiles of the nitrogen atoms are either closer to the water interface (DPPC nitrogen) or closer to the bilayer core (DPPE nitrogen). This preferential interaction of the headgroups results from the type of interactions, which in the case for choline is the hydrophobic hydration around the CH3 groups, and for amine is the competition of hydrogen bonds with water and oxygen atoms in the headgroups. Fig. 2 clearly demonstrates these phenomena for the Lipid-C system where most of the DPPC headgroups (represented in blue) point toward the aqueous phase and the majority of DPPE headgroups (represented in green) point toward the bilayer core (gray).
FIGURE 8.
Density profile of nitrogen and phosphorus in the lipids for mixed bilayer systems at 350 K. Lines correspond to PC nitrogen (solid), PC phosphorus (dash), PE nitrogen (dot), and PE phosphorus (dot-dash). Note the various regions of the bilayer shown. Numbers are the displacement of the profiles, shifted for clarity.
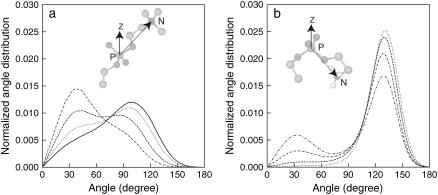
To further confirm and quantify the preferential positioning of the choline and amine groups, we calculated the average intramolecular angle for the phosphorus (P) to nitrogen (N) vector for both DPPC and DPPE, and determined the average number of hydrogen bonds between NH3 of DPPE (H-donor) and oxygen atoms (H-acceptor in lipids and water) in the systems. The intramolecular angle was computed from the angle formed between the P-N vector (phosphorus and nitrogen in the same lipid) and the axis normal to the bilayer surface (z-axis). Fig. 9 illustrates the vector and angles considered, as well as the normalized angle distribution for the P-N vector for the different lipid systems. An angle of 0° corresponds to a vector aligned with the axis of reference pointing toward the aqueous phase, and an angle of 180° corresponds to a vector pointing toward the bilayer core. Note that the angle distributions for DPPC and DPPE are shown in Fig. 9, a and b, respectively. For DPPC, the angle distributions of Lipid-A to D are broad with distinct maximum. For Lipid-A, the wide distribution peaks at ∼100°, indicating that the choline groups are exposed to the aqueous phase and are unhindered to take any orientation. As the concentration of DPPC decreases, the angle distribution for the DPPC groups shifts to lower values (maxima at ∼40° in Lipid-D), suggesting that most of the choline groups are pointing straight up aligning with the bilayer normal, thus being more exposed to the aqueous phase. This is caused by the closer packing of the lipids in the presence of DPPE as observed in the reduction of the area per headgroup. For DPPE in Lipid-B to E, the majority of the angles for the P-N vector is >90°, indicating that most of the amine groups in DPPE are favorably interacting with lipid oxygen atoms (Fig. 9 b). We also observe that a bimodal distribution for the angle of the P-N vector becomes more pronounced with increasing DPPE concentration. This strongly suggests that there are two preferential binding sites: one near the interface (distribution <90°) and one near the lipid oxygen atoms (distribution >90°). In general, we would expect that additional DPPE molecules should induce more hydrogen bonds of DPPE with lipid oxygen atoms and, consequently, increase the angle in the distribution curves in the limit to pure DPPE. However, the results indicate otherwise, and they can be reasoned as follows: the fact that there are more H-donors from NH3 groups in DPPE than available H-acceptors from lipid oxygens, there is a competition for hydrogen bonds between lipid oxygens and water; and since H-donors are in excess, hydrogen bonds with water near the lipid-water interface becomes more favorable, thus decreasing the average tilt angle of the P-N vector as seen in the bimodal distribution curves.
FIGURE 9.
Normalized angle distribution for P-N vector for (a) DPPC in Lipid-A to Lipid-D and (b) DPPE in Lipid-B to Lipid-E. Angle is measured with respect to the normal of the bilayer surface (z-axis). Lipid systems are represented by the following lines: solid (Lipid-A), dot (Lipid-B), dash (Lipid-C), dot-dash (Lipid-D), and dot-dot-dash (Lipid-E). Pictorial representation for P-N vector is shown in the figure.
An extensive analysis of the hydrogen-bonding with the NH3 group was performed to provide greater insight into the structure of the bilayer. Here, a hydrogen bond is defined according to the criteria suggested by Brady and Schmidt (73), where the distance between the donor and acceptor (in this case, nitrogen-oxygen) is within 0.35 nm and the angle donor-hydrogen-acceptor is between 120 and 180°. Table 3 shows the average number of hydrogen bonds between NH3 in DPPE and all other oxygen atoms, including lipids and water, for each system with DPPE. The oxygen sites available as H-acceptor are located at the phosphate group (O7, O9, O10, and O11), at the two carbonyl groups (O14, O16, O33, O35), and water (OW). Fig. 1 shows the pertinent oxygen sites on the lipids. Separate calculations were performed for DPPC and DPPE to differentiate the hydrogen-bond contributions from each lipid. We also separated the contributions resulting from inter- and intramolecular hydrogen bonds for DPPE. From the results shown in Table 3, it is evident that there are two preferential sites with which the NH3 group in PE form intramolecular hydrogen bonds—namely, O7 and O16. Note that intramolecular hydrogen bonds are observed for every lipid oxygen, even though some values reported may be negligible (e.g., the number of intramolecular hydrogen bonds between NH3 and O33 is approximately zero). The total average number of hydrogen bonds per NH3 group is independent of the DPPE concentration at ∼2.74–2.78 (last row in Table 3). This is expected because NH3 has three H-donors, thus it is able to form a total of three hydrogen bonds. The majority of hydrogen bonds are from the association with the oxygen groups denoted by O7 in the DPPE phosphate group, O16 in both the DPPC and DPPE carbonyl oxygen groups, and OW from water molecules, accounting for >80% of the total hydrogen bonds with the NH3 groups (calculated by adding the hydrogen-bond contributions of the four groups and then dividing by the total number of hydrogen bonds).
TABLE 3.
Inter- and intramolecular hydrogen bonds with NH3 group in DPPE
| Lipid-B
|
Lipid-C
|
Lipid-D
|
Lipid-E
|
||||||||
|---|---|---|---|---|---|---|---|---|---|---|---|
| Acceptor | PC* | PE* | PE† | PC* | PE* | PE† | PC* | PE* | PE† | PE* | PE† |
| O7 | 1.0 | 0.0 | 55.1 | 2.2 | 0.0 | 103.2 | 1.5 | 0.1 | 159.9 | 0.2 | 214.3 |
| O9 | 0.8 | 0.1 | 0.0 | 1.7 | 1.0 | 0.1 | 1.6 | 3.6 | 0.5 | 8.7 | 0.4 |
| O10 | 1.7 | 0.4 | 0.0 | 3.7 | 1.7 | 0.1 | 3.2 | 5.6 | 0.3 | 12.2 | 0.5 |
| O11 | 7.4 | 0.8 | 0.3 | 13.4 | 5.0 | 0.7 | 9.7 | 17.5 | 1.2 | 26.8 | 1.7 |
| O14 | 8.7 | 1.0 | 1.3 | 14.4 | 7.0 | 2.6 | 11.7 | 20.6 | 2.8 | 35.5 | 2.5 |
| O16 | 25.2 | 3.3 | 46.9 | 39.1 | 8.6 | 82.4 | 24.7 | 28.2 | 109.9 | 60.2 | 116.0 |
| O33 | 0.1 | 0.0 | 0.0 | 0.2 | 0.1 | 0.0 | 0.2 | 0.2 | 0.0 | 0.4 | 0.0 |
| O35 | 2.4 | 0.4 | 0.9 | 3.5 | 2.8 | 2.2 | 2.8 | 6.0 | 2.3 | 10.3 | 2.1 |
| OW | 19.2 | 56.1 | 119.8 | 208.5 | |||||||
| Total H-bond | 177 ± 20 | 352 ± 31 | 534 ± 38 | 700 ± 40 | |||||||
| H-bond to H2O/NH3 | 0.30 ± 0.06 | 0.44 ± 0.05 | 0.62 ± 0.04 | 0.81 ± 0.04 | |||||||
| Intra-H-bond/NH3 | 1.63 ± 0.14 | 1.49 ± 0.09 | 1.44 ± 0.08 | 1.32 ± 0.06 | |||||||
| Inter-H-bond/NH3 | 0.84 ± 0.11 | 0.82 ± 0.10 | 0.71 ± 0.08 | 0.60 ± 0.06 | |||||||
| H-bonds/NH3 | 2.77 ± 0.31 | 2.75 ± 0.24 | 2.78 ± 0.20 | 2.74 ± 0.16 | |||||||
Tabulated values are the ensemble average of hydrogen bonds. Average number of hydrogen bonds per NH3 are also shown in the table.
Intermolecular hydrogen bonds.
Intramolecular hydrogen bonds.
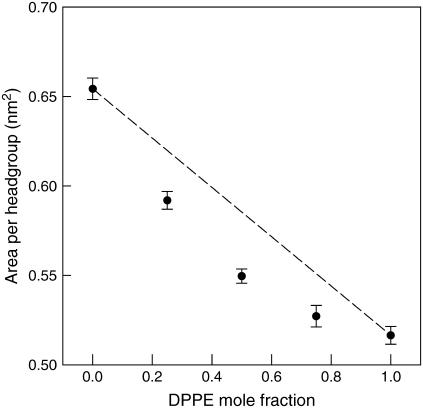
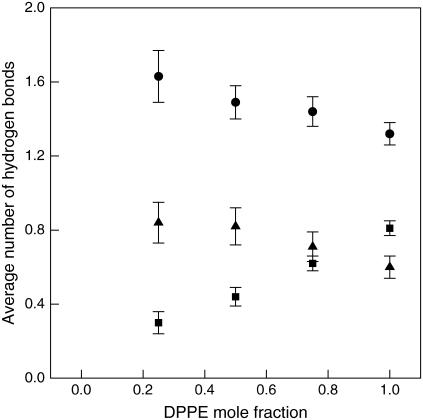
Evidently, the total number of hydrogen bonds between NH3 and lipid oxygens or water plays an important role in determining the average area per headgroup. The total number of hydrogen bonds increases from 177.23 (Lipid-B) to 700 (Lipid-E) while the average area per headgroup decreases from 0.592 to 0.517 nm2. If we were to assume that the area per headgroup for the mixed systems is simply a linear average of the pure lipids, we would obtain the dash-line shown in Fig. 10. However, as shown in the figure, the area per headgroup significantly deviates from the ideal case. For example, there is an ∼9.5% reduction in area per headgroup from Lipid-A (pure DPPC) to Lipid-B (25% DPPE), whereas the ideal case predicts a 5.2% reduction. The percentage reduction in the area per headgroup from Lipid-B to C, Lipid-C to D, and Lipid-D to E, are 7.1%, 4.2%, and 1.9%, respectively. The fact that the area per headgroup decreases nonlinearly and the percentage reduction becomes smaller with increasing DPPE concentration can be explained by there being more H-donors than available H-acceptors as the DPPE concentration increases, resulting in a competition between the lipid oxygens and water for hydrogen bonds with the NH3 group. The presence of more water molecules near the NH3 groups in DPPE increases the hydration of the lipids, thus causing a smaller decrease in the area per headgroup than would otherwise occur. This is seen from the data in Fig. 11 that shows the increase in the number of hydrogen bonds between NH3 and water per DPPE, while the number of inter- and intramolecular hydrogen bonds per NH3 decreases with increasing DPPE concentration. A similar behavior has been observed by de Vries et al. (19) in DOPC/DOPE mixtures in which the area per headgroup decreased nonlinearly with increasing PE content. The study by Gurtovenko et al. (74) on DMPC and dimyristoyltrimethylammonium propane (DMTAP) mixtures, a neutral and cationic lipid, respectively, also showed a nonlinear dependence of the area per headgroup with a minimum at ∼0.5 mol fraction. In our systems, DPPC and DPPE are both neutral lipids and their mixtures do not expand due to the increased charge concentration and electrostatic repulsion as observed in the results by Gurtovenko et al. (74) for mixed DMPC/DMTAP lipid systems.
FIGURE 10.
Average area per headgroup for the various DPPE compositions at 350 K. Actual values are reported in Table 2. Dash-line is the ideal case if the area per headgroup decreased linearly with increasing DPPE concentration.
FIGURE 11.
Hydrogen bonds for NH3 group in DPPE. Squares are the average number of hydrogen bonds between NH3 and water per DPPE molecule. Triangles and circles are the average number of inter- and intramolecular hydrogen bonds per NH3, respectively. Actual values are reported in Table 3. Error bars represent standard deviations.
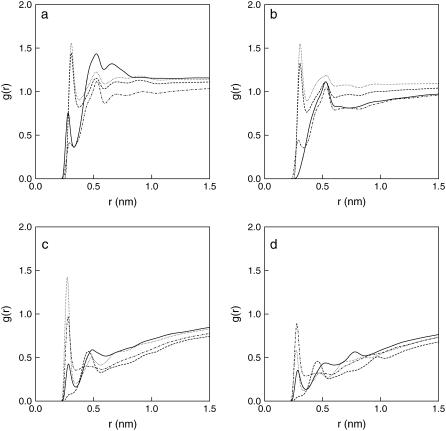
Additional analysis of the hydrogen bonds was performed to investigate the effect of lipid hydration with increasing DPPE concentration. Various radial distribution functions (RDF) between lipid oxygen atoms and water were calculated, as those shown in Fig. 12 for the Lipid-C system (RDFs were calculated separately for DPPC and DPPE). RDFs for the other compositions are not shown for the sake of brevity, but they are all similar to those in Fig. 12. The hydration radius for each lipid oxygen was found by determining the distance of the first minimum in the RDFs. Most RDFs showed a well-defined peak below 0.35 nm, confirming possible hydrogen bonds within the hydration radius based on the criteria suggested by Brady and Schmidt (73). Table 4 summarizes the hydration radius for the various lipid oxygens obtained from the RDF curves. As seen in Fig. 12, some hydration radii are not available because no minima were found in the RDFs, namely for the O7 from DPPE and O33 from both DPPC and DPPE. Close inspection of the values in Table 4 indicates that, on the average, the hydration radius for DPPC is larger than that for DPPE at the phosphate group (O9 and O10). On the other hand, DPPE is more hydrated at the carbonyl groups, especially at O35. For O16, the hydration radius is smaller because the amine group forms intramolecular hydrogen bonds and reduces the number of contacts with surrounding water (see Table 3 for more details). Once the number of water molecules within the hydration radius are determined, the number of hydrogen bonds between lipid oxygen atoms (H-acceptor) and water (H-donor) can be calculated using the prior criteria defining a hydrogen bond (73).
FIGURE 12.
Radial distribution functions for lipid oxygen atoms and water for Lipid-C system. The plots correspond to water interacting with (a) DPPC phosphate group, (b) DPPE phosphate group, (c) DPPC ester group, and (d) DPPE ester group. Phosphate oxygen atoms are represented as follows: O7 (solid line), O9 (dot line), O10 (dash line), and O11 (dot-dash line). Ester oxygen atoms are represented as follows: O14 (solid line), O16 (dot line), O33 (dash line), and O35 (dot-dash line).
TABLE 4.
Hydration radius around lipid oxygen atoms
| PC headgroup
|
PE headgroup
|
|||||||||
|---|---|---|---|---|---|---|---|---|---|---|
| Lipid-A | Lipid-B | Lipid-C | Lipid-D | Average | Lipid-B | Lipid-C | Lipid-D | Lipid-E | Average | |
| O7 | 0.330 | 0.330 | 0.330 | 0.330 | 0.330 | — | — | — | — | — |
| O9 | 0.374 | 0.374 | 0.376 | 0.376 | 0.375 | 0.364 | 0.366 | 0.366 | 0.366 | 0.366 |
| O10 | 0.370 | 0.372 | 0.374 | 0.376 | 0.373 | 0.364 | 0.362 | 0.364 | 0.364 | 0.364 |
| O11 | 0.328 | 0.330 | 0.328 | 0.328 | 0.329 | 0.336 | 0.334 | 0.334 | 0.330 | 0.334 |
| O14 | 0.346 | 0.346 | 0.346 | 0.346 | 0.346 | 0.360 | 0.356 | 0.354 | 0.352 | 0.356 |
| O16 | 0.346 | 0.346 | 0.346 | 0.346 | 0.346 | 0.334 | 0.336 | 0.338 | 0.338 | 0.337 |
| O33 | — | — | — | — | — | — | — | — | — | — |
| O36 | 0.346 | 0.346 | 0.352 | 0.348 | 0.348 | 0.352 | 0.354 | 0.352 | 0.354 | 0.353 |
Average values are shown for comparison between DPPC and DPPE hydration radii at various lipid oxygen atoms. All values reported in nm.
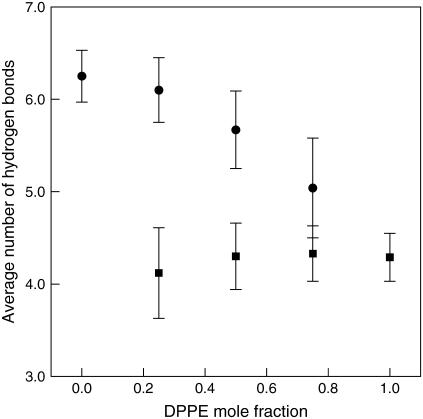
Table 5 shows the average number of hydrogen bonds between lipid oxygen atoms and water for all lipid systems. Note that the small number of hydrogen bonds in DPPE between water and O7 or O16 results from the preferred association of these sites with the amine group, which in turn expels most of the water around O7 (closest to the amine group) and some around O16. This can also explain why there was not a hydration shell around O7 and a significant reduction in the hydration radius at O16 (see Table 4). On the other hand, the low number of hydrogen bonds between water and O33 was somewhat unexpected because the formation of hydrogen bonds with the amine group (Table 3) and the hydration shell were not observed (Fig. 12). In this case, it may be simply caused by the alignment of lipids that prevents any favorable hydrogen-bond interaction to occur at O33 (discussed by (14)). Note that there are a significant number of hydrogen bonds occurring at O35 (locate below O33) which eliminates the possibility that O33 is too deep into the bilayer. The total number of hydrogen bonds between water and lipid oxygen atoms is found to decrease with increasing DPPE concentration, as shown in Table 5. This is expected because the amine group in DPPE can form intermolecular hydrogen bonds with both DPPC and neighboring DPPE in addition to intramolecular hydrogen bonds. In either case, the amine group is competing with water molecules for hydrogen bonds with the lipid oxygens. As a result, the average number of hydrogen bonds per DPPC molecule, between water and lipid oxygen atoms, decreases with increasing DPPE concentration (∼6.47–5.04 in Fig. 13). In contrast, the number of water/lipid oxygen hydrogen bonds per DPPE increases with DPPE concentration (∼4.12–4.29 in Fig. 13). These results are expected and are a confirmation of earlier discussions: the number of hydrogen bonds between NH3 and water per DPPE increases, whereas the average number of inter- and intramolecular hydrogen bonds between lipid molecules decrease with increasing DPPE concentration, thus making lipid oxygen atoms in DPPE and water available to form hydrogen bonds.
TABLE 5.
Intermolecular hydrogen bonds with water
| Acceptor | Lipid-A* | Lipid-B* | Lipid-B† | Lipid-C* | Lipid-C† | Lipid-D* | Lipid-D† | Lipid-E† |
|---|---|---|---|---|---|---|---|---|
| O7 | 154.0 | 113.8 | 2.0 | 75.2 | 4.6 | 37.3 | 8.7 | 14.2 |
| O9 | 373.6 | 279.1 | 87.6 | 180.8 | 178.2 | 86.1 | 269.8 | 357.3 |
| O10 | 359.1 | 257.7 | 71.5 | 165.9 | 148.8 | 80.6 | 230.4 | 307.4 |
| O11 | 81.3 | 61.4 | 21.5 | 38.2 | 42.8 | 18.9 | 63.5 | 80.9 |
| O14 | 106.4 | 73.8 | 20.2 | 45.3 | 38.9 | 0.0 | 56.5 | 68.8 |
| O16 | 349.8 | 225.7 | 18.5 | 122.2 | 49.4 | 54.1 | 75.6 | 104.4 |
| O33 | 23.2 | 14.5 | 2.4 | 8.7 | 6.0 | 4.1 | 8.6 | 11.5 |
| O35 | 209.6 | 144.8 | 40.4 | 89.1 | 81.5 | 41.6 | 117.3 | 152.9 |
| Total H-bonds | 1657 ± 76 | 1171 ± 67 | 264 ± 31 | 725 ± 54 | 550 ± 47 | 322 ± 35 | 830 ± 57 | 1097 ± 67 |
| H-bond/lipid | 6.47 ± 0.30 | 6.10 ± 0.35 | 4.12 ± 0.49 | 5.67 ± 0.42 | 4.30 ± 0.36 | 5.04 ± 0.54 | 4.33 ± 0.30 | 4.29 ± 0.26 |
Tabulated values are the ensemble average of hydrogen bonds. Average number of hydrogen bonds per lipid are also shown in the table.
Hydrogen bonds in DPPC molecules.
Hydrogen bonds in DPPE molecules.
FIGURE 13.
Hydrogen bonds for lipid oxygen atoms. Circles are the average number of hydrogen bonds between DPPC oxygen atom and water per DPPC molecule, and squares are the average number of hydrogen bonds between DPPE oxygens and water per DPPE molecule. Actual values are reported in Table 5. Error bars represent standard deviations.
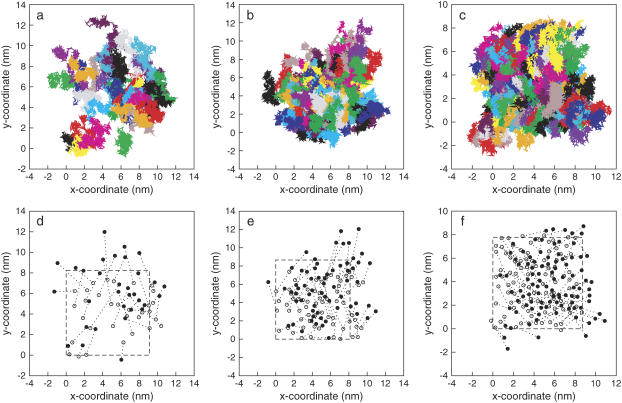
Another important aspect of mixed lipid bilayers is their dynamic properties, in particular the mixing of the lipids. We have investigated the lateral movement of DPPE molecules on the surface of the bilayer based on the trajectories accumulated over the length of the simulations. Fig. 14, a–c, show the lateral movement (along the xy-plane) of phosphorus atoms on one of the leaflets of Lipid-B, Lipid-C, and Lipid-D, respectively. Each color represents a different phosphorus atom in the system. Fig. 14, d–f, show only the initial (open circles) and final (solid circles) positions of the phosphorus atoms after 50 ns. For clarity, periodic boundaries were removed from the coordinates. The outline of the simulation box along the xy-plane at 50 ns is drawn as dash-line. It is clear that the movement of DPPE is random and the molecules have no tendency to move in any particular direction along the bilayer. Note that the majority of the DPPE molecules moves rapidly around the membrane surface (∼2.7 nm in Lipid-B from the initial position), but they become more restricted with increasing DPPE concentration (∼2.5 nm in Lipid-C and 1.9 nm in Lipid-D). The displacements are estimated from the distances the DPPE molecules travel laterally during the simulation (see Fig. 14, d–f for the initial and final positions). The high mobility of DPPE in Lipid-B from their original position suggests that there are strong interactions causing the molecules to diffuse laterally through the bilayer. It is probable that intermolecular hydrogen bonds between the lipids facilitate their diffusion. At higher DPPE concentration (Lipid-D), DPPE seems to show less mobility as the displacement of the molecules is relatively small. This may be a direct result of hydrogen-bond competition between NH3 in DPPE and water at the interface, which reduces the interactions between lipids, thus making the movement of DPPE more localized. It is also seen from Fig. 14 that there is no aggregation between lipids as their diffusion is random along the membrane leaflet.
FIGURE 14.
Lateral movement of phosphorus atoms in DPPE along the xy-plane on one of the leaflets in (a) Lipid-B, (b) Lipid-C, and (c) Lipid-D systems. Each color represents one DPPE molecule. For clarity, the corresponding initial (open circles) and final (solid circles) positions of phosphorus atoms are shown in d, e, and f. Outline of the final simulation box dimension is shown as dash-line. Coordinates are plotted without periodic boundary conditions.
CONCLUSIONS
We have presented a systematic simulation study of mixed lipid bilayer systems containing DPPC and DPPE. For the pure DPPC system, the calculated area per headgroup and the lipid order parameter agree well with previous experimental and simulation results. Selected experimental results (i.e., area per headgroup and lipid order parameter) for pure DPPE are available for comparison, but no simulation results have been reported. To be consistent with other derivatives of PE bilayer simulations, we created a force field for DPPE molecules by modifying the DPPC force field using the POPE force field as the basis to change the choline to an amine headgroup. The results show large discrepancies between the simulation and experimental values in the area per headgroup and order parameter for the pure DPPE and mixed 1:1 DPPC/DPPE systems. This leads us to believe that further development of the DPPE force field is needed to improve its accuracy in reproducing experimental properties of PE bilayers.
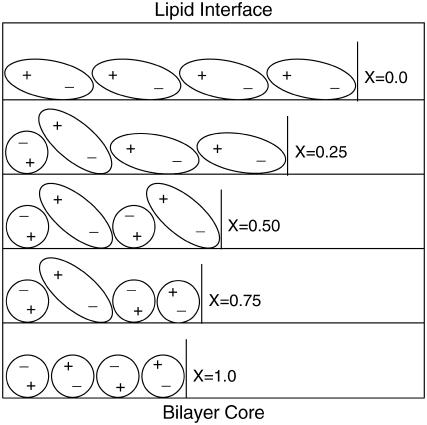
DPPE exhibits unique and distinct characteristics, particularly in its ability to strongly interact with itself and neighboring lipids through inter- and intramolecular hydrogen bonds. Increasing DPPE content in the bilayer results in a significant decrease in area per lipid and higher deuterium order parameters (lipid tails become more aligned within the bilayer normal). Detailed analysis of the density profile for the nitrogen and phosphorus atoms in the lipids shows that the amine groups in DPPE prefer to hydrogen-bond with lipid oxygens. In this process, the P-N vector of the DPPE headgroup is most often found pointing toward the bilayer core, whereas the P-N vector for DPPC points toward the aqueous phase. The average intramolecular tilt angle, with respect to the bilayer normal, of the P-N vector for both DPPC and DPPE decreases with increasing DPPE concentration. For DPPC, the choline group becomes more aligned with the bilayer normal due to the close packing of the lipids (smaller area per headgroup). On the other hand, for DPPE, there are more H-donors from NH3 groups than available H-acceptors from lipid oxygen atoms, thus resulting in a competition between lipid oxygen atoms and water for hydrogen bonds. An increase in the number of hydrogen bonds between the NH3 group and water coupled with a decrease in inter/intramolecular hydrogen bonds between the lipids as the DPPE concentration increases are the main cause for the reduction in the average P-N vector tilt angle. The results obtained can be summarized in a simple schematic representation of the structure of the headgroups, as shown in Fig. 15. If we consider the direction of the P-N vector (phosphate group is negatively charged and choline or amine group is positively charged; see Fig. 9 for orientation of P-N vector), it is clear from Fig. 9 that the average angle of the P-N vector decreases with increasing DPPE concentration. From this simple schematic picture, the area per headgroup decreases nonlinearly with increasing DPPE concentration, which reflects the results obtained from the simulations.
FIGURE 15.
Schematic of the arrangement of the DPPC and DPPE headgroups in the bilayer. DPPC and DPPE are represented as ovals (large headgroup) and circles (small headgroup), respectively. The plus-symbol represents the charge in the choline or amine group, and the minus-symbol the charge in the phosphate group. Orientation of the bilayer and DPPE mole fraction are shown in the figure. Water and lipid tails are excluded for clarity.
Our analysis shows that there are two preferential sites (O7 and O16) for intramolecular hydrogen-bond with the NH3 groups. The hydration of the lipids in the mixture indicates that DPPC is more hydrated at the phosphate group and less hydrated at the ester group compared to DPPE. The average number of hydrogen bonds between DPPC and water decreases with increasing DPPE concentration, which is mainly because the amine group in DPPE forms intermolecular hydrogen bonds with DPPC. The favorable and increasing interaction of DPPE with water, along with a decrease of inter- and intramolecular interactions between the lipids, leads to an increase in the number of hydrogen bonds of water with the lipid oxygens.
From the trajectory analysis, the majority of the DPPE molecules rapidly move around the membrane surface, but they become more restricted with increasing DPPE concentrations. The high mobility of DPPE from their original position suggests that there are strong interactions causing the molecules to diffuse laterally through the bilayer. Based on our hydrogen-bonding analysis, intermolecular hydrogen bonds between the lipids facilitate their diffusion. On the other hand, less movement suggests that the hydrogen bonds competition between the amine groups in DPPE and water at the interface reduces the interactions between lipids, resulting in a more localized displacement of DPPE. The random diffusion of DPPE molecules along the membrane leaflet does not indicate any aggregation of lipids within the simulation time considered.
Acknowledgments
The computational resources were provided by Virginia Tech Terascale Computing Facility (System X). The authors thank Zhao Wei and Joseph W. Lambert for their comments and valuable discussion. Special thanks to Wilfredo Colón-Santiago for his insightful discussion and comments on biological membranes.
References
- 1.Dowhan, W. 1997. Molecular basis for membrane phospholipid diversity: why are there so many lipids? Annu. Rev. Biochem. 66:199–232. [DOI] [PubMed] [Google Scholar]
- 2.Uran, S., Å. Larsen, P. B. Jacobsen, and T. Skotland. 2001. Analysis of phospholipid species in human blood using normal-phase liquid chromatography coupled with electrospray ionization ion-trap tandem mass spectrometry. J. Chromatogr. B. 758:265–275. [DOI] [PubMed] [Google Scholar]
- 3.Emoto, K., T. Kobayashi, A. Yamaji, H. Aizawa, I. Yahara, K. Inoue, and M. Umeda. 1996. Redistribution of phosphatidylethanolamine at the cleavage furrow of dividing cells during cytokinesis. Proc. Natl. Acad. Sci. USA. 93:12867–12872. [DOI] [PMC free article] [PubMed] [Google Scholar]
- 4.Storey, M. K., K. L. Clay, T. Kutateladze, R. C. Murphy, M. Overduin, and D. R. Voelker. 2001. Phosphatidylethanolamine has an essential role in Saccharomyces cerevisiae that is independent of its ability to form hexagonal phase structures. J. Biol. Chem. 276:48539–48548. [DOI] [PubMed] [Google Scholar]
- 5.Martínez, P., and A. Morros. 1996. Membrane lipid dynamics during human sperm capacitation. Front. Biosci. 1:d103–d117. [DOI] [PubMed] [Google Scholar]
- 6.Kearns, D. B., J. Robinson, and L. J. Shimkets. 2001. Pseudomonas aeruginosa exhibits directed twitching motility up phosphatidylethanolamine gradients. J. Bacteriol. 183:763–767. [DOI] [PMC free article] [PubMed] [Google Scholar]
- 7.Birner, R., M. Bürgermeister, R. Schneiter, and G. Daum. 2001. Roles of phosphatidylethanolamine and of its several biosynthetic pathways in Saccharomyces cerevisiae. Mol. Biol. Cell. 12:997–1007. [DOI] [PMC free article] [PubMed] [Google Scholar]
- 8.Jahn, R., and H. Grubmüller. 2002. Membrane fusion. Curr. Opin. Cell Biol. 14:488–495. [DOI] [PubMed] [Google Scholar]
- 9.Thurmond, R. L., S. W. Dodd, and M. F. Brown. 1991. Molecular areas of phospholipids as determined by 2H NMR spectroscopy. Comparison of phosphatidylethanolamines and phosphatidylcholines. Biophys. J. 59:108–113. [DOI] [PMC free article] [PubMed] [Google Scholar]
- 10.Petrov, A. G., K. Gawrisch, G. Brezesinski, G. Klose, and A. Möps. 1982. Optical detection of phase transitions in simple and mixed lipid-water phases. BBA Biomembr. 690:1–7. [DOI] [PubMed] [Google Scholar]
- 11.Urbina, J. A., B. Moreno, W. Arnold, C. H. Taron, P. Orlean, and E. Oldfield. 1998. A carbon-13 nuclear magnetic resonance spectroscopic study of inter-proton pair order parameters: a new approach to study order and dynamics in phospholipid membrane systems. Biophys. J. 75:1372–1383. [DOI] [PMC free article] [PubMed] [Google Scholar]
- 12.Blume, A., R. J. Wittebort, S. K. Das Gupta, and R. G. Griffin. 1982. Phase equilibria, molecular conformation, and dynamics in phosphatidylcholine phosphatidylethanolamine bilayers. Biochemistry. 21:6243–6253. [DOI] [PubMed] [Google Scholar]
- 13.Huang, C., and S. Li. 1999. Calorimetric and molecular mechanics studies of the thermotropic phase behavior of membrane phospholipids. BBA Biomembr. 1422:273–307. [DOI] [PubMed] [Google Scholar]
- 14.Hitchcock, P. B., R. Mason, and G. G. Shipley. 1975. Phospholipid arrangements in multilayers and artificial membranes: quantitative analysis of the x-ray diffraction data from a multilayer of 1,2-dimyristoyl-DL-phosphatidylethanolamine. J. Mol. Biol. 94:297–299. [DOI] [PubMed] [Google Scholar]
- 15.Boggs, J. M., G. Rangaraj, and K. M. Koshy. 1986. Effect of hydrogen-bonding and non-hydrogen-bonding long chain compounds on the phase transition temperatures of phospholipids. Chem. Phys. Lipids. 40:23–34. [Google Scholar]
- 16.Hübner, W., and A. Blume. 1998. Interactions at the lipid-water interface. Chem. Phys. Lipids. 96:99–123. [Google Scholar]
- 17.Dyck, M., P. Krüger, and M. Lösche. 2005. Headgroup organization and hydration of methylated phosphatidylethanolamines in Langmuir monolayers. Phys. Chem. Chem. Phys. 7:150–156. [DOI] [PubMed] [Google Scholar]
- 18.Damodaran, K. V., and K. M. Merz. 1994. A comparison of DMPC- and DLPE-based lipid bilayers. Biophys. J. 66:1076–1087. [DOI] [PMC free article] [PubMed] [Google Scholar]
- 19.de Vries, A. H., A. E. Mark, and S. J. Marrink. 2004. The binary mixing behavior of phospholipids in a bilayer: a molecular dynamics study. J. Phys. Chem. B. 108:2454–2463. [Google Scholar]
- 20.Murzyn, K., T. Róg, and M. Pasenkiewicz-Gierula. 2005. Phosphatidylethanolamine-phosphatidylglycerol bilayer as a model of the inner bacterial membrane. Biophys. J. 88:1091–1103. [DOI] [PMC free article] [PubMed] [Google Scholar]
- 21.Pitman, M. C., A. Grossfield, F. Suits, and S. E. Feller. 2005. Role of cholesterol and polyunsaturated chains in lipid-protein interactions: molecular dynamics simulation of rhodopsin in a realistic membrane environment. J. Am. Chem. Soc. 127:4576–4577. [DOI] [PubMed] [Google Scholar]
- 22.Suits, F., M. C. Pitman, and S. E. Feller. 2005. Molecular dynamics investigation of the structural properties of phosphatidylethanolamine lipid bilayers. J. Chem. Phys. 122:244714. [DOI] [PubMed] [Google Scholar]
- 23.Pitman, M. C., F. Suits, K. Gawrisch, and S. E. Feller. 2005. Molecular dynamics investigation of dynamical properties of phosphatidylethanolamine lipid bilayers. J. Chem. Phys. 122:244715. [DOI] [PubMed] [Google Scholar]
- 24.Marrink, S. J., and A. E. Mark. 2004. Molecular view of hexagonal phase formation in phospholipid membranes. Biophys. J. 87:3894–3900. [DOI] [PMC free article] [PubMed] [Google Scholar]
- 25.Shi, Q., and G. A. Voth. 2005. Multi-scale modeling of phase separation in mixed lipid bilayers. Biophys. J. 89:2385–2394. [DOI] [PMC free article] [PubMed] [Google Scholar]
- 26.Brown, M. F. 1994. Modulation of rhodopsin function by properties of the membrane bilayer. Chem. Phys. Lipids. 73:159–180. [DOI] [PubMed] [Google Scholar]
- 27.Scarlata, S., and S. M. Gruner. 1997. Role of phosphatidylethanolamine lipids in the stabilization of protein-lipid contacts. Biophys. Chem. 67:269–279. [DOI] [PubMed] [Google Scholar]
- 28.Curran, A. R., R. H. Templer, and P. J. Booth. 1999. Modulation of folding and assembly of the membrane protein bacteriorhodopsin by intermolecular forces within the lipid bilayer. Biochemistry. 38:9328–9336. [DOI] [PubMed] [Google Scholar]
- 29.Haro, I., J. A. Pérez, F. Reig, C. Mestres, M. A. Egea, and M. A. Alsina. 1996. Solid-phase synthesis of the exposed capsid peptide VP2(96–107) of the Hepatitis A virus. Study of its physicochemical interactions with phospholipids. Langmuir. 12:5120–5125. [Google Scholar]
- 30.Mestres, C., A. Ortiz, I. Haro, F. Reig, and M. A. Alsina. 1997. Influence of phospholipidic charge on the interaction of a multiple antigenic peptide from Hepatitis A virus with monolayers and bilayers. Langmuir. 13:5669–5673. [Google Scholar]
- 31.Theodoropoulou, E., and D. Marsh. 2000. Effect of angiotensin II non-peptide AT1 antagonist losartan on phosphatidylethanolamine membranes. BBA Biomembr. 509:346–360. [DOI] [PubMed] [Google Scholar]
- 32.Smondyrev, A. M., and M. L. Berkowitz. 1999. Molecular dynamics simulation of DPPC bilayer in DMSO. Biophys. J. 76:2472–2478. [DOI] [PMC free article] [PubMed] [Google Scholar]
- 33.Feller, S. E., C. A. Brown, D. T. Nizza, and K. Gawrisch. 2002. Nuclear Overhauser enhancement spectroscopy cross-relaxation rates and ethanol distribution across membranes. Biophys. J. 82:1396–1404. [DOI] [PMC free article] [PubMed] [Google Scholar]
- 34.Sum, A. K., and J. J. de Pablo. 2003. Molecular simulation study on the influence of dimethylsulfoxide on the structure of phospholipid bilayers. Biophys. J. 85:3636–3645. [DOI] [PMC free article] [PubMed] [Google Scholar]
- 35.Sum, A. K., R. Faller, and J. J. de Pablo. 2003. Molecular simulation study of phospholipid bilayers and insights of the interactions with disaccharides. Biophys. J. 85:2830–2844. [DOI] [PMC free article] [PubMed] [Google Scholar]
- 36.Bemporad, D., J. W. Essex, and C. Luttmann. 2004. Permeation of small molecules through a lipid bilayer: a computer simulation study. J. Phys. Chem. B. 108:4875–4884. [Google Scholar]
- 37.Tieleman, D. P., and H. J. C. Berendsen. 1996. Molecular dynamics simulations of a fully hydrated dipalmitoylphosphatidylcholine bilayer with different macroscopic boundary conditions and parameters. J. Chem. Phys. 105:4871–4880. [Google Scholar]
- 38.Tieleman, D. P., S. J. Marrink, and H. J. C. Berendsen. 1997. A computer perspective of membranes: molecular dynamics studies of lipid bilayer systems. Biochim. Biophys. Acta Biomembr. 1331:235–270. [DOI] [PubMed] [Google Scholar]
- 39.Tieleman, D. P., and H. J. C. Berendsen. 1998. A molecular dynamics study of the pores formed by Escherichia coli OmpF porin in a fully hydrated palmitoyloleoylphosphatidylcholine bilayer. Biophys. J. 74:2786–2801. [DOI] [PMC free article] [PubMed] [Google Scholar]
- 40.Tieleman, D. P., L. R. Forrest, M. S. P. Sansom, and H. J. C. Berendsen. 1998. Lipid properties and the orientation of aromatic residues in OmpF, Influenza M2, and alamethicin systems: molecular dynamics simulations. Biochemistry. 37:17554–17561. [DOI] [PubMed] [Google Scholar]
- 41.Marrink, S. J., O. Berger, P. Tieleman, and F. Jähnig. 1998. Adhesion forces of lipids in a phospholipid membrane studied by molecular dynamics simulations. Biophys. J. 74:931–943. [DOI] [PMC free article] [PubMed] [Google Scholar]
- 42.Egberts, E., S. J. Marrink, and H. J. C. Berendsen. 1994. Molecular dynamics simulation of a phospholipid membrane. Eur. Biophys. J. 22:423–436. [DOI] [PubMed] [Google Scholar]
- 43.van Gunsteren, W. F., S. R. Billeter, A. A. Eising, P. H. Hünenberger, P. Krüger, A. E. Mark, W. R. P. Scott, and I. G. Tironi. 1996. Biomolecular simulation. In The GROMOS96 Manual and User Guide. Vdf Hochschuleverlag AG an der ETH Zürich, Zürich, Switzerland.
- 44.Ryckaert, J. P., and A. Bellemans. 1975. Molecular dynamics of liquid normal-butane near its boiling-point. Chem. Phys. Lett. 30:123–125. [Google Scholar]
- 45.Berger, O., O. Edholm, and F. Jähnig. 1997. Molecular dynamics simulations of a fluid bilayer of dipalmitoylphosphatidylcholine at full hydration, constant pressure, and constant temperature. Biophys. J. 72:2002–2013. [DOI] [PMC free article] [PubMed] [Google Scholar]
- 46.Jorgensen, W. L., and J. Tirado-Rives. 1988. The OPLS potential function for proteins. Energy minimizations for crystals of cyclic peptides and crambin. J. Am. Chem. Soc. 110:1657–1666. [DOI] [PubMed] [Google Scholar]
- 47.Essex, J. W., M. M. Hann, and W. G. Richards. 1994. Molecular dynamics simulation of a hydrated phospholipid bilayer. Philos. Trans. Roy. Soc. B. 344:239–260. [DOI] [PubMed] [Google Scholar]
- 48.Chiu, S. W., M. Clark, V. Balaji, S. Subramaniam, H. L. Scott, and E. Jakobsson. 1995. Incorporation of surface tension into molecular dynamics simulation of an interface: a fluid phase lipid bilayer membrane. Biophys. J. 69:1230–1245. [DOI] [PMC free article] [PubMed] [Google Scholar]
- 49.Berendsen, H. J. C., J. P. M. Postma, W. F. van Gunsteren, and J. Hermans. 1981. Intermolecular forces. In Proceedings of the Fourteenth Jerusalem Symposium on Quantum Chemistry and Biochemistry. B. Pullman, editor. Reidel, Dordrecht, The Netherlands. 331–342.
- 50.Berendsen, H. J. C., J. P. M. Postma, W. F. van Gunsteren, A. DiNola, and J. R. Haak. 1984. Molecular dynamics with coupling to an external heat bath. J. Chem. Phys. 81:3684–3690. [Google Scholar]
- 51.Hess, B., H. Bekker, H. J. C. Berendsen, and J. G. E. M. Fraaije. 1997. LINCS: a linear constraint solver for molecular simulations. J. Comput. Chem. 18:1463–1472. [Google Scholar]
- 52.Miyamoto, S., and P. A. Kollman. 1992. SETTLE—an analytical version of the SHAKE and RATTLE algorithm for rigid water models. J. Comput. Chem. 13:952–962. [Google Scholar]
- 53.Allen, M. P., and D. J. Tildesley. 1987. Computer Simulation of Liquids. Clarendon Press, Oxford, UK.
- 54.Patra, M., M. Karttunen, M. T. Hyvönen, E. Falck, P. Lindqvist, and I. Vattulainen. 2003. Molecular dynamics simulations of lipid bilayers: major artifacts due to truncating electrostatic interactions. Biophys. J. 84:3636–3645. [DOI] [PMC free article] [PubMed] [Google Scholar]
- 55.Norberg, J., and L. Nilsson. 2000. On the truncation of long-range electrostatic interactions in DNA. Biophys. J. 79:1537–1553. [DOI] [PMC free article] [PubMed] [Google Scholar]
- 56.Tobias, D. J. 2001. Electrostatics calculations: recent methodological advances and applications to membranes. Curr. Opin. Struct. Biol. 11:253–261. [DOI] [PubMed] [Google Scholar]
- 57.Faraldo-Gómez, J. D., G. R. Smith, and M. S. P. Sansom. 2002. Setting up and optimization of membrane protein simulations. Eur. Biophys. J. 31:217–227. [DOI] [PubMed] [Google Scholar]
- 58.Nina, M., and T. Simonson. 2002. Molecular dynamics of the tRNAAla acceptor stem: comparison between continuum reaction field and particle-mesh Ewald electrostatic treatments. J. Phys. Chem. B. 106:3696–3705. [Google Scholar]
- 59.Darden, T., D. York, and L. Pedersen. 1993. Particle mesh Ewald: an N·log(N) method for Ewald sums in large systems. J. Chem. Phys. 98:10089–10092. [Google Scholar]
- 60.Essman, U., L. Perera, M. L. Berkowitz, T. Darden, H. Lee, and L. G. Pedersen. 1995. A smooth particle mesh Ewald method. J. Chem. Phys. 103:8577–8593. [Google Scholar]
- 61.Berendsen, H. J. C., D. van der Spoel, and R. van Drunen. 1995. GROMACS: a message-passing parallel molecular dynamics implementation. Comput. Phys. Commun. 91:43–56. [Google Scholar]
- 62.Lindahl, E., B. Hess, and D. van der Spoel. 2001. GROMACS 3.0: a package for molecular simulation and trajectory analysis. J. Mol. Model. 7:306–317. [Google Scholar]
- 63.Virginia Tech. Terascale Computing Facility. http://www.tcf.vt.edu.
- 64.Janiak, M. J., D. M. Small, and G. G. Shipley. 1976. Nature of the thermal pretransition of synthetic phospholipids: dimyristolyl- and dipalmitoyllecithin. Biochemistry. 15:4575–4580. [DOI] [PubMed] [Google Scholar]
- 65.Pandit, S. A., and M. L. Berkowitz. 2002. Molecular dynamics simulation of dipalmitoylphosphatidylserine bilayer with Na+ counterions. Biophys. J. 82:1818–1827. [DOI] [PMC free article] [PubMed] [Google Scholar]
- 66.Anézo, C., A. H. de Vries, H. D. Höltje, D. P. Tieleman, and S. J. Marrink. 2003. Methodological issues in lipid bilayer simulations. J. Phys. Chem. B. 107:9424–9433. [Google Scholar]
- 67.Patra, M., M. Karttunen, M. T. Hyvönen, E. Falck, and I. Vattulainen. 2004. Lipid bilayers driven to a wrong lane in molecular dynamics simulations by subtle changes in long-range electrostatic interactions. J. Phys. Chem. B. 108:4485–4494. [Google Scholar]
- 68.Petrache, H. I., S. W. Dodd, and M. F. Brown. 2000. Area per lipid and acyl length distributions in fluid phosphatidylcholines determined by 2H NMR spectroscopy. Biophys. J. 79:3172–3192. [DOI] [PMC free article] [PubMed] [Google Scholar]
- 69.Schindler, H., and J. Seelig. 1975. Deuterium order parameters in relation to thermodynamic properties of a phospholipid bilayer. A statistical mechanical interpretation. Biochemistry. 14:2283–2287. [DOI] [PubMed] [Google Scholar]
- 70.Young, L. R. D., and K. A. Dill. 1988. Solute partitioning into lipid bilayer membranes. Biochemistry. 27:5281–5289. [DOI] [PubMed] [Google Scholar]
- 71.Petrache, H. I., K. Tu, and J. F. Nagle. 1999. Analysis of simulated NMR order parameters for lipid bilayer structure determination. Biophys. J. 76:2479–2487. [DOI] [PMC free article] [PubMed] [Google Scholar]
- 72.Seelig, A., and J. Seelig. 1974. The dynamic structure of fatty acyl chains in a phospholipid bilayer measured by deuterium magnetic resonance. Biochemistry. 13:4839–4845. [DOI] [PubMed] [Google Scholar]
- 73.Brady, J. W., and R. K. Schmidt. 1993. The role of hydrogen bonding in carbohydrates: molecular dynamics simulations of maltose in aqueous solution. J. Phys. Chem. 97:958–966. [Google Scholar]
- 74.Gurtovenko, A. A., M. Patra, M. Karttunen, and I. Vattulainen. 2004. Cationic DMPC/DMTAP lipid bilayers: molecular dynamics study. Biophys. J. 86:3461–3472. [DOI] [PMC free article] [PubMed] [Google Scholar]


