Abstract
Constraint-based modeling has proven to be a useful tool in the analysis of biochemical networks. To date, most studies in this field have focused on the use of linear constraints, resulting from mass balance and capacity constraints, which lead to the definition of convex solution spaces. One additional constraint arising out of thermodynamics is known as the “loop law” for reaction fluxes, which states that the net flux around a closed biochemical loop must be zero because no net thermodynamic driving force exists. The imposition of the loop-law can lead to nonconvex solution spaces making the analysis of the consequences of its imposition challenging. A four-step approach is developed here to apply the loop-law to study metabolic network properties: 1), determine linear equality constraints that are necessary (but not necessarily sufficient) for thermodynamic feasibility; 2), tighten Vmax and Vmin constraints to enclose the remaining nonconvex space; 3), uniformly sample the convex space that encloses the nonconvex space using standard Monte Carlo techniques; and 4), eliminate from the resulting set all solutions that violate the loop-law, leaving a subset of steady-state solutions. This subset of solutions represents a uniform random sample of the space that is defined by the additional imposition of the loop-law. This approach is used to evaluate the effect of imposing the loop-law on predicted candidate states of the genome-scale metabolic network of Helicobacter pylori.
INTRODUCTION
Constraint-based modeling has emerged as an important tool for assessing the properties of reconstructed genome-scale biochemical networks (1). Central to this modeling philosophy is the imposition of fundamental physico-chemical constraints on reconstructed networks to define a solution space that contains all the allowable functional states of networks that do not violate the constraints. To date, the constraint-based modeling approach has primarily used linear constraints to define convex solution spaces, which can be characterized by constraint-based optimization methods. Linear programming has been used for such purposes as predicting the lethality of knockouts (2), optimal growth rates (3), ranges of achievable fluxes (4), and even the endpoint of in vitro evolution (5). Bilevel optimization methods have been used to generate strain designs (6,7) and to calculate the minimum gene expression changes after gene knockout (8). Unbiased methods not requiring the statement of an objective function have also been used to characterize these solution spaces. For example, the edges of this space form a set of convex basis vectors that have led to the development of network-based pathways (9,10). The nonnegative combination of these edge vectors can be used to span the solution space. More recently, uniform random sampling of these convex solution spaces has been utilized to find a high-flux backbone in Escherichia coli metabolism (11), the effect of enzymopathies in human red blood cells (12), and the effects on mitochondrial metabolism of diabetes, ischemia, and diet (13).
Some physico-chemical constraints of importance in analyzing biochemical network functions, such as thermodynamic constraints, may be stated in the form of bilinear or nonlinear constraints that led to nonconvex spaces. This effort has been pioneered recently by the work of D. Beard, H. Qian, and colleagues (14–18). Systemic thermodynamic constraints are analogous to Kirchhoff's second law for electrical circuits (19). It simply states that the net flux around a closed biochemical loop must be zero because there is no net thermodynamic driving force (14). It is thus known as the “loop law” for reaction fluxes. Flux balance solutions violating the loop-law should be eliminated from the set of allowable network states. The present study will 1), develop methods to incorporate the loop-law in the procedure for uniformly sampling metabolic network states; and 2), demonstrate the effect of including these constraints on sampling candidate states of Helicobacter pylori's genome-scale metabolic network.
MATERIALS AND METHODS
H. pylori metabolic network and associated constraints
The metabolic network for H. pylori used herein was recently reconstructed (13). Briefly, H. pylori iIT341 GSM/GPR is a genome-scale metabolic model (GSM), where reactions are associated to the protein(s) that catalyze them, and to the associated gene(s). In total, iIT341 GSM/GPR accounts for 341 metabolic genes, 476 internal reactions, 411 internal metabolites, and 74 external metabolites. iIT341 GSM/GPR is connected with its in silico environment by 74 exchange reactions. The corresponding S-matrix has 485 metabolites and 558 reactions, including a biomass function, and demand functions for thiamin, menaquinone 6, biotin, and heme (protoheme).
Definition of loop-law thermodynamic constraints on fluxes
The loop-law thermodynamic constraint for reaction fluxes results from two basic laws of thermodynamics (14). The first of these is that the sum of chemical potentials around a loop must equal zero,
 |
(1) |
Secondly, that the flux of a reaction proceeds spontaneously in the direction in which the chemical potential change is negative,
 |
(2) |
These two equations can only be satisfied simultaneously if the net flux around a biochemical loop is equal to zero, resulting in the loop-law for reaction fluxes. Throughout this article, the term “loop law” will always refer to the constraint on the reaction fluxes.
Extreme pathway analysis to find all loops
Extreme pathway analysis was used to identify all of the biochemical loops in H. pylori (19). The identification of loops was accomplished by first eliminating all the exchange fluxes from the system boundary and then separating all of the reversible reactions into their two irreversible elementary reactions. Extreme pathway analysis was then performed on this matrix that represents the closed system. All the extreme pathways of type III were computed and they represent closed internal loops to the network (19). Once all the loops were identified, the reversible reactions were then made into net reactions again in the pathway matrix. The remaining nonzero columns in the extreme pathway matrix represented all of the nontrivial internal loops (more than two reactions) in the network.
Imposition of loop-law for reaction fluxes
The imposition of the loop-law for fluxes was performed in four steps. The first step was to determine the set of linear equality constraints that were necessary (but not necessarily sufficient) for thermodynamic feasibility. These linear constraints were then applied as a preprocessing step to sampling. Second, for the nonlinear constraints, linear constraints that most tightly form the convex enclosing space were formed. Third, this convex space was uniformly sampled. Fourth, the constraints that were irreducibly nonlinear were applied as a simple postprocessing step where solutions that violated the loop-law were discarded from the sampled set. This four-step approach will be discussed in detail for applying the loop-law to the genome-scale metabolic network of H. pylori, as well as to a series of illustrative example systems (see Supplementary Material).
Step 1: Apply linear constraints
A set of linear constraints that were necessary (but not sufficient) for thermodynamic feasibility was generated (18). These linear constraints were then applied as a preprocessing step to the sampling procedure. One common example of a necessary but not necessarily sufficient linear constraint is that certain reactions can be forced to be irreversible through application of the loop-law, if one of the directions can only be used as part of a loop. This reduction was determined in H. pylori by setting each reaction in a loop to zero, one at a time, and then using linear programming (LP) to find the maximum and minimum allowable flux on the remaining reactions. The highest maximum flux and lowest minimum flux in these sets were evaluated. If a reversible reaction becomes irreversible upon imposition of the loop-law (i.e., a negative Vmin becomes zero or a positive Vmax becomes zero), then the loop-law has reduced to a linear constraint in this case. Another case where the loop-law reduces to a linear case is when a reaction can only be used in a loop. This is found if a reaction begins as irreversible and it is found using the above described procedure that the negative Vmin becomes zero or the positive Vmax becomes zero. Or, for reversible reactions, if both of these reductions occur.
Step 2: Maximally tighten constraints on loop reactions
By forcing each reaction in the loop to zero, one at a time, and performing an LP maximization and minimization of all other reactions in the loop, it was possible to establish the minimum and maximum value of each reaction without the loop functioning. These calculated constraints were used as the new Vmax and Vmin values for reactions that participated in loops, and resulted in a convex space that tightly encompassed the nonconvex solution space. Subsequent to finding these values, each of these constraints was doubled and the sampling results were compared to those with the maximally tight constraints. The sets of kept points after application of the loop-law were found to be statistically identical, indicating that no portion of valid space was lost through the tightening of the Vmax and Vmin constraints on the loop reactions. This check was performed because there are general cases where simply zeroing out reactions one at a time will not be sufficient to identify a tightly fitting enclosing convex space. For the H. pylori network this was shown to be sufficient, but future implementations of this algorithm may need to use somewhat more sophisticated techniques.
Step 3: Uniformly sample convex space enclosing nonconvex solution space
The sampling of H. pylori's metabolic network states was performed with a Markov-chain Monte Carlo algorithm, as described in Thiele et al. (20).
Step 4: Eliminate sampled states that violate loop-law
Once a set of points is generated, each point can be evaluated for whether or not it violates the loop-law. This is done by checking the sign pattern of each reaction in the sampled point against the sign pattern of each loop. In other words, a check is performed to see if there is flux going around a closed loop. If any sample point contains a sign pattern corresponding to any of the biochemical loops (for mathematical details, see (16)), the sampled point is found to be infeasible and is excluded from the set (19). The remaining points satisfy the loop-law.
RESULTS
The four-step procedure to account for the loop-law was applied to the genome-scale metabolic network for H. pylori.
Biochemical loops in H. pylori
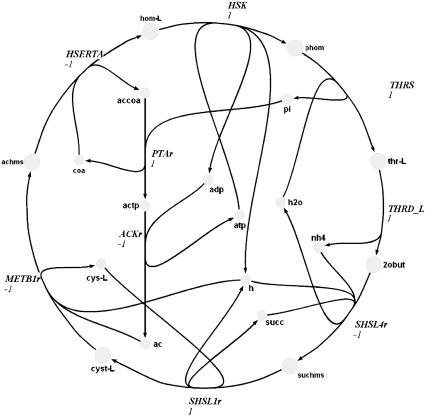
Extreme pathway analysis was used to find the biochemical loops in the genome-scale metabolic network of H. pylori (Figs. 1–3). A biochemical loop is defined as a set of reactions where material traversing around the loop returns the system back to the exact state at which it started. These loops are type III extreme pathways (19) and are thermodynamically infeasible (14). These loops differ from those commonly described for simple linear networks in that the reactions contain multiple reactants and products. Because of this fact, these loops can be complex and are generally very difficult to locate by merely visually inspecting metabolic maps.
FIGURE 1.
Complex biochemical loop 1 in H. pylori.
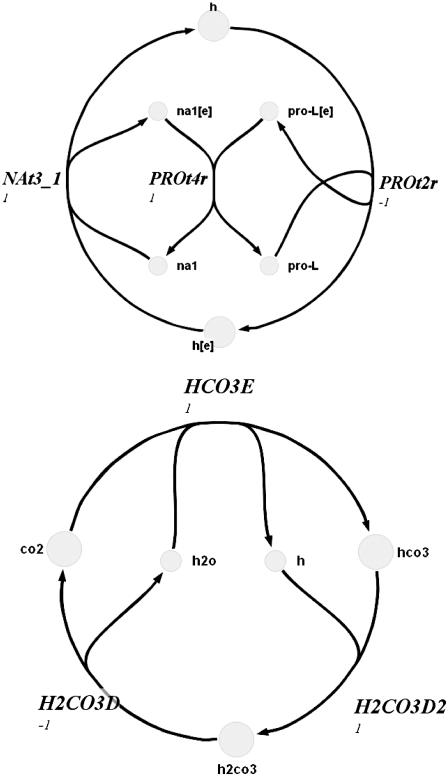
FIGURE 3.
Complex biochemical loops 3 and 4 in H. pylori.
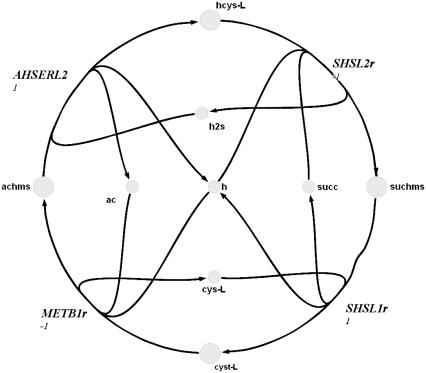
FIGURE 2.
Complex biochemical loop 2 in H. pylori.
Imposing the loop-law in H. pylori
We applied the loop-law to sample a nonconvex solution space associated with the genome-scale metabolic network of H. pylori. Using the defined irreversibility constraints for the reconstructed network (13), four nontrivial type III extreme pathways were computed. The loop-law manifested itself in three different ways when eliminating these four loops.
The first loop consisted of nine reactions (Fig. 1). Using LP, it was determined that seven of these reactions (HSERTA, HSK, THRS, THRD_L, SHSL4r, SHSL1r, and METB1r) could only operate in one direction based on either an irreversibility constraint on the reaction itself or because of a systemic irreversibility constraint resulting from the irreversibility of other coupled reactions in the network. These reactions are shown as the outer ring in Fig. 1. Comparison of the forced direction of activity of each reaction with the loop demonstrated that whether or not loop 1 would be active depended solely on the direction of the remaining two reactions. Through sampling, it was determined that the direction of these two remaining reactions (PTAr and ACKr) was perfectly negatively correlated. Thus, only two possibilities for their directions existed, one of which would always cause the loop-law to be violated. Thus, the loop-law in this case reduced to a simple linear constraint where the Vmin of ACKr became zero and the Vmax through PTAr became zero, since this was the only case where the loop would not be active. Thus, the imposition of the loop-law required that PTAr and ACKr be used in the opposite direction than required to complete biochemical loop 1 (Fig. 1).
The second loop in H. pylori metabolism contained four reactions (Fig. 2). Upon sampling the solution space, it was found that the thermodynamic constraint was always violated for this loop, suggesting a reduction in the dimension of the solution space. The loop-law was never satisfied in the samples because all of the reactions were under systemic constraints that forced them to be irreversible in the directions that formed the loop (though only one of them, AHSERL2, was defined as such). Thus, the loop-law could only be satisfied if one or more or these reactions had zero flux. To determine the possible flux range of each reaction in the loop with the loop-law satisfied, each of the reactions was set to zero, one at a time, and the minimum and maximum of all the other reactions in the loop was computed using linear programming (4). It was observed that if AHSERL2 was set to zero, all other fluxes could remain operative (i.e., they had nonzero flux solutions that did not require the loop to be active). If METB1r or SHSL1r were set to zero, then all reactions in the loop were also forced to zero. If SHSL2r was set to zero, then only AHSERL2 was forced to zero. Thus, AHSERL2 was shown to be inactive unless all of the reactions in the loop were active in a direction that violated the loop-law. Thus, the loop-law for the second loop reduced to the simple constraint that AHSERL2 must always be zero (vi = 0) under the simulated conditions since no valid flux distributions were able to use this reaction. Therefore, the loop-law could be applied as a preprocessing step simply by removing the reaction before further sampling. This resulted in the new convex enclosing space being in the same dimension as the nonconvex inner solution space.
The final two loops (Fig. 3) in H. pylori each consisted of three reversible reactions and could not be reduced to linear constraints as was shown to be the case for the first two loops. Thus, these constraints resulted in a nonconvex space and had to be addressed using steps 2–4. This nonconvexity was primarily addressed by eliminating sampled solutions that violated the loop-law for these two loops. The initial hit fraction was quite small, slowing down calculations considerably. However, by tightening the Vmax and Vmin constraints (Step 2) to the extent possible without eliminating valid flux distributions, it was possible to greatly shrink the size of the enclosing convex space. This reduction in the size of the enclosing convex space resulted in the fraction of sampled points that satisfied the loop-law being increased by more than two orders of magnitude. After tightening the constraints, 99.9% of the sampled points were found to satisfy the loop-law. Thus, it was shown that imposing the loop-law in H. pylori resulted in a solution space that was only slightly nonconvex. The increase in hit fraction from Step 2 led to calculation speeds that were almost identical with the convex case before application of the loop-law, but now all the resulting distributions satisfy the basic laws of thermodynamics encompassed in the loop-law for reaction fluxes.
Effects of the imposition of the loop-law on candidate metabolic states in H. pylori
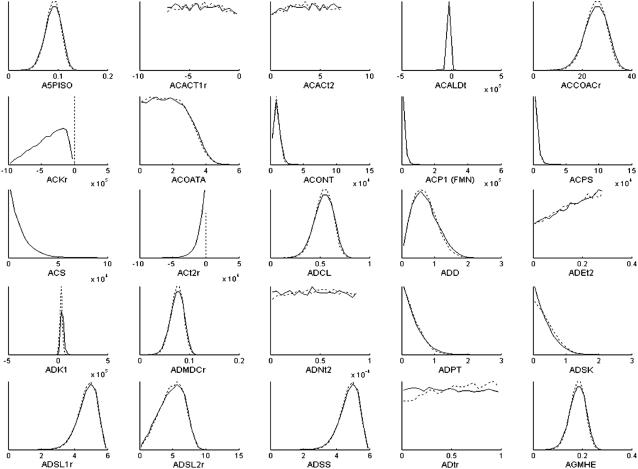
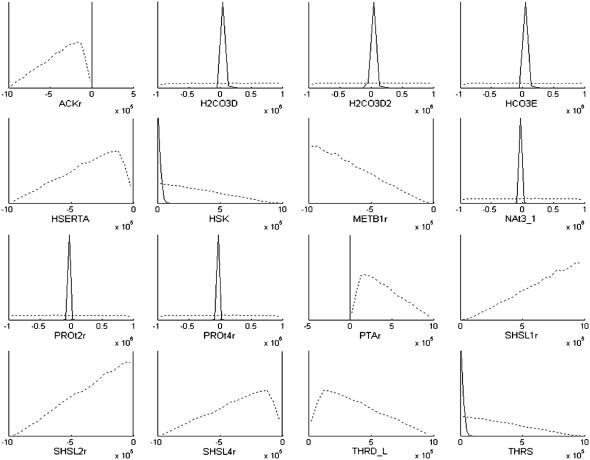
The effects of imposing the loop-law upon the sampling of candidate metabolic states in H. pylori are reflected in the distribution of flux levels in each of the reactions in the steady-state flux space. Histograms of the first 25 reactions (alphabetically) in H. pylori's metabolic network are shown as a representative sample to illustrate the scale of the networkwide effects (Fig. 4). Results for all reactions active under simulated conditions can be seen in the Supplementary Material. The distribution of allowable fluxes for the majority of reactions was relatively unchanged by the imposition of the loop-law. A relatively small portion of reactions that do not participate directly in loops were affected by the imposition of the loop-law.
FIGURE 4.
Comparison of histograms of flux values through reactions in steady-state flux space of H. pylori's metabolic network. Results for the first 25 internal reactions (alphabetically) are shown. ACKr is a reaction that participates directly in a loop, while all other reactions shown do not. The dotted lines shows the outline of the histogram with the original constraints, and the solid line shows the outline of the histogram once the loop-law has been applied. The x axis has been specifically formatted to end at zero for reactions that can only be used in one direction, and extend in both the positive and negative direction for reactions that can be used in both directions, since this can otherwise be difficult to see in some of the histograms. The histograms are generated from 20,000 sample points using 20 bins.
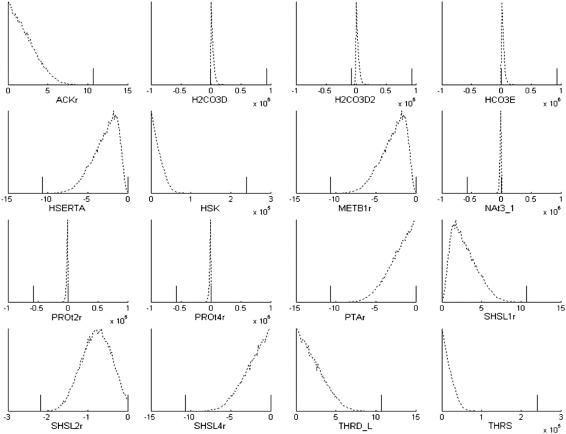
Imposing the loop-law constraints did greatly effect the distributions of the reactions that participated in loops (Fig. 5). Before imposing the loop-law all loop reactions could reach the arbitrarily set Vmax and Vmin constraints of 106 and −106, respectively. Thus, in the calculations, participation in loops artificially shielded the participating reactions from the constraints that should have been imposed on them by limiting Vmax and Vmin values for other reactions throughout the network. Because most of the loop reactions have a significantly reduced range of allowable values once the loop-law is applied, the histograms shown in Fig. 5 after imposition of the loop-law do not show the shapes of these distributions well. Therefore, we also show the histograms within tighter ranges in Fig. 6. The ranges found from LP are also shown to demonstrate the relationship between the sampled points and the reduced constraints used to tightly box-in the states that satisfy the loop-law. Of interest are the distributions for H2CO3D, H2CO3D2, HCO3E, NAt3_1, PROt2r, and PROt4r, which are all reversible within the network, but have the vast majority of their states in one particular direction once the loop-law was applied. This asymmetry is partially responsible for the observed near-convexity of the steady-state flux space of H. pylori under the simulated conditions.
FIGURE 5.
Comparison of histograms of flux values through loop reactions before and after imposition of loop-law. The dotted lines shows the outline of the histogram with the original constraints, and the solid line shows the outline of the histogram once the loop-law has been applied. The x axis has been specifically formatted to end at zero for reactions that can only be used in one direction, and extend in both the positive and negative direction for reactions that can be used in both directions, since this can otherwise be difficult to see in some of the histograms. The histograms are generated from 20,000 sample points using 20 bins.
FIGURE 6.
Closer view of histograms of flux values through loop reactions after imposition of the loop-law along with LP constraints after imposition of the loop-law. The dotted lines show the outline of the histogram after the loop-law has been applied. The short vertical solid lines indicate the maximum and minimum possible values of the enclosing convex space as determined by LP. The x axis has been specifically formatted to end at zero for reactions that can only be used in one direction, and extend in both the positive and negative directions for reactions that can be used in both directions, since this can otherwise be difficult to see in some of the histograms. The histograms are generated from 40,000 sample points using 100 bins.
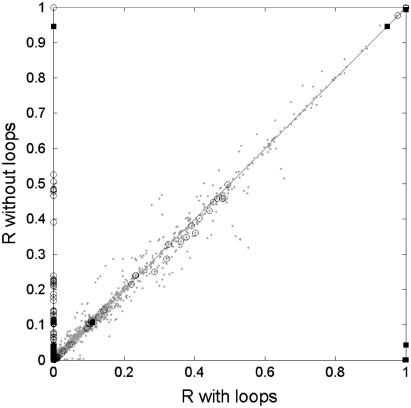
Uniform random sampling was used to find correlation coefficients between all fluxes in a reaction network (12). We compared all pairwise correlation coefficients between reactions from a set of samples under the original conditions and compared them to those after imposing the loop-law (Fig. 7). The results were that the correlations between most of the reactions that do not participate in loops do not change very much. Large changes in the correlation coefficient did occur in pairs where only one of the reactions participated in a loop. These pairs were generally uncorrelated initially because the high flux value the loop could artificially obscure the natural correlation between the reactions under thermodynamically feasible conditions and show up on the y axis in Fig. 7. The most extreme changes in correlation were seen among a few pairs involving two loop reactions. In these cases, a reaction pair was found to have almost perfect correlation before imposing the loop-law and nearly zero correlation afterwards, and for other sets, vice versa (Table 1).
FIGURE 7.
Changes in correlation coefficients due to implementing the loop-law. Points are plotted based on a reaction pair's correlation under normal conditions (x axis) and with the loops eliminated through imposition of the loop-law (y axis). Reaction pairs where both reactions participate in loops are marked with a square, pairs with only one reaction involved in a loop are marked with a circle, and those pairs where neither reaction participates in a loop are marked with an asterisk.
TABLE 1.
Correlation coefficients for selected reaction pairs in Fig. 8
| First reaction | Second reaction | Correlation with loops | Correlation with loop-law imposed |
|---|---|---|---|
| Two loop reactions in pair | |||
| H2CO3D2 | H2CO3D | 0.998 | 0.001 |
| HCO3E | H2CO3D | 0.998 | 0.001 |
| METB1r | HSERTA | <0.001 | 1.000 |
| SHSL1r | HSERTA | <0.001 | 1.000 |
| SHSL2r | METB1r | 1.000 | 0.043 |
| SHSL4r | METB1r | <0.001 | 0.946 |
| THRD_L | METB1r | <0.001 | 0.946 |
| PROt2r | NAt3_1 | 0.999 | 0.001 |
| PROt4r | PROt2r | 0.999 | 0.001 |
| SHSL2r | SHSL1r | 1.000 | 0.043 |
| SHSL4r | SHSL1r | <0.001 | 0.946 |
| THRD_L | SHSL1r | <0.001 | 0.946 |
| One loop reaction in pair | |||
| SHSL2r | AHCYSNS | <0.001 | 1 |
| SHSL2r | DHPTDC | <0.001 | 1 |
| PROt2r | PROabc | <0.001 | 0.506 |
| SHSL2r | RHCCE | <0.001 | 1 |
| DM_hmfurn(c) | SHSL2r | <0.001 | 1 |
| sink_ahcys(c) | SHSL2r | <0.001 | 0.526 |
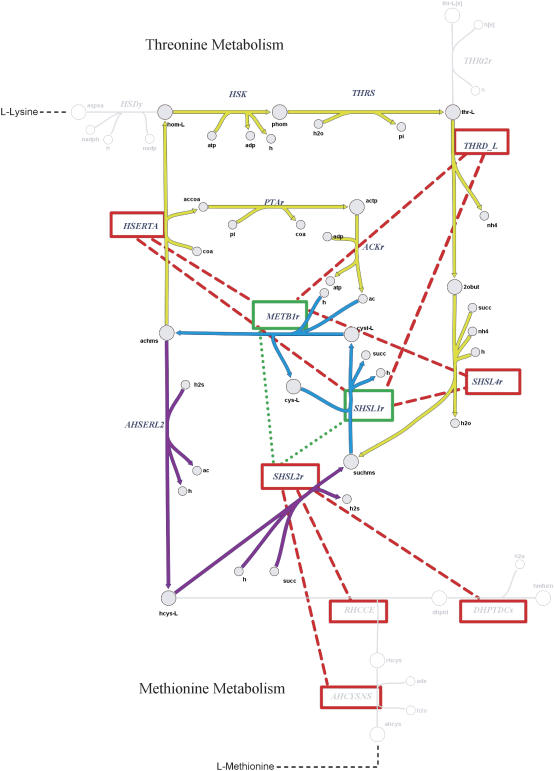
Many of the reactions that participate in the two most complex loops in H. pylori (loops 1 and 2) participate in methionine and threonine biosynthesis. A comparison between the calculated correlation coefficients before and after the imposition of the loop-law is shown on a metabolic map (Fig. 8). In Fig. 8, eight reaction pairs are shown where the high correlation between the reactions was revealed through the imposition of the loop-law. All of these pairs occur between reactions where one of the reactions appears in a loop in which the other reaction does not. Their high degree of correlation was thus previously obscured by the high activity of the thermodynamically infeasible biochemical loops. Two reaction pairs have their calculated correlation coefficient reduced by the imposition of the loop-law. This occurs because these reactions all occur in biochemical loop 2. Since this loop was highly active, it falsely showed these reactions to be highly correlated, when in the context of network constraints, they are in fact not.
FIGURE 8.
Portion of metabolic map of H. pylori for L-methionine and L-threonine metabolism. Red dashed lines indicate reaction pairs whose correlation increased significantly (>0.5) when the loop-law was applied. The green dotted lines represent decrease in correlation when the loop-law was imposed as biochemical constraint. Note that the flux through AHSERL2 was forced to be zero as a preprocessing step of implementing the loop-law. Reactions HSERTA, THRD_L, SHSL4r, SHSL1r, METB1r, THRS, and HSK participate in biochemical loop 1, and METB1r, SHSL1r, SHSL2r, and AHSERL2 participate in biochemical loop 2. The number of points on the graph is 123,753—corresponding to the number of unique reaction pairs between active fluxes in the H. pylori metabolic network.
DISCUSSION
A four-step approach was developed to study potentially nonconvex spaces resulting from the implementation of the loop-law for reaction fluxes. Application of the loop-law to sampling metabolic states in H. pylori led to the following results: 1), the loop-law constraint is commonly violated in sampling genome-scale metabolic networks if closed loops are present in the reconstruction; 2), it is feasible to incorporate the loop-law into genome-scale metabolic networks; and 3), the effects of applying the loop-law have a significant impact on calculations for reactions participating in loops, but have only a limited effect on the majority of other reactions in the network.
The four-step approach outlined herein was used to uniformly sample H. pylori metabolic network states that did not violate the loop-law. Initial attempts to implement the loop-law completely as a postprocessing step of eliminating samples that violated this thermodynamic constraint led to a hit-fraction of zero. That is, all points taken using the unaltered Markov-chain Monte Carlo sampler violated the loop-law. However, since the loop-law constraints for the first two loops in H. pylori could be reduced to linear constraints and used as a preprocessing step, it was possible to find a nonzero percentage of sampled points that satisfied the loop-law. However, this percentage was still very small, enabling only the sampling of ∼10 points satisfying the loop-law for an overnight calculation on a high-performance PC. Once the minimum and maximum flux through the reactions participating in the final two loops was ascertained, these were then used to bracket the space before sampling. This best linear approximation was shown to tightly bind the solution space, leaving only the irreducibly nonlinear portions of the constraints that need to be implemented as a postprocessing step. This step increased the hit-fraction of points to ∼99.9%. Thus, while implementing the loop-law in H. pylori did result in a nonconvex steady-state flux space, it could be very closely approximated with all linear constraints making its sampling an algorithmically straightforward problem. The remaining portion of the loop-law was then simply a matter of excluding the roughly one point in a thousand that violated the loop-law after all preprocessing linear constraints were applied to the H. pylori metabolic network.
The effect of implementing the loop-law in H. pylori was reflected in histograms of individual fluxes in the steady-state flux space and the pairwise correlation coefficients between all of the reactions. It was observed that the implementation of the loop-law significantly altered the histograms for all reactions participating in loops. Before implementing the loop-law, the loop reactions were able to reach their arbitrarily set Vmin and Vmax values because the loops were not bound by the systemic constraints of interacting with other reactions in the network. With the loops eliminated, the histograms of these loop reactions reflected their true minimum and maximum possible values within the confines of the system constraints on the network as a whole. The implementation of the loop-law also affected reactions outside of those that directly participated in loops, changing the histograms for some of these reactions, as well as correlation coefficients between various pairs of reactions. The most pronounced effects on the correlation coefficient calculations were for 1), the correlations between a loop reaction and a nonloop reaction, where the relationship between these reactions had been obscured by the high fluxes through the loops; and 2), the reversal of correlated versus noncorrelated predictions for selected reaction pairs where both reactions participated in a loop. However, these effects were fairly localized with the majority of histograms for individual fluxes remaining unchanged. Thus, studying samples from H. pylori's candidate metabolic network states without implementing the loop-law would have resulted in reasonable calculations for most of the network aside from the reactions that directly participated in the loops.
Previous sampling studies applied to the steady-state flux space have not explicitly taken the loop-law into account. These studies focused on the human red blood cell (12), the human mitochondria (20), and E. coli (11). The red blood cell contains no nontrivial loops and so the loop-law was automatically satisfied. The mitochondria contains one biochemical loop, and thus histogram predictions therein would change for reactions involved in the loop as well as slightly for other parts of the network, as was noted in Thiele et al. (20). The most updated reconstruction of E. coli's metabolic network contains ∼10 biochemical loops (depends somewhat on simulated media conditions) and thus will have some degree of differences in predictions when the loop-law is applied.
The results of this study were based on accepting the irreversibility constraints of the most recent reconstruction of the H. pylori metabolic network as true and applying the loop-law as an additional constraint. However, it would also be of significant interest to evaluate the effects of the loop-law thermodynamic constraints in the absence of any a priori irreversibility constraints on reaction fluxes. As irreversibility constraints are removed the number of loops in a network can increase significantly. The main impediment to such work currently is the efficient calculation of all possible loops (type III extreme pathways) in such a scenario. Addressing this challenge and evaluating the consequences of the continuing explicit incorporation of thermodynamic constraints to replace the ad hoc irreversibility constraints commonly used in modeling metabolic networks presents a significant opportunity for research going forward.
Taken together, the results show that we can apply the thermodynamic constraints embedded in the loop-law for reaction fluxes on a genome-scale, even if its imposition results in a nonconvex solution space. The constraints primarily affect the candidate values of the reactions that participate in the loops. The methods developed and applied here can now be applied to study the properties of the numerous genome-scale networks that have been reconstructed and are available for in silico analysis.
SUPPLEMENTARY MATERIAL
An online supplement to this article can be found by visiting BJ Online at http://www.biophysj.org.
Acknowledgments
Many thanks to Timothy Allen for help with formatting and editing the manuscript and figures.
The authors acknowledge funding from the National Institutes of Health (grant No. NIH/R01 GM68837). B.Ø.P. serves on the Scientific Advisory Board of Genomatica, Inc.
Nathan D. Price's present address is Institute for Systems Biology, 1441 N. 34th St., Seattle, WA 98103-8904.
References
- 1.Price, N., J. Reed, and B. Palsson. 2004. Genome-scale models of microbial cells: evaluating the consequences of constraints. Nat. Rev. Microbiol. 2:886–897. [DOI] [PubMed] [Google Scholar]
- 2.Forster, J., I. Famili, B. Palsson, and J. Nielsen. 2003. Large-scale evaluation of in silico gene deletions in Saccharomyces cerevisiae. OMICS. 7:193–202. [DOI] [PubMed] [Google Scholar]
- 3.Edwards, J., R. Ibarra, and B. Palsson. 2001. In silico predictions of Escherichia coli metabolic capabilities are consistent with experimental data. Nat. Biotechnol. 19:125–130. [DOI] [PubMed] [Google Scholar]
- 4.Mahadevan, R., and C. H. Schilling. 2003. The effects of alternate optimal solutions in constraint-based genome-scale metabolic models. Metab. Eng. 5:264–276. [DOI] [PubMed] [Google Scholar]
- 5.Ibarra, R., J. Edwards, and B. Palsson. 2002. Escherichia coli K-12 undergoes adaptive evolution to achieve in silico predicted optimal growth. Nature. 420:186–189. [DOI] [PubMed] [Google Scholar]
- 6.Burgard, A., P. Pharkya, and C. Maranas. 2003. OPTKNOCK: a bilevel programming framework for identifying gene knockout strategies for microbial strain optimization. Biotechnol. Bioeng. 84:647–657. [DOI] [PubMed] [Google Scholar]
- 7.Fong, S., A. Burgard, C. Herring, E. Knight, F. Blattner, C. Maranas, and B. Palsson. 2005. In silico design and adaptive evolution of Escherichia coli for production of lactic acid. Biotechnol. Bioeng. 91:643–648. [DOI] [PubMed] [Google Scholar]
- 8.Shlomi, T., O. Berkman, and E. Ruppin. 2005. Regulatory on/off minimization of metabolic flux changes after genetic perturbations. Proc. Natl. Acad. Sci. USA. 102:7695–7700. [DOI] [PMC free article] [PubMed] [Google Scholar]
- 9.Schilling, C., S. Schuster, B. Palsson, and R. Heinrich. 1999. Metabolic pathway analysis: basic concepts and scientific applications in the postgenomic era. Biotechnol. Prog. 15:296–303. [DOI] [PubMed] [Google Scholar]
- 10.Papin, J. A., J. Stelling, N. D. Price, S. Klamt, S. Schuster, and B. O. Palsson. 2004. Comparison of network-based pathway analysis methods. Trends Biotechnol. 22:400–405. [DOI] [PubMed] [Google Scholar]
- 11.Almaas, E., B. Kovacs, T. Vicsek, Z. N. Oltvai, and A. L. Barabasi. 2004. Global organization of metabolic fluxes in the bacterium Escherichia coli. Nature. 427:839–843. [DOI] [PubMed] [Google Scholar]
- 12.Price, N., J. Schellenberger, and B. Palsson. 2004. Uniform sampling of steady state flux spaces: means to design experiments and to interpret enzymopathies. Biophys. J. 87:2172–2186. [DOI] [PMC free article] [PubMed] [Google Scholar]
- 13.Thiele, I., T. Vo, N. Price, and B. Palsson. 2005. Genome-scale metabolic model of helicobacter pylori, iIT341: an in silico genome-scale characterization of single and double deletion mutants. J. Bacteriol. Accepted. [DOI] [PMC free article] [PubMed]
- 14.Beard, D. A., S. D. Liang, and H. Qian. 2002. Energy balance for analysis of complex metabolic networks. Biophys. J. 83:79–86. [DOI] [PMC free article] [PubMed] [Google Scholar]
- 15.Qian, H., D. A. Beard, and S. D. Liang. 2003. Stoichiometric network theory for nonequilibrium biochemical systems. Eur. J. Biochem. 270:415–421. [DOI] [PubMed] [Google Scholar]
- 16.Beard, D. A., E. Babson, E. Curtis, and H. Qian. 2004. Thermodynamic constraints for biochemical networks. J. Theor. Biol. 228:327–333. [DOI] [PubMed] [Google Scholar]
- 17.Beard, D., and H. Qian. 2005. Thermodynamic-based computational profiling of cellular regulatory control in hepatocyte metabolism. Am. J. Physiol. 288:E633–E644. [DOI] [PubMed] [Google Scholar]
- 18.Yang, F., H. Qian, and D. A. Beard. 2005. Ab initio prediction of thermodynamically feasible reaction directions from biochemical network stoichiometry. Metab. Eng. 7:251–259. [DOI] [PubMed] [Google Scholar]
- 19.Price, N. D., I. F. Famili, D. A. Beard, and B. O. Palsson. 2002. Extreme pathways and Kirchhoff's second law. Biophys. J. 83:2879–2882. [DOI] [PMC free article] [PubMed] [Google Scholar]
- 20.Thiele, I., N. Price, T. Vo, and B. Palsson. 2005. Candidate metabolic network states in human mitochondria: impact of diabetes, ischemia, and diet. J. Biol. Chem. 280:11683–11695. [DOI] [PubMed] [Google Scholar]


