

Abstract
A recently developed murine haplotype-based computational method was used to identify genetic factors regulating the metabolism of warfarin, a commonly prescribed anticoagulant with a narrow therapeutic index and a large variation in individual dosing. The amount of warfarin and 9 identified metabolites in plasma was quantitated after dosing 13 inbred mouse strains. Strain-specific differences in drug metabolism through generation of 7-hydroxywarfarin metabolites were computationally correlated with genetic variation within a chromosomal region encoding cytochrome P450 2C enzymes. This computational prediction was experimentally confirmed by showing that the rate limiting step in biotransformation of warfarin to its 7-hydroxylated metabolite was inhibited by a Cyp2c isoform specific substrate (tolbutamide) and was mediated by expressed recombinant Cyp2c29. Genetic variants responsible for inter-individual pharmacokinetic differences for clinically important drugs can be identified by computational genetic analysis in mice.
Abbreviations: HPLC: high pressure liquid chromatography, LC: liquid chromatography, MS: mass spectrometry, Cyp2c29: cytochrome P450 2c29, PK: pharmacokinetics, IS: internal standard, NMR: nuclear magnetic resonance, IP: intraperitoneal, QC: quality control, MRM: multiple reaction monitoring, AUC 0-8: area under concentration-time curve within the first 8 h, SNPs: single nucleotide polymorphisms
INTRODUCTION
It is widely anticipated that pharmacogenomic information will have a large impact on drug development, and subsequently on clinical practice. Using pharmacogenomic information can increase efficacy, reduce side effects, and improve treatment outcome for patients 1. However, a major barrier to increased use of pharmacogenomics in clinical practice is our limited knowledge about the genetic variables that regulate the mechanism of action or disposition of most commonly prescribed medications. It is essential that efficient strategies are developed and utilized to identify genetic factors affecting the metabolism or response to current and future therapies.
Because of this need, we wanted to determine if a recently described murine haplotype-based computational genetic analysis method 2–5 in mice could be utilized to quickly identify factors affecting the metabolism of commonly prescribed medications. This method computationally predicts causal genetic factors by identifying genomic regions where the pattern of genetic variation correlates with the distribution of trait values among the inbred strains analyzed 2–4. Clearly, pharmacogenomic information can have its largest impact on clinical decision making when applied to commonly prescribed drugs that have a large variation in dose or a narrow therapeutic index in the treated population 6. Therefore, we chose warfarin metabolism in mice as an initial model system for assessing the utility of this computational pharmacogenetic approach. Warfarin is a commonly prescribed anticoagulant that has a very narrow therapeutic index, and is a leading cause of iatrogenic complications. It inhibits a γ-carboxylation reaction required for the synthesis of several blood clotting factors 7–9. The dose can vary by as much as 120-fold among individuals in the treated population 10,11. Warfarin is a racemic mixture of R- and S-enantiomers. The R-warfarin enantiomer has a more complex pattern of metabolism than S-warfarin 12. Warfarin is differentially metabolized by a variety of cytochrome P450 enzymes into different hydroxylated metabolites 12, which then undergo phase II enzyme biotransformation to glucuronidated or sulfated metabolites prior to excretion 13. Genetic variation within CYP2C9 and VKOR1 affect the rate of warfarin metabolism or alter the required dose, respectively, in treated patients 14,15.
The complexity of the drug metabolism process could preclude the use of a computational genetic method that is dependent upon a single genetic change having a large impact on the phenotypic trait. Simulations have shown that an individual genetic factor must be responsible for at least 40% of the phenotypic variation for it to be identified by this computational method when 13–15 inbred strains are analyzed 2,3. In contrast, warfarin metabolism is a very complex process. Its biotransformation to over 9 different metabolites in rats and humans is mediated by many different enzymes 12,16. Each individual genetic difference could be responsible for only a small portion of the inter-strain differences in warfarin pharmacokinetics. Therefore, we developed an experimental strategy that reduced the complexity of this metabolic process. To do this, the rate of clearance of R-warfarin and each of 9 different metabolites produced after administration of 14C-labeled R-warfarin to 13 inbred strains was characterized in detail. Computational analysis of this data enabled the identification and experimental characterization of a genetic difference that regulated a rate limiting step in R-warfarin metabolism. This demonstrates that a complex process involving multiple different pathways affecting the disposition of a drug can be experimentally dissected in a model experimental organism, which enables haplotype-based computational genetic analysis to rapidly identify genetic factors.
RESULTS
Analysis of R-warfarin metabolites in inbred mouse strains
Following the administration of a 10 mg/kg 14C-labeled R-warfarin, the total amount of radio-labeled drug in plasma peaked at 1 hour, and then declined with time in each strain (Figure 1). The peak plasma concentration varied by 3-fold among the inbred strains, indicating that the inbred strains metabolized R-warfarin at different rates. Because of the complexity of this process, genetic factors responsible for inter-strain differences in the overall rate of R-warfarin clearance shown in Figure 1 could not be identified by haplotype-based computational genetic analysis. To identify a causative genetic factor, the complexity of this metabolic process had to be reduced, so that individual steps in R-warfarin metabolism could be analyzed. Therefore, the concentration of R-warfarin and 9 identified metabolites in plasma samples obtained from each inbred strain was quantitatively determined using HPLC-radioflow analysis. These included the 4′-, 6-, 7-, 8-, and 10-hydroxylated metabolites of warfarin (4′-, 6-, 7-, 8- and 10-OH), and four with unknown identities that were labeled as M6 through M9 (see representative chromatograms in Figure 2). The inbred strains had very distinct profiles of warfarin and the 9 metabolites in their plasma. This strain-specific pattern of metabolite production was reproducibly observed in 3 independently performed experiments (Supplemental Tables IIIa, IIIb and IV), confirming that R-warfarin was differentially metabolized in a strain-specific manner.
Figure 1.
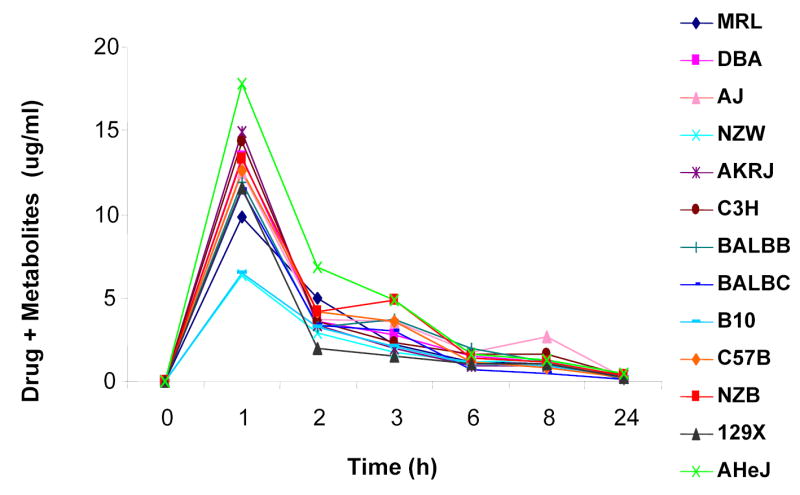
R-warfarin metabolism in males of 13 inbred mouse strains. The mean concentration of parent drug and all metabolites in pooled plasma samples, as determined by liquid scintillation counting, is plotted as a function of time after administration of one intraperitoneal (IP) dose of 10 mg/kg of 14C-R-warfarin to each of 13 inbred mouse strains. Each data point represents the average of two independent measurements performed on a pooled plasma sample prepared three independently treated mice. The similar profile was observed in plasma samples obtained from a second set males of 13 inbred mouse strains that were independently administered the same dose of drug (data not shown).
Figure 2.
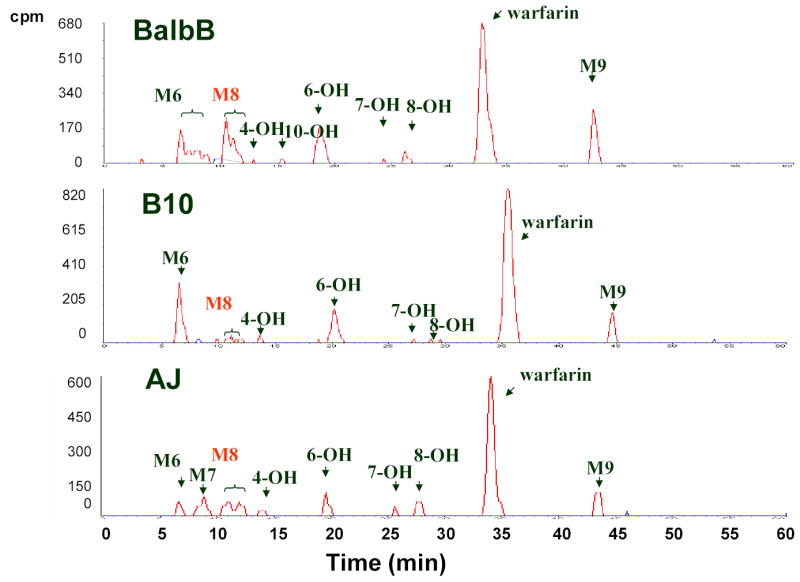
Analysis of R-warfarin metabolites. Pooled plasma samples obtained 1, 2, 3, 6, and 8 h after a single IP dose of 10 mg/kg 14C-R-warfarin to males of 13 inbred mouse strains were analyzed by reversed-phase HPLC-radiometric methods. Each distinct peak on the chromatograms represents one of 9 different metabolites identified. The plasma metabolites identified in the Balb/cbyJ, B10.D2J and A/J strains are shown.
Supplemental Table III.
R-warfarin metabolic profiles determined by radiometric methods in pooled plasma samples (1–8 h postdose) after an IP dose 10 mg/kg of 14C-R-warfarin to males of 13 inbred mouse strains. The amount of radioactivity in each metabolite was analyzed to determine its concentration, and expressed as the concentration equivalent of R-warfarin. The data obtained in two independently performed studies, with n=3 samples per data point, is shown. M6 through M9 are unknown metabolites, and “Total” represents the amount of remaining drug and all metabolites.
|
a | |||||||||||
|---|---|---|---|---|---|---|---|---|---|---|---|
| Concentration (μg-eq/mL) | |||||||||||
| Mouse Strain | Warfarin | 4′-OH Warfarin | 10-OH Warfarin | 6-OH Warfarin | 7-OH Warfarin | 8-OH Warfarin | M6 | M7 | M8 | M9 | Total |
| MRL | 1.3949 | 0.0194 | 0.0000 | 0.1114 | 0.0000 | 0.0000 | 0.0872 | 0.1066 | 0.2180 | 0.1066 | 2.0440 |
| DBA | 1.0946 | 0.0000 | 0.0097 | 0.1841 | 0.0000 | 0.0000 | 0.0000 | 0.0145 | 0.3051 | 0.1017 | 1.7098 |
| AJ | 1.1043 | 0.0291 | 0.0000 | 0.1114 | 0.0242 | 0.1017 | 0.0727 | 0.1502 | 0.2034 | 0.1695 | 1.9665 |
| NZW | 0.8428 | 0.0775 | 0.0000 | 0.1679 | 0.0000 | 0.0323 | 0.3778 | 0.0065 | 0.1550 | 0.0807 | 1.7405 |
| AKRJ | 0.8525 | 0.0000 | 0.0000 | 0.2276 | 0.0145 | 0.0000 | 0.0484 | 0.0436 | 0.2567 | 0.0678 | 1.5112 |
| C3H | 2.2135 | 0.0387 | 0.0000 | 0.2664 | 0.0000 | 0.0097 | 0.1114 | 0.0533 | 0.2325 | 0.1308 | 3.0563 |
| BALBB | 1.3949 | 0.0048 | 0.0000 | 0.3148 | 0.0097 | 0.0581 | 0.4020 | 0.0000 | 0.4214 | 0.3439 | 2.9497 |
| BALBC | 1.5402 | 0.0000 | 0.0000 | 0.1162 | 0.0194 | 0.0242 | 0.1889 | 0.0823 | 0.1986 | 0.3390 | 2.5090 |
| B10 | 1.1980 | 0.0161 | 0.0000 | 0.1970 | 0.0065 | 0.0000 | 0.2131 | 0.0000 | 0.0517 | 0.1195 | 1.8018 |
| C57B | 2.1360 | 0.0387 | 0.0000 | 0.1259 | 0.0145 | 0.0000 | 0.0630 | 0.0242 | 0.0920 | 0.1502 | 2.6446 |
| NZB | 1.3562 | 0.0000 | 0.0000 | 0.1647 | 0.0145 | 0.0000 | 0.1308 | 0.1695 | 0.3778 | 0.2906 | 2.5041 |
| 129x | 1.4272 | 0.0355 | 0.0000 | 0.2260 | 0.0420 | 0.0000 | 0.7847 | 0.0743 | 0.2357 | 0.1388 | 2.9643 |
| AHeJ | 3.2064 | 0.0823 | 0.0000 | 0.3923 | 0.0920 | 0.0727 | 0.3487 | 0.0000 | 0.3681 | 0.1695 | 4.7322 |
| b | |||||||||||
| MRL | 0.6140 | 0.0146 | 0.0000 | 0.0869 | 0.0135 | 0.0000 | 0.0278 | 0.0112 | 0.0281 | 0.0886 | 0.8848 |
| DBA | 0.9477 | 0.0295 | 0.0000 | 0.1214 | 0.0335 | 0.0000 | 0.0000 | 0.0260 | 0.1170 | 0.0621 | 1.3372 |
| AJ | 1.2274 | 0.0508 | 0.0000 | 0.2583 | 0.0636 | 0.0149 | 0.0000 | 0.0523 | 0.1146 | 0.1363 | 1.9182 |
| NZW | 0.7885 | 0.0297 | 0.0000 | 0.1032 | 0.0227 | 0.0041 | 0.0147 | 0.0330 | 0.0520 | 0.0630 | 1.1107 |
| AKRJ | 0.3613 | 0.0356 | 0.0000 | 0.1140 | 0.0041 | 0.0074 | 0.0041 | 0.0000 | 0.0855 | 0.0702 | 0.6820 |
| C3H | 0.7332 | 0.0560 | 0.0000 | 0.1104 | 0.0262 | 0.0081 | 0.0122 | 0.0053 | 0.0499 | 0.0599 | 1.0612 |
| BALBB | 0.3871 | 0.0225 | 0.0000 | 0.0742 | 0.0151 | 0.0041 | 0.0081 | 0.0206 | 0.0636 | 0.1212 | 0.7165 |
| BALBC | 0.4109 | 0.0354 | 0.0042 | 0.0774 | 0.0151 | 0.0042 | 0.0148 | 0.0148 | 0.0707 | 0.1754 | 0.8230 |
| B10 | 1.0354 | 0.0072 | 0.0041 | 0.0333 | 0.0041 | 0.0000 | 0.0041 | 0.0153 | 0.0302 | 0.0923 | 1.2259 |
| C57B | 0.9219 | 0.0337 | 0.0112 | 0.0590 | 0.0081 | 0.0041 | 0.0000 | 0.0223 | 0.0258 | 0.1109 | 1.1970 |
| NZB | 0.8364 | 0.0000 | 0.0000 | 0.1221 | 0.0184 | 0.0000 | 0.0133 | 0.0385 | 0.1483 | 0.1258 | 1.3029 |
| 129x | 0.9328 | 0.0297 | 0.0151 | 0.1400 | 0.0000 | 0.0000 | 0.0186 | 0.0376 | 0.0444 | 0.0816 | 1.2998 |
| AHeJ | 0.6561 | 0.0190 | 0.0000 | 0.0812 | 0.0147 | 0.0081 | 0.0112 | 0.0143 | 0.0256 | 0.0929 | 0.9231 |
Supplemental Table IV.
The calculated AUC 0–8 h for R-warfarin and its metabolites following a single IP dose of 10 mg/kg of 14C-R-warfarin to males of 13 inbred mouse strains. In this independently performed drug dosing experiment, the concentration of each drug and metabolite was determined by LC/MS/MS methods.
| Warfarin | 10-OH Warfarin | 4-OH Warfarin | 6-OH Warfarin | 7-OH Warfarin | 8-OH Warfarin | M8 | ||||||||
|---|---|---|---|---|---|---|---|---|---|---|---|---|---|---|
| AUC(0-8) | SD | AUC(0-8) | SD | AUC(0-8) | SD | AUC(0-8) | SD | AUC(0-8) | SD | AUC(0-8) | SD | AUC(0-8) | SD | |
| MRL | 4899.73 | 337.10 | 74.52 | 2.99 | 560.33 | 55.40 | 2018.97 | 131.06 | 747.50 | 103.14 | 367.77 | 52.00 | 2126.67 | 280.44 |
| DBA | 5012.63 | 341.99 | 76.46 | 4.96 | 192.36 | 15.43 | 2647.53 | 195.58 | 1314.55 | 101.67 | 232.52 | 48.35 | 3147.30 | 189.42 |
| AJ | 5269.07 | 482.44 | 131.50 | 6.45 | 542.95 | 45.47 | 2904.44 | 258.70 | 1458.30 | 148.58 | 738.58 | 78.68 | 2890.74 | 275.77 |
| NZW | 4893.43 | 401.93 | 75.74 | 4.53 | 814.85 | 74.06 | 2471.50 | 165.35 | 1032.28 | 72.20 | 335.93 | 35.89 | 2596.10 | 166.23 |
| AKRJ | 4250.77 | 565.81 | 56.95 | 7.05 | 539.33 | 56.97 | 3231.33 | 306.39 | 907.47 | 72.44 | 789.80 | 87.27 | 2538.27 | 156.38 |
| C3H | 3179.43 | 217.84 | 87.39 | 9.75 | 386.41 | 30.70 | 3010.20 | 337.93 | 645.15 | 87.62 | 782.81 | 64.12 | 3566.03 | 382.21 |
| BALBB | 2879.73 | 186.21 | 56.41 | 3.36 | 181.17 | 33.52 | 1492.93 | 118.47 | 326.33 | 42.01 | 219.19 | 22.03 | 3510.77 | 239.05 |
| BALBC | 2743.50 | 344.04 | 37.82 | 4.35 | 255.34 | 21.57 | 1432.78 | 161.63 | 532.02 | 57.09 | 339.19 | 36.16 | 3846.07 | 104.90 |
| B10 | 4957.50 | 184.77 | 205.00 | 12.12 | 807.00 | 77.77 | 1528.54 | 66.18 | 581.44 | 55.43 | 431.98 | 26.06 | 2166.90 | 97.62 |
| C57 | 5632.27 | 428.77 | 113.41 | 10.33 | 881.45 | 74.81 | 1382.73 | 89.04 | 374.18 | 38.10 | 404.93 | 20.30 | 2550.83 | 265.41 |
| NZB | 5108.30 | 462.14 | 116.82 | 16.35 | 781.55 | 28.94 | 3455.87 | 354.23 | 848.99 | 123.28 | 609.21 | 85.73 | 5662.13 | 601.58 |
| 129x | 4920.93 | 413.97 | 153.71 | 10.56 | 1175.43 | 113.06 | 3915.63 | 407.41 | 1459.82 | 92.87 | 517.88 | 98.26 | 4328.67 | 479.82 |
| AHeJ | 3608.10 | 256.85 | 51.56 | 5.34 | 447.27 | 57.54 | 2520.40 | 188.35 | 1193.15 | 193.22 | 329.11 | 50.79 | 3818.20 | 318.89 |
M8 was a major metabolite that accounted for 3–15% of the total amount of drug-related radioactivity present in the plasma of the 13 strains (Supplemental Tables IIIa and IIIb). Enzymatic digestion studies (Supplemental Figure 1) and subsequent structural characterization by mass spectrometry (data not shown) confirmed that M8 is a glucuronidated metabolite of 7-hydroxywarfarin. This result is consistent with the fact that glucuronidation is a major pathway for converting hydroxylated warfarin to more water-soluble metabolites 13,16. The amount of 7-hydroxywarfarin (7-OH) and its glucuronidated metabolite (M8) were summed in all subsequent analyses, because these two metabolites have a substrate-product relationship that forms a distinct drug elimination pathway. This (%M8 + 7-OH) represents the combined amount of the two metabolites and is expressed as a percentage of drug-related radioactivity in plasma (Figure 3A). Among the 9 metabolites in plasma, the 13 inbred strains had the greatest statistical difference in the combined amount of these two metabolites (p<0.01); and two closely related inbred strains (C57B/6J and B.10.D2-H2/oSnJ) produced the lowest amount of this material (Supplemental Table IIIa and IIIb). The differential pattern of M8+7-OH generation across strains was consistently observed throughout the first 8 hours after dosing (Supplemental Figure 3). Moreover, the amount of M8 and 7-OH in plasma decayed at the same rate as warfarin within 8 hr after dosing (Supplemental Figure 2), indicating the rate limiting step for elimination of these metabolites is their rate of formation 17. Taken together, formation of glucuronidated 7-hydroxywarfarin (M8) is a major pathway for R-warfarin disposition among these inbred strains. Since there are strain-specific differences in utilization of this elimination pathway, it was selected for computational genetic analysis.
Supplemental Figure 1.
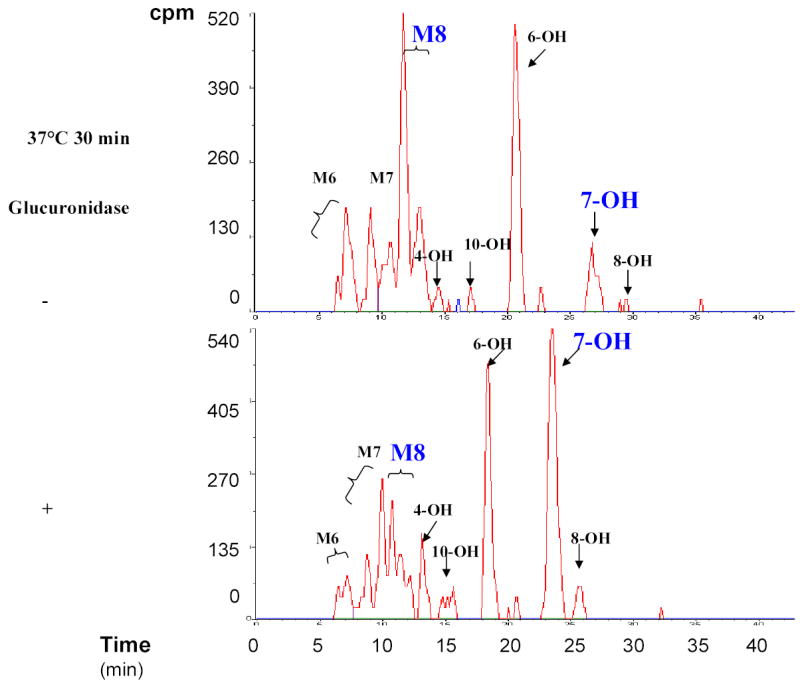
β–glucuronidase hydrolysis of M8 (putative warfarin conjugates). Urine samples obtained from drug-treated MRL/MpJ mice were hydrolyzed with β–glucuronidase, and the HPLC-radiometric chromatograms of samples before and after enzymatic hydrolysis are shown. Comparison of these chromatograms indicate that there is a decrease in M8 and a proportional increase in 7-hydroxywarfarin after enzymatic digestion. The indicated metabolites were identified by retention time, sensitivity to β–glucuronidase, and ultraviolet spectra.
Figure 3.
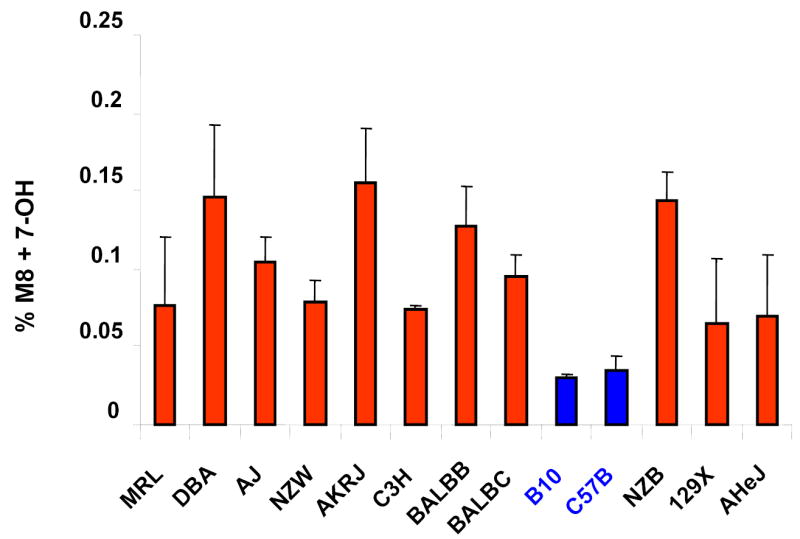
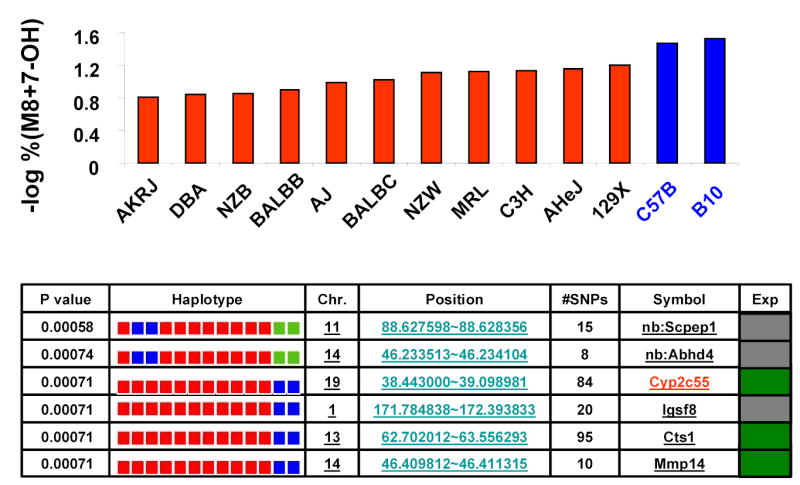
Haplotype-based genetic analysis of warfarin metabolites. Panel (A) shows the combined amount of 7-hydroxywarfarin (7-OH) and its glucuronidated metabolite (M8) as a % of the total amount of drug and metabolites, which is indicated as the % M8 + 7-OH for each inbred strain. The data obtained from two independently performed dosing studies is expressed as average + standard deviation. (B) The log-transformation of the measured % M8 + 7-OH for each of 13 inbred strains is shown in the top panel. A representative set of haplotype blocks having the highest correlation with this data set are shown in the lower panel. For each predicted block, the chromosomal location, number of SNPs within a block, its gene symbol and an indicator of gene expression in liver are shown. The haplotype for each strain is represented by a colored block, and is presented in the same order as the phenotypic data in the top panel. The calculated p-value measures the probability that strain groupings within an individual block would have the same degree of association with the phenotypic data by random chance. In the gene expression column, a green square indicates the gene is expressed in liver tissue, while a gray square indicates that it is unknown. The complete list of haplotype blocks is shown in supplemental table V.
Supplemental Figure 3.
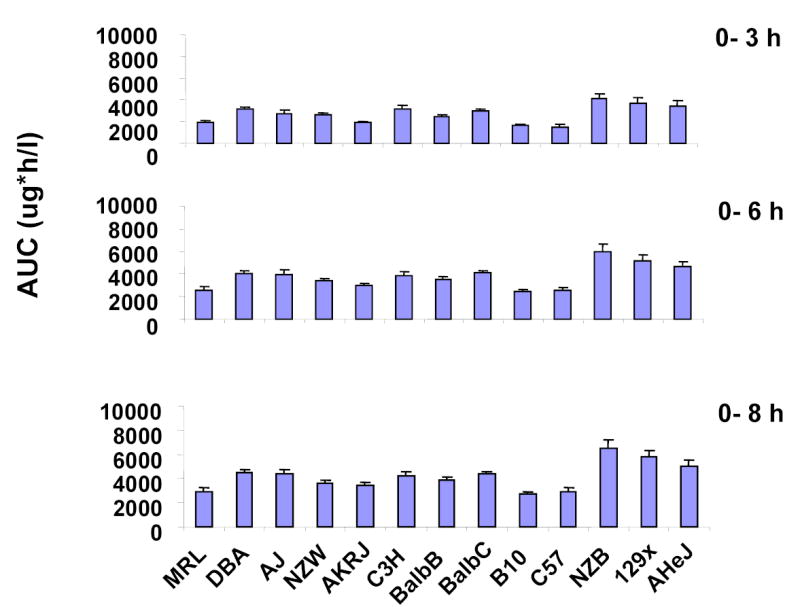
The Area Under Concentration-time Curve (AUC) for 7-hydroxywarfarin metabolites (7-OH + M8) within 8 hr after a 10 mg/kg IP dose of 14C-R-warfarin was administered to males of 13 inbred mouse strains. The concentrations of the indicated metabolite in plasma were measured by LC/MS/MS analysis. Each data point is the average ± the standard deviation of 3 samples.
Supplemental Figure 2.
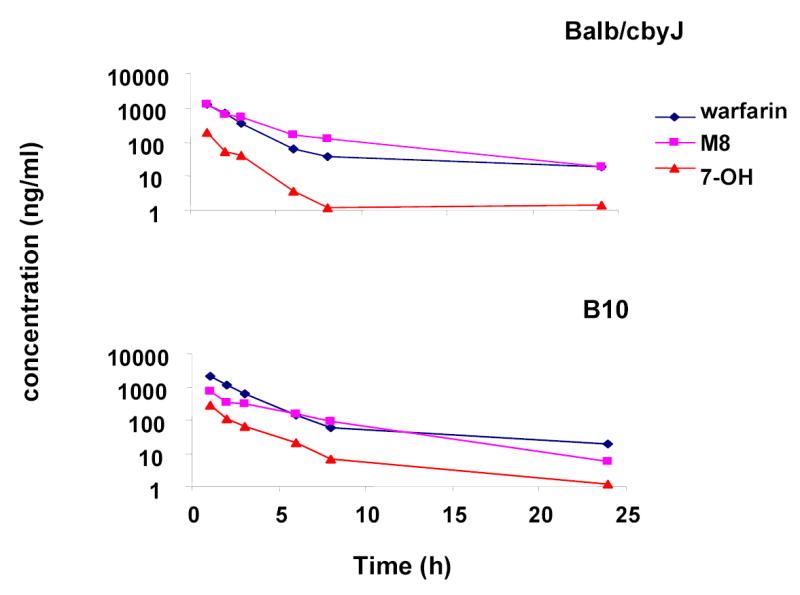
A logarithmic plot comparing the plasma concentrations of R-warfarin, 7-hydroxywarfarin and M8 in strains with a high rate (Balb/cbyJ) and a low rate (B.10.D2-H2/oSnJ) of generating 7-hydroxywarfarin metabolites. A single IP 10 mg/kg dose of 14C-R-warfarin was administered to males of 13 inbred mouse strains. The concentrations of R-warfarin and the two metabolites in plasma samples were quantitated by LC/MS/MS. Each data point represents the average of 3–5 different mice analyzed at each time point.
Computational genetic identification of Cyp2c enzymes
Haplotype-based computational genetic analysis 2–5 was used to identify genetic factors contributing to the strain-specific differences in warfarin metabolism. It identified 34 genomic regions where the two closely related strains (C57B/6J and B.10.D2-H2/oSnJ) with the lowest rate of production of 7-hydroxywarfarin metabolites shared a unique haplotype that was distinct from the other 11 strains (Supplemental Table V). Since these haplotype blocks had the strongest correlation with the pharmacokinetic data, genes within any of these regions could potentially be responsible for differential warfarin metabolism among the inbred strains. However, the list was quickly narrowed by determining which of these blocks contained genes that were expressed in liver. Analysis of gene expression data indicated that only 19 of these haplotype blocks encoded genes that were expressed in the liver. Furthermore, a 0.52 Mb region (38.44 to 39.10 Mb) on chromosome 19 that encodes several Cyp2c P450 enzymes was of particular interest (Figure 3B). It was the only region that encoded a phase I biotransformation enzyme, and polymorphisms in human CYP2C9 affect the rate of warfarin metabolism in treated patients 12. This computationally identified region encodes 3 murine cytochrome P450 enzymes: Cyp2c55, Cyp2c29 and Cyp2c39. There were two distinct haplotypes within this block, the C57BL/6 and B10.D2 strains shared a haplotype that differed from the other 11 strains (Figure 4A). This pattern of genetic variation had a very high degree of correlation with the pattern of metabolite generation (p=0.0007), since there was no overlap between the two genetically and phenotypically distinct strain groupings. Among the 93 SNPs located within this computationally identified haplotype block, 9 SNPs are in coding regions, but only one encodes an amino acid change (Val113Ile) in Cyp2c39 (http://mousesnp.roche.com). Of note, there was a distinct haplotype block in an immediately adjacent region on chromosome 19 (39.54 Mb to 39.66 Mb) that encodes two other cytochrome P450 enzymes: Cyp2c37 and Cyp2c50. However, the C57BL/6, B10.D2, DBA/2J and C3H strains all share the minor haplotype in this block, making it unlikely that Cyp2c37 and Cyp2c50 are responsible for the observed difference in metabolite production. In summary, the computational genetic analysis suggested that genetic variation within Cyp2c55, Cyp2c29 and/or Cyp2c39 may be responsible for the strain-specific differences in the rate of 7-hydroxywarfarin metabolite production.
Supplemental Table V.
All genomic regions where the C57B/6J and B.10.D2-H2/oSnJ share a unique haplotype that differs from the other 11 strains. For each predicted block, the chromosomal location, number of SNPs within a block, its gene symbol and an indicator of gene expression in liver are shown. In the gene expression column, a green square indicates the gene is expressed in liver tissue, a blue square indicates that it is not, while a gray square indicates unknown.
| Chr. | Position | #SNPs | Symbol | Exp |
|---|---|---|---|---|
| 1 | 171.784838~172.393833 | 20 | Igsf8 | x |
| 1 | 172.401363~172.402495 | 14 | Kcnj9 | n |
| 1 | 172.411182~172.441610 | 12 | Kcnj10 | n |
| 1 | 191.803831~191.804563 | 5 | Slc30a1 | y |
| 1 | 192.308111~192.330794 | 25 | Kcnh1 | n |
| 4 | 146.486668~146.487963 | 11 | Masp2 | y |
| 6 | 108.729673~108.740188 | 7 | Itpr1 | y |
| 6 | 135.789359~135.837639 | 32 | Grin2b | n |
| 7 | 75.445831~75.479860 | 25 | Ctsc | y |
| 7 | 89.539751~89.548616 | 20 | Art5 | y |
| 7 | 89.549379~89.552004 | 8 | Trpc2 | n |
| 7 | 89.971746~89.977619 | 30 | Rrm1 | y |
| 8 | 23.738182~23.757223 | 37 | Adam9 | y |
| 8 | 67.905037~67.932681 | 16 | Lpl | y |
| 8 | 92.177176~92.181097 | 10 | Mmp2 | n |
| 9 | 48.705110~48.720039 | 33 | Nnmt | y |
| 9 | 106.225659~106.382186 | 51 | 2510040D 07Rik | n |
| 9 | 106.382628~106.387453 | 19 | Acy1 | y |
| 11 | 41.642067~41.642325 | 8 | Gabrg2 | n |
| 11 | 88.594872~88.625049 | 83 | Scpep1 | x |
| 11 | 107.466993~107.544794 | 27 | Cacng5 | y |
| 13 | 62.702012~63.576703 | 147 | Ctsl | y |
| 14 | 42.503988~43.515434 | 40 | Adprtl2 | y |
| 14 | 46.234374~46.245543 | 42 | Abhd4 | x |
| 14 | 46.409812~46.411315 | 10 | Mmp14 | y |
| 14 | 46.588681~46.937718 | 21 | Psmb5 | y |
| 15 | 80.719225~80.726633 | 20 | Cacna1i | x |
| 16 | 98.369827~98.412517 | 18 | Tmprss2 | y |
| 18 | 53.334388~53.351991 | 8 | Sncaip | n |
| 18 | 57.023242~57.036757 | 56 | Aldh7a1 | y |
| 19 | 38.443000~39.098981 | 84 | Cyp2c55 | y |
| 19 | 43.146384~43.148069 | 10 | Abcc2 | y |
| 19 | 47.208472~47.209159 | 5 | 4930463G 05Rik | x |
| X | 63.821007~63.834359 | 33 | Gabre | n |
Figure 4.
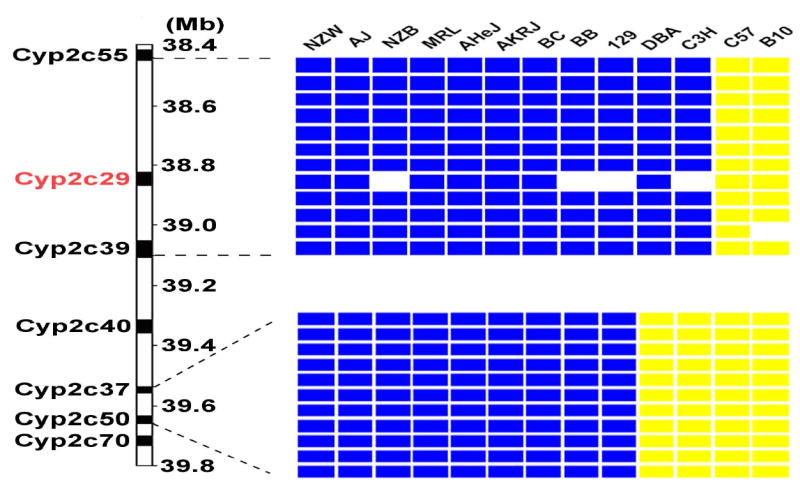
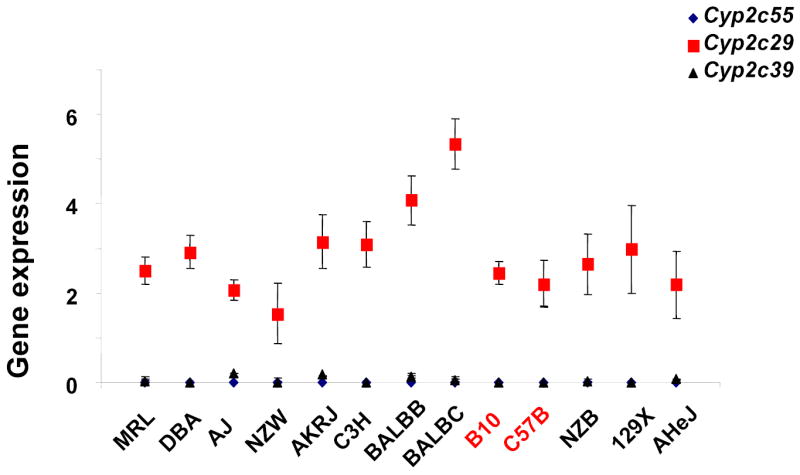
(A) The location of Cyp2c genes on chromosome 19 and the haplotypes for 13 inbred mouse strains in this region are shown. On the left, the chromosomal position of each Cyp2c gene is indicated as base pairs downstream of the centromere. The right panel shows two distinct haplotype blocks that extend from Cyp2c55 to Cyp2c39 (38,443,000 to 39,098,981), and from Cyp2c37 to Cyp2c50 (39,536,137 to 39,658,804). The genomic position of each haplotypic block was determined using mouse genome NCBI build 33. Within a block, each column represents one inbred mouse strain, and each box represents the corresponding allele for the indicated mouse strain. A blue box indicates that the strain has the most common (or major) allele, a yellow the minor allele, and an empty box indicates that the allele is unknown. (B) The level of Cyp2c gene (Cyp2c55, 29 and 39) expression in liver among males of 13 inbred mouse strains measured by RT-PCR. Each data point is the average ± standard error of 3 measurements performed on 3 liver samples, and was normalized relative to the expression level of actin.
Cyp2c29 mediates warfarin biotransformation
Experimental testing was required to assess this computational prediction and to determine which cytochrome P450 enzyme(s) played a role in R-warfarin biotransformation. As an initial test, the role of murine Cyp2c enzymes in R-warfarin metabolism was investigated using an in vitro system. After incubation with R-warfarin, mouse liver microsomes biotransformed R-warfarin into several hydroxylated metabolites in a concentration-dependent manner. Of importance, 7-hydroxywarfarin was a major metabolite produced by the microsomal enzymes (Figure 5A). Tolbutamide, a specific inhibitor of Cyp2c enzyme activity 18, inhibited the formation of 7-hydroxywarfarin in a concentration-dependent manner (Figure 5B). These in vitro results indicate that biotransformation to 7-hydroxylated metabolites is an important pathway for R-warfarin metabolism in liver, and confirm the computational prediction that a Cyp2c enzyme is a critical part of this elimination pathway.
Figure 5.
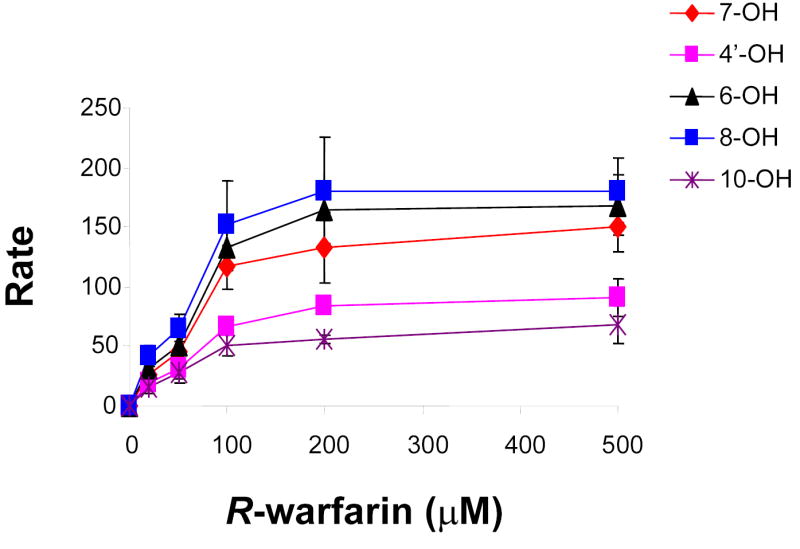
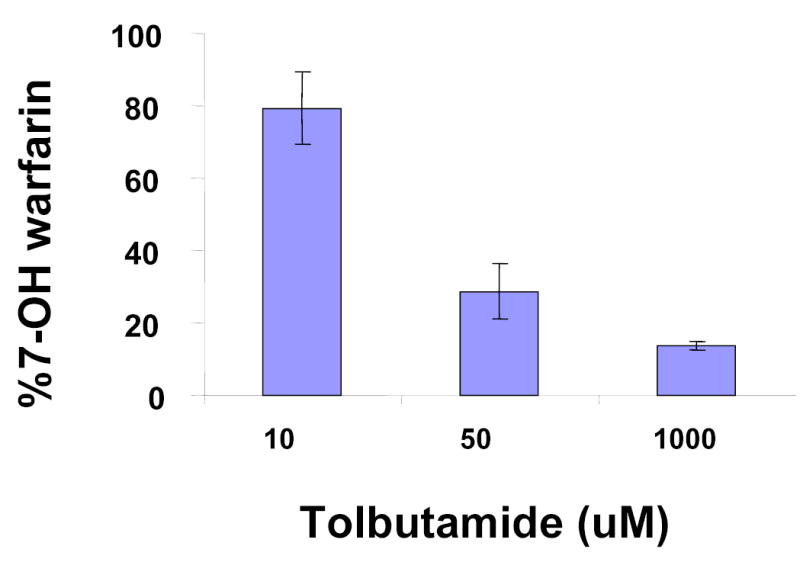
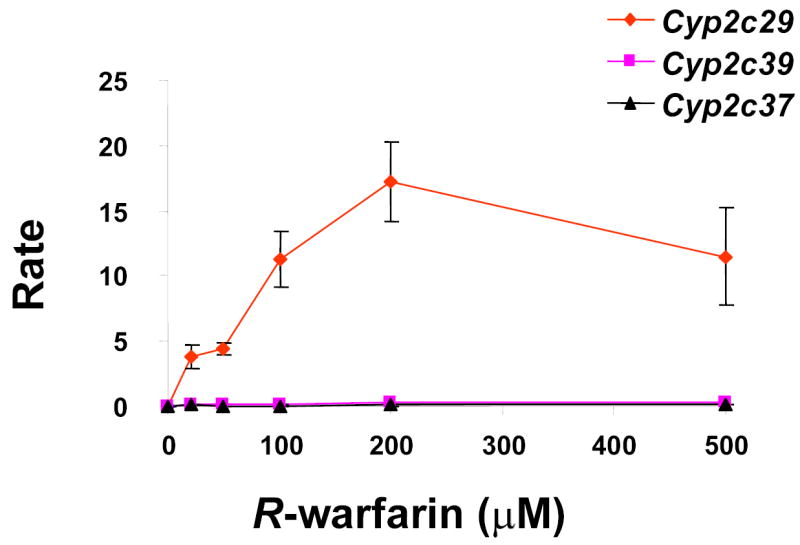
(A) In vitro biotransformation of R-warfarin in mouse liver microsomes. The rate (pmol/min/nmol CYP) of formation of the indicated metabolites was measured after incubation with the indicated concentrations of R-warfarin in CD-1 mouse liver microsomal preparations. Each data point represents the average ± standard deviation of 3 individual measurements. (B) The effect of a Cyp2c isoform-specific inhibitor (tolbutamide) on the rate of formation of 7-hydroxywarfarin from R-warfarin (150 μM) in mouse liver microsomes was measured. Each data point represents the average ± standard error of 3 individual measurements. (C) In vitro biotransformation of R-warfarin by expressed recombinant murine Cyp2c29, Cyp2c39 and Cyp2c37 cDNAs. The rate (pmol/min/nmol CYP) of formation of 7-hydroxywarfarin was measured after incubation with the indicated concentrations of R-warfarin. cDNAs were generated from a strain with a high rate (Balb/cbyJ) and a low rate (B.10.D2-H2/oSnJ) of generation of 7- hydroxywarfarin and M8 metabolites. Cyp2c29 biotransformed R-warfarin to 7-hydroxywarfarin, while Cyp2c39 and Cyp2c37 lacked this activity. Each data point represents the average ± standard deviation of 4 individual measurements.
To determine which Cyp 2C enzyme(s) was responsible for the strain-specific difference in R-warfarin biotranformation, the pattern of gene expression in liver tissue obtained from 13 inbred strains was analyzed. Cyp2C55 and Cyp2c39 were eliminated as candidate genes because they were not expressed in liver tissue from any inbred strain analyzed (Figure 4B). In contrast, Cyp2c29 was the most abundantly expressed Cyp 2c mRNA in liver tissue. Although there were strain-specific differences in Cyp2c29 mRNA expression, it varied among strains sharing the common haplotype, and could not explain the observed difference in 7-hydroxywarfarin metabolite production among the inbred strains (Figure 4B). However, quantitative immunoblot analysis of Cyp2c29 protein in liver tissue obtained from a set of inbred strains indicated that there was a much better correlation between the amount of this protein and the haplotype of the inbred strain. The amount of Cyp2c29 protein in liver obtained from 5 strains (AKR/J, MRL/MpJ, Balb/cJ, Balb/cbyJ, and 129x1/svJ) sharing the common haplotype was 2 to 7.4 fold higher than in the two (C57BL/6 and B10.D2) strains with a unique haplotype and a low rate of 7-hydroxywarfarin metabolite generation (Figure 6).
Figure 6.
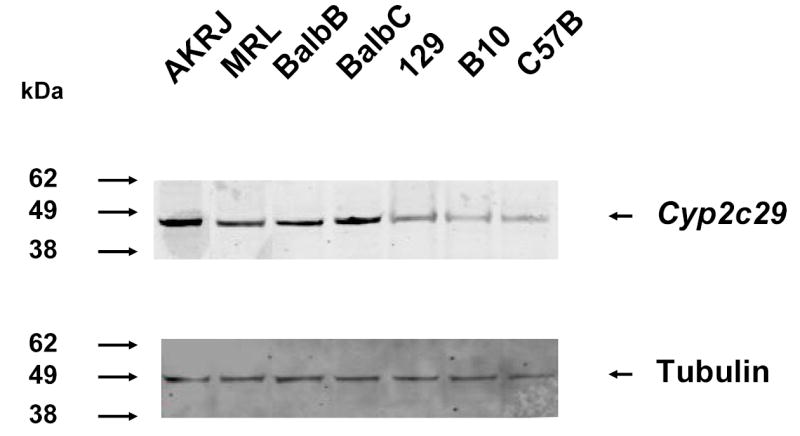
Immunoblot analysis of Cyp2c29 protein in liver extracts prepared from 7 inbred strains. Liver microsomal extracts prepared from 5 strains (AKRJ: AKR/J; MRL: MRL/MpJ; BalbB: Balb/cybJ; BalbC: Balb/cJ; 129x: 129x1/svJ) with a high rate, and 2 strains with a low rate (B10: B10.D2; C57B: C57B/6J) of 7-hydroxywarfarin generation. Immunobloting was performed on 25 μg of protein per lane using a polyclonal anti-murine Cyp2c29 IgY antibody (upper panel). The blot was then stripped and re-probed with an anti-tubulin antibody as a control for the amount of protein in each lane (lower panel). The relative mobility of molecular weight markers is shown on the left.
To determine which enzyme mediated R-warfarin biotransformation to its 7-hydoxylated metabolite, recombinant Cyp2c enzymes within the computationally predicted block (Cyp2c29 and Cyp2c39) and a Cyp2c enzyme (Cyp2c37) adjacent to this block were prepared. For each of these Cyp2C enzymes, allelic forms from a strain with a high (Balb/cbyJ) and a low (B10.D2) rate of generation of 7-hydroxywarfarin metabolites were expressed. The rate at which these recombinant enzymes converted R-warfarin to hydroxylated metabolites in vitro was then measured. Expressed recombinant murine Cyp2c29 converted R-warfarin to 6-, 7- or 8-hydroxywarfarin, but could not generate 4- or 10-hydroxywarfarin. However, the rate of formation of 7-hydroxywarfarin was higher than that of the 6- or 8-hydroxywarfarin metabolites (Supplemental Table VI). In contrast, neither allelic form of Cyp2c39 nor Cyp2c37 generated measurable amounts of 7-hydroxywarfarin under the same in vitro conditions (Figure 5C). In addition, the measured Km for 7-hydroxywarfarin formation in liver microsomes was comparable to that of recombinant Cyp2c29, which further supports a role for Cyp2c29 in R-warfarin metabolism in liver (Supplemental Table VI) 19. These results confirm the computational prediction and indicate that genetic variation within Cyp2c29 is responsible for the strain-specific differences in the rate of production of 7-hydroxywarfarin. The amino acid sequence of Cyp2c29 is not altered by polymorphisms among the inbred strains. However, the 63 SNPs within Cyp2c29 do produce a significant strain-specific difference in Cyp2c29 protein expression. Taken together, strain-specific differences in R-warfarin elimination via formation of 7-hydroxywarfarin metabolites result from differences in the amount of Cyp2c29 protein.
Supplemental Table VI.
Kinetic parameters for in vitro biotransformation of R-warfarin to 6-, 7-and 8-hydroxywarfarin by recombinant Cyp2c29 and the CD-1 mouse liver microsomes.
| Km | Vmax | Vmax/Km | |
|---|---|---|---|
| Recombinant | (μM) | (pmol/min/nmol CYP) | (pmol/min/nmol CYP/μM) |
| Cyp2c29 6-OH | 68.0 ± 19.3 | 9.5 ± 1.8 | 0.14 |
| 7-OH | 115.3 ± 37.3 | 20.2 ± 7.2 | 0.18 |
| 8-OH | 37.1 ± 22.9 | 6.1 ± 2.8 | 0.16 |
| Microsomes 6-OH | 189.1 ± 101.3 | 289.2 ± 59.2 | 1.5 |
| 7-OH | 240.6 ± 141.2 | 276.9 ± 88.3 | 1.2 |
| 8-OH | 97.2 ± 2.6 | 241.2 ± 54.3 | 2.5 |
DISCUSSION
This is the first detailed functional and genetic characterization of the metabolism of a commonly prescribed medication using multiple inbred mouse strains. The rate of clearance of R-warfarin and 9 different metabolites in 13 inbred strains was characterized, and then analyzed using a haplotype-based computational genetic analysis method. Cyp2c29 was computationally identified as a candidate gene, and experimentally shown to contribute to strain-specific differences in R-warfarin metabolism. Although other genetic variables also contribute to the inter-strain differences in R-warfarin pharmacokinetics, Cyp2c29 was computationally identified because it is the rate-limiting enzyme within a major pathway for elimination of this drug. There is limited information available about R-warfarin metabolism in mice, but a role for murine Cyp2c29 in R-warfarin metabolism is consistent with available information. Murine Cyp2c29 is known to metabolize endogenous compounds such as arachidonic acid 20 and scoparone 21, as well as other drugs. We now find that R-warfarin is an additional substrate for this enzyme. Warfarin metabolism in humans is catalyzed by a variety of cytochrome P450 enzymes, and polymorphisms in CYP2C9 alter the rate of warfarin metabolism in the human population 12,14. Cyp2c29 is a murine homologue of human CYP2C9, and it may utilize similar mechanisms for biotransformation of warfarin.
Of broader significance, this study demonstrates how genetic changes in a rate-limiting component of a metabolic pathway can be successfully identified using murine haplotype-based computational genetic analysis. This required experimental dissection of a very complex, multi-component drug disposition process into its component parts. Warfarin metabolism is a complex process in which at least nine different intermediate metabolites were produced. Several different enzymes may be involved in the production of each metabolite, and genetic variation within each of these enzymes can contribute to the strain-specific differences in R-warfarin metabolism. An individual genetic change must be responsible for at least 40% of the phenotypic variation for it to be identified by this computational method using data obtained from 13 to 15 inbred strains 3. It is therefore not surprising that this computational method could not analyze the overall rate of R-warfarin disappearance across the inbred strains. To reduce the complexity, the rate of production of each individual metabolite was carefully quantitated. The rate of production of an individual metabolite is regulated by a much more limited set of genetic variables. Because of the reduced genetic complexity, the haplotype-based computational method could successfully analyze the strain-specific pattern of R-warfarin elimination through a single metabolic pathway. It is likely that a thorough analysis of the rate of formation of intermediate metabolites will also be required to uncover the genetic factors responsible for differences in the pharmacokinetic response to other drugs.
In addition to identifying a genetic variant regulating a major pathway for R-warfarin elimination, several other findings in this study are of general significance. First, there was substantial variation in the pattern of intermediate metabolites of R-warfarin generated by the panel of inbred strains analyzed. The pattern of metabolism of other commonly used drugs may also vary among inbred strains, which may enable genetic factors regulating their disposition to be identified using this approach. Secondly, it is likely that this experimental approach can also be used to uncover the mechanism of drug-induced toxicity. Drug-induced toxicity is often caused by intermediate metabolites, rather than by the parent drug itself. Correlation of the strain-specific pattern of drug-induced toxicity with the production of certain metabolites, as well as with a pattern of genetic variation within a gene can be used to identify a genetic susceptibility factor for a toxic response.
It is also important to emphasize that this murine experimental approach and genetic analysis tool may not always generate results that directly translate to human drug metabolism. For example, R- and S-warfarin are metabolized by different cytochrome P450 enzymes in different species. CYP1A2 and CYP3A4 are the major contributors to R-warfarin metabolism in humans 12, which differs from our findings in mice. Despite these differences, this computational mouse genetic approach can quickly identify polymorphisms in drug metabolizing enzymes that contribute to differential drug responses among a panel of inbred mouse strains. The drug metabolizing enzymes identified in mouse provide important information that indicates which genes are likely to play an important role in the human population. We believe that this first example illustrates how murine haplotype-based computational genetic analysis can be used for pharmacogenetic analysis; and hope that it will be used to analyze many other commonly used medications.
MATERIALS AND METHODS
Chemicals, reagents and equipment
R-Warfarin, the 4′-, 6-, 7-, 8-, and 10-hydroxylated metabolites of R-Warfarin, and deuterium-labeled 7-hydroxywarfarin (>98% chemical purity) as the internal standard (IS) for the LC/MS/MS analysis were purchased from Ultrafine Chemicals (Manchester, UK). 14C-R-warfarin used to dose mice and 4-glucuronide 7-hydroxywarfarin used as the standard for quantitation of M8 were synthesized in the Chemical Services (Roche Palo Alto, Palo Alto, CA). Tolbutamide was obtained from Alta Aesar (Ward Hill, MA). Methanol and acetonitrile were purchased from Burdick & Jackson (Muskegon, MI) and formic acid was from Sigma-Aldrich (St. Louis, USA). All solvents used for HPLC and LC/MS/MS were of chromatographic grade. Liquid scintillation counting of plasma samples was carried out on a Beckman LS-6500 multi-purpose scintillation counter (Beckman Coulter, Fullerton, CA).
Drug dosing and plasma harvesting from inbred strains
7–8 week old males of inbred mouse strains were obtained from Jackson Laboratory (Bar Harbor, ME) and acclimatized for an additional week in the Laboratory Animal Technology (Roche Palo Alto, Palo Alto, CA). Mice were housed under pathogen-free environment and provided food and water ad libitum with a 12 h:12 h light: dark cycle. The 13 different inbred mouse strains used were Balb/cJ, DBA/2J, A/J, AKR/J, A/HeJ, 129x1/svJ, Balb/cbyJ, B.10.D2-H2/oSnJ, C57B/6J, NZW/LaCJ, NZB/BinJ, MRL/MpJ, C3H/HeJ. All mice were administered a single 10 mg/kg of 14C-R-warfarin (specific activity: 18.6 μCi/mg) suspended in PBS (pH 7.4) via intraperitoneal (IP) route. For each strain, blood samples were collected from 3 mice at the 1, 2, 3, 6 and 8 h, and 5 mice at the 24 h time point following treatment to obtain individual plasma samples. Pooled urine samples from the 5 mice within each strain were collected for 24 hours. Animal studies have been replicated once. All animal experiments were implemented under the protocols approved by our Institutional Animal Care and Use Committee.
HPLC-radiometric analysis
All samples were extracted using an acetonitrile/methanol (4:1 v/v) mixture to precipitate proteins prior to bioanalyses 22. HPLC-radioflow analysis utilized a HP1100 HPLC system (Hewlett Packard Corp., Waldbronn, Germany) with an online Radiomatic Series 500TR (Packard Instruments Co.) equipped with a 0.1-ml flow cell, and a Shimadzu UV detector set at 310 nm. Empower Pro Software Build 1154 (Waters, Milford, MA) was applied to control the instrument operation as well as the data acquisition and analysis. R-warfarin and its metabolites were separated on a Thermo® BDS Hypersil-C18 (250 x 4.6 mm, 5 μm) with HPLC guard column (Thermo Electron Corporation, Bellefonte, PA) at a flow rate of 0.5 ml/min. The mobile phases were 5 mM ammonium formate in 0.1 % formic acid (A), and 0.1% formic acid in methanol (B). The gradient of B was as follows: 60% (0–22 min), 65% (23–30 min), 90% (45– 46 min), and 60% (47–60 min). The radioflow detector sampled every 6 sec with a 3:1 mixing ratio of scintillation fluid (Beta-Blend, ICN) and HPLC effluent.
LC/MS/MS analysis
The LC/MS/MS system was equipped with Analyst software (Applied Biosystems) for data acquisition and calibration, and consisted of a Shimadzu LC system, a vacuum degasser, an autoinjector, and a Sciex API 4000 triple quadrupole mass spectrometer (MS/MS) (Applied Biosystems, Foster City, CA). Chromatographic separation was achieved on a reversed-phase Luna C18 (100 × 2.0 mm, 3 μm) (Phenomenex, Torrance, USA) as described previously 23. The MS was operated under negative ionization in the multiple reaction monitoring (MRM) mode for quantitative analysis and synchronized with the HPLC. The parameters of MRM are listed in the Supplemental Table I. Calibration curves were developed by spiking blank plasma with appropriate amounts of R-warfarin and its metabolites using eight different concentrations in the range of 5–3000 ng/ml (R-warfarin) and 5–2000 ng/ml (metabolites), respectively. The peak area ratio of R-warfarin or metabolites over that of IS was quantitated, and correlation coefficients were calculated by least-square regression analysis.
Supplemental Table I.
MRM parameters for the detection of warfarin, 4′-, 6-, 7-, 8-, 10-hydroxywarfarin, deuterium-labeled 7-hydroxywarfarin (IS) and 7-hydroxywarfarin-4-glucuronide. The LC/MS/MS conditions used here: curtain gas: 10; nebulizer gas: 40; turbo gas: 40; collision-activated dissociation collision gas: 4; source temperature: 350°C; ion spray voltage: -4200V. CE: collision energy; EP: entrance potential; DP: declustering potential; CXP: cell exit potential.
| MRM | Parent (m/z) | Daughter (m/z) | CE | EP | DP | CXP |
|---|---|---|---|---|---|---|
| warfarin | 307.0 | 161.5 | −30 | −10 | −90 | −31 |
| 4′, 6-hydroxywarfarin | 323.9 | 266.1 | −30 | −10 | −75 | −7 |
| 7, 8- hydroxywarfarin | 324.0 | 177.1 | −26 | −10 | −75 | −11 |
| Deuterium- labeled 7- hydroxywarfarin (IS) | 327.9 | 177.1 | −30 | −10 | −80 | −11 |
| 10- hydroxywarfarin | 324.0 | 250.7 | −28 | −10 | −50 | −15 |
| 7-hydroxywarfarin-4- glucuronide | 499.0 | 323.1 | −18 | −10 | −80 | −7 |
Metabolite identification
Warfarin conjugates were hydrolyzed by incubation of plasma or urine samples with β–glucuronidase (Sigma, St. Louis, USA) according to a modified method 16,24. Then the HPLC-radioflow profiles of samples before and after enzymatic treatments were compared to identify peak intensity shifts. The identity of conjugates was verified by mass spectrometry with a scanned mass range of 200–800 amu as described before 25 using the chromatographic separation method described in the previous HPLC-radioflow analysis.
Computational genetic mapping
The computational genetic analysis of the inbred strain data was performed as previously described 2–5. In brief, allelic data from multiple inbred strains was analyzed and a haplotype block map of the mouse genome was constructed 4,5. SNPs were organized into haplotype blocks; and only a limited number of haplotypes-typically 2, 3 or 4-are present within a haplotype block. The haplotype-based computational analysis identifies haplotype blocks in which the haplotypic strain grouping within the block correlates with the distribution of phenotypic data among the inbred strains analyzed. To do this, a p-value that assesses the likelihood that genetic variation within each block could underlie the observed distribution of phenotypes among the inbred strains is calculated 2,4. The haplotype blocks are then ranked based upon the calculated p-value. The genomic regions within haplotype blocks that strongly correlated with the phenotypic data are then analyzed. When this computational analysis was performed, the haplotype map had 5,454 haplotype blocks generated from 193,914 SNPs characterized across 19 inbred strains covering 2,363 genes. Polymorphisms within 40 Cyp450 enzymes and 110 transporter (Abc or Slc) or transferase genes were included in the Roche SNP database. The p-values for the numerical phenotype evaluated in this experiment were calculated as described using ANOVA (Analysis of Variance) 2–4. Since ANOVA-based computational analysis requires homogeneity of variance, the measured amount of %M8+7-OH for each strain was normalized by logarithmic transformation before the computational analysis was performed.
cDNA cloning strategy and baculovirus expression
cDNAs for mouse Cyp2c29, Cyp2c39 and Cyp2c37 from Balb/cbyJ and B.10.D2-H2/oSnJ were generated by RT-PCR using primers described in Supplemental Table II, and cloned into pVL1392 Univ ccdB. Recombinant baculovirus was produced using Rapid Suspension Transfection methods, and the infection time was 72 h. Lysates of Sf9 cells expressing recombinant cDNAs were prepared, and protein concentration and total CYP content measurements were performed as described 26,27.
Supplemental Table II.
PCR primers used in the cDNA cloning and RT-PCR experiments.
| Gene | |||
|---|---|---|---|
| cDNA cloning | Cyp2c29 | 5′-forward
3′-reverse |
ACGTGCGGCCGCTATGGATCTGGTCGTGTTCCTAGCGCTCACT
GATCGGCCCTGAAGGCCTCATTAGAGAGGAATGAAGCAGAGCTGGTAAGGGGGT |
| Cyp2c39 | 5′-forward
3′-reverse |
ACGTGCGGCCGCTATGGACCTTGTCACATTCCTAGTGCTCA
GATCGGCCCTGAAGGCCTCACACAAATCAAAATCAAGTATTATTG |
|
| Cyp2c37 | 5′-forward
3′-reverse |
ACGTGCGGCCGCTATGGATCCAATCCTGGTCCTGGTGCTCACT
GATCGGCCCTGAAGGCCTCATCAGGAAGGAATGAAGCAGAGCTGGA |
|
| RT-PCR | Cyp2c55 | 5′-forward
3′-reverse |
GCCAATACTTTTGGCCGTGTA
ATAGCAACAGCCAGTGTGTTCTG |
| Cyp2c29 | 5′-forward
3′-reverse |
CCCTCCCTATCAGGGATATGG
CTGTATGTGTTTGCTGGGTCTTG |
|
| Cyp2c39 | 5′-forward
3′-reverse |
GGTCTTTATTTACCTCTTTACTTATCAGGAA
AACCAGATGTGTTTGCTAGGTCTTT |
In vitro metabolic assays
In vitro R-warfarin biotransformation using CD-1 mouse liver microsomes incubated for 30 minutes were performed as previously described 28. In vitro CYP inhibition assays used 0.01–1 mM tolbutamide and 0.15 mM R-warfarin. Samples were processed for LC/MS/MS analysis as described above. CYP biotransformation assays were reconstituted by mixing cell lysate of individual cDNA-expressed Sf9 cells (20 mg/ml protein) and human NADPH-P450 oxidoreductase (BD Gentest, Bedford, MA) at 1:8 molar ratio 29 for 30 min in the presence of 0.02–0.5 mM R-warfarin before LC/MS/MS analysis.
Gene expression analysis and Immunobloting
Total liver RNA was prepared as previously described 4. Cyp450 2c mRNA was analyzed by Taqman as described by the manufacturer (Applied Biosystems, Foster City, CA) using primers specified in Supplemental Table II. Cyp2c29 protein in liver S9 fractions was fractionated on NuPage 4–12% Bis-tris gels and determined by immunoblotting 30. A polyclonal anti-murine Cyp2c29 IgY antibody was raised with a peptide covering amino acids 99–112 (SFPMAEKMIKGFGV) by GenWay (San Diego, CA).
Supplemental Material
Analysis of R-warfarin metabolites in inbred mouse strains
A single intraperitoneal (IP) injection of a 10 mg/kg dose of 14C-labeled R-Warfarin was administered to male mice of 13 inbred strains; and plasma samples were collected 1, 2, 3, 6, 8, and 24 hours after dosing. Moreover, the strain-specific pattern of R-warfarin metabolism in plasma was independently confirmed through analysis of a second set of drug-treated males of 13 inbred mouse strains (Supplemental Table IIIb and IV). In these two independently performed studies, the most abundant metabolites in plasma were 6-hydroxywarfarin, M6, M8 and M9. These metabolites accounted for 5–6%, 0–14% and 5–17%, respectively, of the total amount of drug-related radioactivity present in the plasma of the 13 strains (Supplemental Figure IIIa and IIIb).
Acknowledgments
Y.G. was supported by a grant (1 R01 GM068885-01A1) from the NIGMS awarded to G.P. We would like to thank David Shaw, Ezra Tai, Witold Woroniecki, Lisa Lohr, Will Tao, Grace Lam and Larry Bowen for help with this manuscript.
Footnotes
Note: Supplementary information is available on the Nature Biotechnology website.
References
- 1.Evans WE, Relling MV. Pharmacogenomics: translating functional genomics into rational therapeutics. Science. 1999;286:487–91. doi: 10.1126/science.286.5439.487. [DOI] [PubMed] [Google Scholar]
- 2.Wang, J., Peltz, G. Haplotype-Based Computational Genetic Analysis in Mice. In Computational Genetics and Genomics: New Tools for Understanding Disease (ed. Peltz, G.) 51–70 (Humana Press Inc, Totowa, NJ, 2005).
- 3.Wang J, Liao G, Usuka J, Peltz G. Computational genetics: from mouse to human? Trends Genet. 2005;21:526–32. doi: 10.1016/j.tig.2005.06.010. [DOI] [PubMed] [Google Scholar]
- 4.Liao G, et al. In silico genetics: identification of a functional element regulating H2-Ealpha gene expression. Science. 2004;306:690–5. doi: 10.1126/science.1100636. [DOI] [PubMed] [Google Scholar]
- 5.Wang, J., et al.,. Haplotypic structure of the mouse genome. In Computational Genetics and Genomics: New Tools for Disease Biology (ed. Peltz, G.) 71–83 (Humana Press Inc, Totowa, NJ, 2005).
- 6.Phillips KA, Veenstra DL, Oren E, Lee JK, Sadee W. Potential role of pharmacogenomics in reducing adverse drug reactions: a systematic review. Jama. 2001;286:2270–9. doi: 10.1001/jama.286.18.2270. [DOI] [PubMed] [Google Scholar]
- 7.Suttie JW. The biochemical basis of warfarin therapy. Adv Exp Med Biol. 1987;214:3–16. doi: 10.1007/978-1-4757-5985-3_2. [DOI] [PubMed] [Google Scholar]
- 8.Nelsestuen GL, Zytkovicz TH, Howard JB. The mode of action of vitamin K. Identification of gamma-carboxyglutamic acid as a component of prothrombin. J Biol Chem. 1974;249:6347–50. [PubMed] [Google Scholar]
- 9.Stenflo J, Fernlund P, Egan W, Roepstorff P. Vitamin K dependent modifications of glutamic acid residues in prothrombin. Proc Natl Acad Sci U S A. 1974;71:2730–3. doi: 10.1073/pnas.71.7.2730. [DOI] [PMC free article] [PubMed] [Google Scholar]
- 10.James AH, Britt RP, Raskino CL, Thompson SG. Factors affecting the maintenance dose of warfarin. J Clin Pathol. 1992;45:704–6. doi: 10.1136/jcp.45.8.704. [DOI] [PMC free article] [PubMed] [Google Scholar]
- 11.Hallak HO, et al. High clearance of (S)-warfarin in a warfarin-resistant subject. Br J Clin Pharmacol. 1993;35:327–30. doi: 10.1111/j.1365-2125.1993.tb05703.x. [DOI] [PMC free article] [PubMed] [Google Scholar]
- 12.Kaminsky LS, Zhang ZY. Human P450 metabolism of warfarin. Pharmacol Ther. 1997;73:67–74. doi: 10.1016/s0163-7258(96)00140-4. [DOI] [PubMed] [Google Scholar]
- 13.Rettie AE, Wienkers LC, Gonzalez FJ, Trager WF, Korzekwa KR. Impaired (S)-warfarin metabolism catalysed by the R144C allelic variant of CYP2C9. Pharmacogenetics. 1994;4:39–42. doi: 10.1097/00008571-199402000-00005. [DOI] [PubMed] [Google Scholar]
- 14.Daly AK, King BP. Pharmacogenetics of oral anticoagulants. Pharmacogenetics. 2003;13:247–52. doi: 10.1097/00008571-200305000-00002. [DOI] [PubMed] [Google Scholar]
- 15.Rieder MJ, et al. Effect of VKORC1 haplotypes on transcriptional regulation and warfarin dose. N Engl J Med. 2005;352:2285–93. doi: 10.1056/NEJMoa044503. [DOI] [PubMed] [Google Scholar]
- 16.Jansing RL, Chao ES, Kaminsky LS. Phase II metabolism of warfarin in primary culture of adult rat hepatocytes. Mol Pharmacol. 1992;41:209–15. [PubMed] [Google Scholar]
- 17.Rowland, M. & Tozer, T.N. Clinical Pharmacokinetics: Concepts and Applications, (Lippincott Williams & Wilkins, 1995).
- 18.Riley RJ, Hemingway SA, Graham MA, Workman P. Initial characterization of the major mouse cytochrome P450 enzymes involved in the reductive metabolism of the hypoxic cytotoxin 3-amino-1,2,4-benzotriazine-1,4-di-N-oxide (tirapazamine, SR 4233, WIN 59075) Biochem Pharmacol. 1993;45:1065–77. doi: 10.1016/0006-2952(93)90251-q. [DOI] [PubMed] [Google Scholar]
- 19.Crespi CL, Miller VP. The use of heterologously expressed drug metabolizing enzymes--state of the art and prospects for the future. Pharmacol Ther. 1999;84:121–31. doi: 10.1016/s0163-7258(99)00028-5. [DOI] [PubMed] [Google Scholar]
- 20.Luo G, Zeldin DC, Blaisdell JA, Hodgson E, Goldstein JA. Cloning and expression of murine CYP2Cs and their ability to metabolize arachidonic acid. Arch Biochem Biophys. 1998;357:45–57. doi: 10.1006/abbi.1998.0806. [DOI] [PubMed] [Google Scholar]
- 21.Meyer RP, Hagemeyer CE, Knoth R, Kurz G, Volk B. Oxidative hydrolysis of scoparone by cytochrome p450 CYP2C29 reveals a novel metabolite. Biochem Biophys Res Commun. 2001;285:32–9. doi: 10.1006/bbrc.2001.5111. [DOI] [PubMed] [Google Scholar]
- 22.Rossi, D.T. Sample Preparation and Handling for LC/MS in Drug Discovery. in Mass Spectrometry in Drug Discovery (ed. Rossi, D.T., Sinz, M.W.) 171–214 (Marcel Dekker, Inc., New York, 2002).
- 23.Ufer M, Kammerer B, Kirchheiner J, Rane A, Svensson JO. Determination of phenprocoumon, warfarin and their monohydroxylated metabolites in human plasma and urine by liquid chromatography-mass spectrometry after solid-phase extraction. J Chromatogr B Analyt Technol Biomed Life Sci. 2004;809:217–26. doi: 10.1016/j.jchromb.2004.06.023. [DOI] [PubMed] [Google Scholar]
- 24.Edelbroek PM, van Kempen GM, Hessing TJ, de Wolff FA. Analysis of phenprocoumon and its hydroxylated and conjugated metabolites in human urine by high-performance liquid chromatography after solid-phase extraction. J Chromatogr. 1990;530:347–58. doi: 10.1016/s0378-4347(00)82337-3. [DOI] [PubMed] [Google Scholar]
- 25.Fitch WL, et al. Identification of glutathione-derived metabolites from an IP receptor antagonist. Drug Metab Dispos. 2004;32:1482–90. doi: 10.1124/dmd.104.000471. [DOI] [PubMed] [Google Scholar]
- 26.Patten CJ, et al. Kinetic analysis of the activation of 4-(methylnitrosamino)-1-(3-pyridyl)-1-butanone by heterologously expressed human P450 enzymes and the effect of P450-specific chemical inhibitors on this activation in human liver microsomes. Arch Biochem Biophys. 1996;333:127–38. doi: 10.1006/abbi.1996.0373. [DOI] [PubMed] [Google Scholar]
- 27.Omura T, Sato R. The Carbon Monoxide-Binding Pigment of Liver Microsomes. I. Evidence for Its Hemoprotein Nature. J Biol Chem. 1964;239:2370–8. [PubMed] [Google Scholar]
- 28.Zhang ZY, King BM, Wong YN. Quantitative liquid chromatography/mass spectrometry/mass spectrometry warfarin assay for in vitro cytochrome P450 studies. Anal Biochem. 2001;298:40–9. doi: 10.1006/abio.2001.5383. [DOI] [PubMed] [Google Scholar]
- 29.Buters JT, Shou M, Hardwick JP, Korzekwa KR, Gonzalez FJ. cDNA-directed expression of human cytochrome P450 CYP1A1 using baculovirus. Purification, dependency on NADPH-P450 oxidoreductase, and reconstitution of catalytic properties without purification. Drug Metab Dispos. 1995;23:696–701. [PubMed] [Google Scholar]
- 30.Zhang Z, Fasco MJ, Huang Z, Guengerich FP, Kaminsky LS. Human cytochromes P4501A1 and P4501A2: R-warfarin metabolism as a probe. Drug Metab Dispos. 1995;23:1339–46. [PubMed] [Google Scholar]