Abstract
The recruitment of a gene to a foreign regulatory system is a major evolutionary event that can lead to novel phenotypes. However, the evolvability potential of cells depends on their ability to cope with challenges presented by gene recruitment. To study this ability, we combined synthetic gene recruitment with continuous culture and online measurements of the metabolic and regulatory dynamics over long timescales. The gene HIS3 from the histidine synthesis pathway was recruited to the GAL system, responsible for galactose utilization in the yeast S. cerevisiae. Following a switch from galactose to glucose—from induced to repressed conditions of the GAL system—in histidine-lacking chemostats (where the recruited HIS3 is essential), the regulatory system reprogrammed to adaptively tune HIS3 expression, allowing the cells to grow competitively in pure glucose. The adapted state was maintained for hundreds of generations in various environments. The timescales involved and the reproducibility of separate experiments render spontaneous mutations an unlikely underlying mechanism. Essentially all cells could adapt, excluding selection over a genetically variable population. The results reveal heritable adaptation induced by the exposure to glucose. They demonstrate that genetic regulatory networks have the potential to support highly demanding events of gene recruitment.
GENE recruitment—the placement of a gene under a foreign regulatory system—develops either by mutations in existing promoters or by insertions of regulatory sequences into new loci (Davidson 2001; Wilkins 2002). Such reorganization of a preexisting regulatory network can lead to an increase in genomic and phenotypic complexity and is recognized as a major driving force in the evolution of developmental systems (Carroll et al. 2001; Davidson 2001; True and Carroll 2002; Wilkins 2002; Carroll 2005). However, the evolvability potential of cells (Gerhart and Kirschner 1997; Kirschner and Gerhart 1998) depends on their ability to cope with challenges presented by gene recruitment. In particular, cellular physiology should be able to support such events, realizing successful phenotypes from the novel genotype at intermediate times before its fixation in the population. Despite the central role of gene recruitment in evolution, direct experimental studies of cellular responses to rewiring of regulatory circuits have been lacking.
As a step toward this end, we propose an approach in which an event of gene recruitment is synthetically induced, mimicking the natural evolutionary event, and the capacity of cells to evolve in different environments is then measured. Cellular responses to genetic perturbations generally involve a wide range of timescales (Gasch et al. 2000; Causton et al. 2001; Braun and Brenner 2004) and depend on the environment; we therefore study them in cell populations over long times under controlled conditions. Microorganisms grown in continuous cultures (chemostats) are an ideal prototype system for such studies (Novick and Szilard 1950; Paquin and Adams 1983; Saldanha et al. 2004).
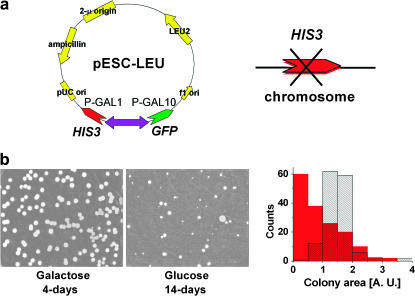
Evolutionary gene recruitment can result in a linkage between arbitrary genes and regulatory elements. Here, we engineered a synthetic circuit that couples histidine synthesis to galactose utilization in the yeast Saccharomyces cerevisiae. The essential gene HIS3 was entirely deleted from its natural position and placed under GAL regulation(Johnston and Carlson 1992; Lohr et al. 1995; Jayadeva and Murthy 2001), together with a gfp reporter (Figure 1a) (Li et al. 2000; Braun and Brenner 2004). The recruitment of HIS3 to the GAL system presents serious challenges to the cell in histidine-lacking environments: in pure galactose, the GAL system must simultaneously support regulation of two metabolic tasks, galactose utilization and histidine biosynthesis. In pure glucose, on the other hand, HIS3 is repressed (Johnston et al. 1994; Carlson 1999). The dynamic range of the GAL system (1000-fold) (Johnston and Carlson 1992; Johnston et al. 1994; Carlson 1999; Biggar and Crabtree 2001) is much wider than that of the amino acid regulation (a few fold)(Hinnebusch 1992; Struhl and Davis 1981), so HIS3 can be over- or underexpressed beyond its normal levels. Moreover, the recruited HIS3 is detached from its natural feedbacks, limiting its response to relevant inputs (Hinnebusch 1992).
Figure 1.
Construction of the GAL-HIS3 recruitment circuit. (a) The plasmid carrying the HIS3 ORF and gfp under the divergent promoter pGAL1–pGAL10, respectively. (b) Comparison of colonies grown on plates lacking histidine with galactose (first colonies after 2–3 days, saturation after 4 days) and glucose (first colonies after ∼6 days, image at day 14 showing ∼40% of the colonies on galactose). The histograms show colony size distributions for the galactose (patterned) and glucose (red) plates. Comparing the number of colonies on galactose and glucose plates shows that given enough time essentially all cells can develop visible colonies on glucose plates. Colonies first grown on a glucose plate and further distributed on a new glucose plate grew fast (colonies observed after 2 days) and with a normal size distribution (as in Figure 7).
Using this synthetic gene recruitment, we have studied how the cells cope with the challenges presented by the linkage made between the histidine biosynthesis pathway and the GAL regulatory system. We have constructed an experimental setup that combines the technique of continuous culture with online simultaneous measurements of the metabolic and regulatory dynamics at high temporal resolution. We focus here on the short to intermediate timescales (up to ∼100 generations) of the dynamics following an environmental switch. At these timescales, before spontaneous mutations intervene, the dynamics reflect mainly the physiological responses of the cell population.
MATERIALS AND METHODS
Plasmid and strain constructions:
All experiments were carried out with the haploid yeast strain YPH499 (MATa, ura3-52, lys2-801, ade2-101, trp1-Δ63, his3Δ200, leu2Δ1) carrying the plasmid vector pESC-LEU (Stratagene, La Jolla, CA) containing the pGAL1–pGAL10 divergent promoter (Braun and Brenner 2004). his3Δ200 is a deletion that removed the entire HIS3 coding region plus the upstream promoter region, including the Gcn4 regulatory site (it spans from −205 to 835 bp relative to the start of the ORF, see Brachmann et al. 1998). This deletion was verified by sequencing the genomes of cells from various parts of our experiments. Thus, in our strain there is no possibility for HIS3 to revert to its natural control. Cloning was done by standard methods in two steps: GFPS65T under pGAL10 (BglII–gfp–NotI) (Braun and Brenner 2004) and HIS3 ORF (PCR on S288C genomic DNA, 723 bp; −25 bp upstream of ATG) under pGal1 (ApaI–HIS3–XhoI). Cloning was confirmed by fragments analysis and by direct sequencing. Transformation was done with the lithium acetate method followed by selection on synthetic dropout plates with 2% galactose and without leucine and histidine. The transformed cells showed the same number of colonies after 4 days on galactose plates with 0 or 5 mm 3-amino-1,2,4-triazole (3AT), but no colonies with 100 mm 3AT. No colonies were observed after 4 days on glucose plates, irrespective of the level of 3AT.
Mating experiments:
Haploid cells (YPH499) harvested from the chemostat, after glucose steady state was established, were mixed with haploid cells of MATα type but with otherwise the same genome (YPH500). The latter cells were marked with TRP1. Mating was done in galactose medium supplemented with all amino acids followed by selection of diploids on plates lacking tryptophan and leucine. The diploid cells were grown in a galactose medium lacking histidine and the same amounts of cells were plated, after washing, on galactose and glucose plates lacking histidine. As a control, diploid cells made by mating two naive haploids that had not been previously exposed to glucose were also grown on galactose and glucose plates for the same period of time. Sporulation was induced in a liquid medium (10 g/liter potassium acetate, 1 g/liter yeast extract) and tetrad dissection was done on galactose plates lacking leucine and histidine.
Growth conditions and chemostat:
Cells were grown in chemostats in synthetic dropout medium lacking histidine and leucine with the appropriate amino acid supplement and 2% of either pure galactose or pure glucose as a sole carbon source. Throughout the experiments, the sugar (either galactose or glucose) is always in excess (maximal consumption of the cells is 25% of the sugar feeded—2%). Medium was: 1.7 g/liter yeast nitrogen base without amino acids and ammonium sulfate, 5 g/liter ammonium sulfate, 1.4 g/liter amino acids dropout powder (without tryptophan, histidine, leucine, and uracil; Sigma, St. Louis), 0.01 g/liter l-tryptophan, and 0.005 g/liter uracil. The growth in the chemostat was limited by the concentration of the amino acid supplement [verified by increase in stationary cell density in batch culture with increasing concentrations of amino acids within the relevant range and in chemostats by the steady-state optical density (OD) dependence on their concentrations]. The chemostat was inoculated with cells from a single colony on an agar plate, grown to exponential phase in a medium similar to the chemostat medium. When needed, appropriate amounts of the competitive inhibitor 3-amino-1,2,4-triazole (Sigma), sterilized by filtration, were introduced into the feeding medium. Plates were made with a similar medium composition with 0.04 g/liter l-tryptophan, 0.02 g/liter uracil, 2% sugar, and 2% agar. The cells were distributed uniformly on the plates by shaking with pretreated sterile glass beads.
The home-made chemostat had a 130-ml working volume and all experiments were done at a dilution rate of 0.14 hr−1 (controlled by a digital peristaltic pump; Ismatec). Temperature was stabilized at 30° and the culture was continuously mixed while air was pumped into the growth chamber. A typical population in the chemostat contained 109–1010 cells (1 OD600 ∼ 3 × 10⁷ cells/ml). The turbidity and the fluorescence level of the culture were monitored continuously online. The OD at 600 nm was measured by a dedicated spectrophotometer (Ocean Optics, Dunedin, FL) coupled optically to a flow channel at the chemostat outlet (light source: tungsten lamp). The fluorescence signal was measured in a flow cuvette on the same flow line using a photomultiplier and a diode light source with excitation/emission (excitation, 488 nm; emission, 510–530 nm) filters. The medium was bleached by exposure to light prior to use, reducing its background fluorescence, which was subtracted from the measurements. A computerized valve was used to control alternating sessions of a water-wash period (serving also as a baseline reference) and a measurement period on the chemostat culture. A calibration curve based on comparison between the OD online measurements with static, offline diluted samples measurements (Lambda-Bio40 spectrophotometer; Perkin-Elmer, Norwalk, CT) was used to correct the measured OD (up to OD ∼ 0.7 measurements on and off line were similar). The online OD was occasionally checked by offline measurements. Cells from the chemostat were collected and instantaneously frozen at precise time points along the experiments by a home-made cell collector. Cells from the chemostat were occasionally harvested and placed under the microscope for single-cell measurements of fluorescence distributions and cell-size inspection (Braun and Brenner 2004).
mRNA measurements using real-time PCR:
Total RNA was prepared by phenol extraction followed by cDNA preparation [oligo(dT)16; TAQMAN reverse transcription kit; Applied Biosystems, Foster City, CA). Real-time PCR measurements were performed with AB 7700 (SYBR master mix, Applied Biosystems). A set of designed primers (Primer Express, Applied Biosystems) was verified to work with uniform efficiency and led to the same quantitative results by using calibrated genomic DNA (Braun and Brenner 2004). Measured amounts of ACT1 prepared by PCR served as a ruler. In all measurements a nontemplate control for each of the primer pairs resulted in at least two orders of magnitude lower signal. All measurements were normalized by the ACT1 transcription level measured in each sample as the other genes. The measurement of ADH1 served as a control. Each measurement was performed in duplicate in the same PCR run and in most cases also repetitively in two separate PCR measurements. The results reported are averaged over repetitions. Maximal errors were <3% in duplicates at the same PCR measurement and <15% between separate PCR measurements or separate RNA extraction samples from the same sample of cells.
RESULTS AND DISCUSSION
In a medium lacking histidine, where HIS3p is an essential enzyme, the linkage made between HIS3 and GAL rendered cell growth sensitive to the carbon source. On agar plates with pure galactose, uniform-size colonies appeared after 2–3 days, while in pure glucose the first colonies appeared only after 6 days. The ongoing appearance of more colonies in glucose resulted in their abnormally wide size distribution (Figure 1b). Given enough time, the same number of colonies grew on glucose and galactose plates, indicating that essentially all cells could adapt to glucose. This shows that the glucose colonies are not due to selection of a rare subpopulation. Population variability is manifested in the broad size distribution of colonies resulting from variations in cell adaptation time, but not in their ability to adapt. Plating cells from colonies first grown on glucose plates for a second time on glucose resulted in rapid (faster than on galactose) colony appearance, with a uniform size distribution, showing that the adapted state is stable.
To study the dynamics of this adaptation we grew a population of gene-recruited cells in continuous culture, switching the medium from galactose to glucose. We developed a chemostat that enables continuous online measurements of the OD (proportional to cell density) and fluorescence level from the reporter gfp. In addition, cell aliquots for offline analysis were automatically collected and instantaneously frozen at regular time intervals with high temporal resolution along the experiment. Under constant conditions, changes in OD in the chemostat imply metabolic changes in the cells (fitness changes), while the fluorescence measurements of the reporter gene follow directly the dynamics of gene regulation.
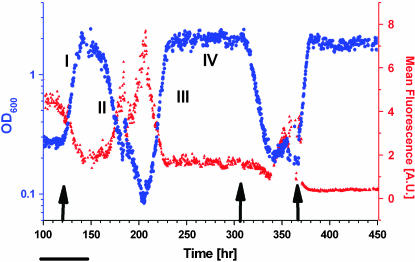
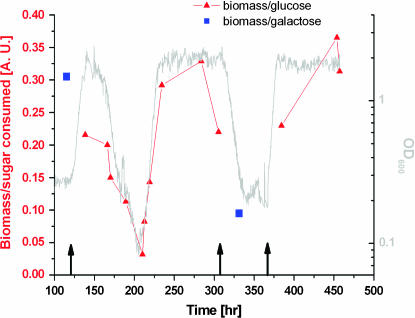
Figure 2 displays the chemostat dynamics following a medium switch from pure galactose to pure glucose (left arrow). The OD trace (blue curve) revealed distinct sequential phases of growth and metabolism: (I) an increase in cell density occurring over three to five generations; (II) a declining phase; (III) a second increase at a rate similar to that of phase I, starting after one to two generations in the lowest OD; and (IV) a steady-state plateau at roughly the same level as the peak of phase I. Throughout this time, the medium composition and the chemostat parameters were kept constant. Variations in glucose consumption per cell correlated with the OD (Figure 3), indicating corresponding changes in metabolic yield. The initial increase in cell density in phase I occurred while the GAL genes and HIS3 were glucose repressed (see below). The population, however, contained enough resources (e.g., histidine) to switch smoothly into glucose metabolism, characterized by a higher OD in the chemostat. In the next phase, once cells started to starve for histidine due to glucose repression, the population fitness decayed, causing a reduction in OD. The decay rate (0.09 hr−1) was smaller than the chemostat dilution rate (0.14 hr−1), indicating nonnegligible cell growth during this phase. Thus, adaptation of cells to the new environment initiated at the beginning of the declining phase; it continued during phase III until a high-OD steady state was established in phase IV, showing that the population became fully adapted to the new environment. The transient chemostat dynamics are consistent with the broad size distribution of colonies on a glucose plate (Figure 1b), whereas the steady state corresponds to the uniform-size colonies grown rapidly from cells already adapted to glucose.
Figure 2.
Adaptation dynamics in the chemostat stimulated by switching to glucose medium in a histidine-lacking chemostat. OD (blue) and mean fluorescence level (total fluorescence/OD, red) of a cell population are shown. The medium was switched from galactose to glucose at the left arrow, back to galactose at the middle arrow, and to glucose again at the right arrow. Exponential fits to the OD (in hours) are: (I) 6, (II) −11, (III) and 5.5; chemostat dilution time is 7 hr. Bar, 10 cell generations (generation time equals chemostat dilution time × ln 2 ∼ 5 hr).
Figure 3.
The biomass per sugar (glucose, red; galactose, blue) consumed during adaptive dynamics in the chemostat for the same experiment as in Figure 2. The sugar concentrations in the chemostat were measured at different time points along the adaptation process following medium switches: galactose to glucose (left arrow), glucose to galactose (middle arrow), and galactose to glucose (right arrow). Throughout the experiment, the sugar consumed by the cells is at most 25% of the amount fed into the chemostat (2%) so sugar (either glucose or galactose) is always in large excess. Samples harvested from the chemostat at different time points were centrifuged and the supernatant was separated. Sugar concentration was measured using the d-glucose or lactose/d-galactose kit according to the manufacturer's instructions (Scil Diagnostics, Martinsried, Germany). The results shown are the average over duplicate measurements with maximal error of 7%. The sugar consumed is the difference between the measured sugar concentration in the feeding medium and that in the chemostat. The measured OD (proportional to cell density in the chemostat, plotted in gray) divided by the sugar consumed is plotted. The cell density (OD) in the chemostat is determined by the ability of the cells to convert limiting nutrient to biomass (yield with respect to limiting nutrient). This, in turn, is determined by the overall cell metabolism, in particular sugar consumption. Thus, changes in OD in the chemostat largely reflect changes in metabolic yield of the cells.
Switching the medium back to galactose (Figure 2, middle arrow) and then again to glucose (Figure 2, right arrow) showed that the OD and gfp expression reached their steady-state levels following the second medium switch to glucose without going through the transient adaptation trajectory. This indicates that the population has “memorized” its previous adapted state (Kacser and Small 1996; Acar et al. 2005).
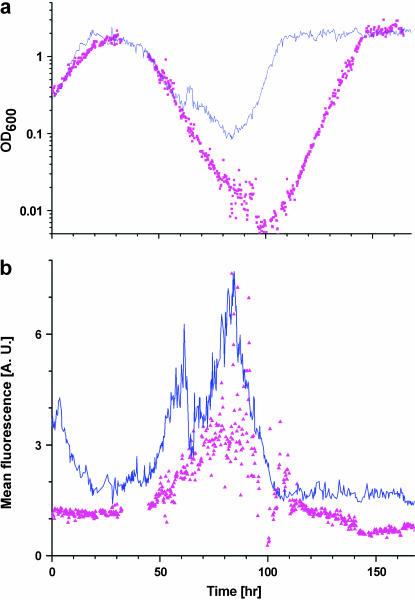
The results of Figures 1 and 2 show that the population adapted to overcome the challenges posed by recruiting HIS3 to GAL regulation under glucose. What are the robust features of the population dynamics in the adaptation process? To investigate this point, we repeated the experiment shown in Figure 2 and compared the dynamics of the different repeats. Figure 4 shows that the initial exponential decay of the population, exponential increase in the density of the adapted population, and final OD steady-state level are all robust features of the dynamics and appear similarly in repeated experiments. On the other hand, the exact turning point of the population OD and the adaptation time depend on history. The adaptation timescale of ∼10 generations revealed by the chemostat and the reproducibility of the adaptation dynamics in separate experiments show that spontaneous mutations played no significant role in this phenomenon (Marini et al. 1999).
Figure 4.
Repetition of population dynamics in separate experiments. The same experiment as in Figure 2 was repeated to distinguish between robust features and specific history-dependent ones. The blue curves are the results of the experiment in Figure 2 and the magenta points are the repeated experiment under the same conditions. (a) OD and (b) mean fluorescence level of the populations of cells in the chemostat are shown. The medium was switched from galactose to glucose at t = 0. The initial exponential decay of the population, the exponential increase in the density of the adapted population, and the final OD steady-state level are all robust features of the dynamics, while the exact turning point of OD and adaptation time depend on history. The fluorescence signal shows robust bursts of activity during adaptation in the decay phase.
We next focused on characterizing the regulatory dynamics during the adaptation process. The online gfp fluorescence measurement (Figure 2, red curve) showed bursting activity during the adaptation period (phase II). Similar bursts appear in repeated experiments (Figure 4b), showing that this is a robust property of the dynamics.
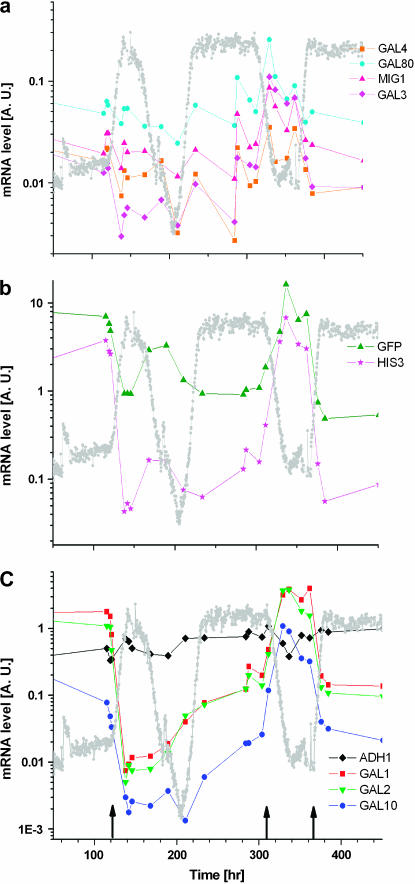
Figure 5 depicts direct measurements of mRNA levels of various genes by real-time PCR. All the GAL genes together with HIS3 and gfp exhibited immediate repression upon the medium switch to glucose, as expected from genes under GAL regulation. Following the transient repression these genes exhibited adaptation to higher levels at times corresponding to the population's OD recovery. After this increase, the expression level of HIS3 was once again reduced (compare the expression levels in phases III and IV of the OD dynamics shown in Figures 2 and 5). The reason for this reduction was overexpression of HIS3 in glucose, once the GAL system recovered from glucose repression (as observed in the expression of the GAL structural genes in the same phases, Figure 5). The ability of the cells to tune the precise expression of HIS3 enabled them to overcome this overexpression challenge. This result implies that adaptation involved the emergence of a feedback between the metabolic requirements, determined by the histidine pathway, and the regulatory module controlled by the GAL system (see further discussion of this point below in relation to Figure 9).
Figure 5.
Real-time PCR measurements of the mRNA expression levels for the same experiment as in Figure 2. (a) Regulatory genes of the GAL system and MIG1, (b) gfp and HIS3, and (c) structural genes of the GAL system and ADH1 control are shown. The mRNA expression levels are normalized by the expression of ACT1. The y-axis is logarithmic. The arrows mark the points of medium switch: galactose to glucose (left arrow), glucose to galactose (middle arrow), and galactose to glucose (right arrow). The gray curve is the OD trace of the population. Note that the regulatory genes (including MIG1) do not follow the same kinetics as the GAL structural genes. Also, after the second transition from galactose to glucose, the mRNA levels are immediately adapted to the new environment.
Figure 9.
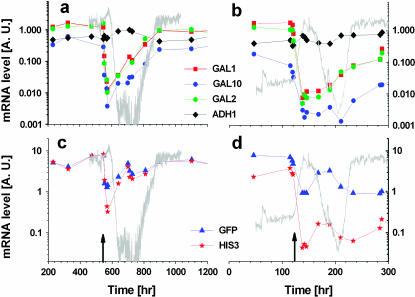
mRNA levels during adaptation. Real-time PCR was used to quantify the mRNA expression level as a function of time, for the two chemostat experiments switching from galactose to glucose (Figures 2 and 6). The structural GAL genes and ADH1 control, for (a) 40 mm 3AT and (b) no 3AT. gfp and HIS3 and for (c) 40 mm 3AT and (d) no 3AT are shown. All mRNA levels are relative to the level of ACT1 in the same sample. Note the logarithmic scale. The gray traces in the background depict the OD levels in the chemostat and the arrows mark the time of switching from galactose to glucose.
These measurements show that the adaptive regulatory dynamics involved many genes exhibiting different kinetics. Thus, adaptation is not a feature of HIS3 alone but a global phenomenon involving genes under GAL regulation residing on different chromosomes. As a control, the expression of ADH1 is shown to be approximately constant, proving that the dynamics in the GAL-regulated genes were not a result of global metabolic changes. Interestingly, the GAL module itself broke up into two groups of genes with different transcriptional kinetics: structural and regulatory (compare Figure 5a with 5c). Recall that at the second cycle of medium switch, to galactose and back to glucose (Figure 5, middle and right arrows), the population memory of glucose adaptation led to an instantaneous increase of the OD to its steady-state value. Figure 5 shows that underlying this memory is regulatory dynamics: all genes (gfp, HIS3, and native GAL genes) instantaneously expressed their glucose steady-state mRNA levels upon the second medium switch. We conclude that the nature of the adaptation is essentially regulatory.
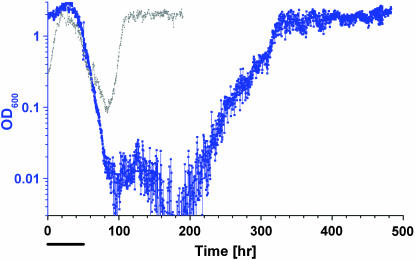
An important characteristic of adaptation is its sensitivity to environmental pressure. With the recruited HIS3, we can control the level of environmental pressure by introducing 3AT, a competitive inhibitor of HIS3p (Horecka and Sprague 2000). Figure 6 displays the population densities following a galactose–glucose medium switch (t = 0), with 40 mm 3AT and without 3AT (as in Figure 2). The dynamics followed the same phases but the timescale of adaptation increased with environmental pressure. The mean gfp fluorescence also followed the same phases as those without 3AT (data not shown).
Figure 6.
Adaptation dynamics in a chemostat with 3AT. OD (blue) in a chemostat with 40 mm 3AT is shown. After the population stabilized in galactose with 40 mm 3AT, the medium was switched (t = 0) from galactose to glucose with the same amount of 3AT. The measured exponent of OD change at the declining phase: −9 hr. The gray trace depicts the trajectory of the experiment with no 3AT (the same as in Figure 2). Bar, 10 cell generations.
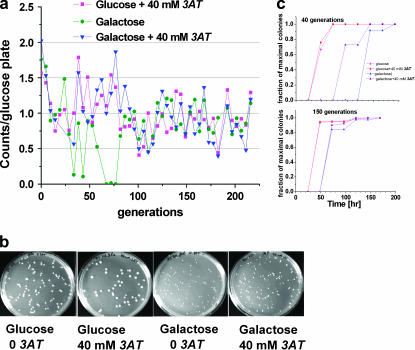
The results presented so far show that the adapted state was memorized in the population for many generations. To further characterize the stability of the adapted state, we switched the chemostat back to galactose, harvested samples along time after the medium switch, and compared their growth on glucose and galactose plates. Figure 7a shows the counts of colonies on various plates as a function of chemostat generations, starting from the medium switch to galactose at t = 0. Following transient changes, the plates stabilized at similar colony counts in all media. Figure 7b shows typical images of the various plates exhibiting very similar uniform colony characteristics. Figure 7c shows that after the transient response the kinetics of colony growth were similar in galactose and glucose plates. These results show that the adapted state, characterized by rapid growth of uniform-size colonies on glucose plates, with or without 3AT, was maintained in the chemostat for 220 generations after switching it back to galactose. The stability of the adapted state was also maintained, for the same number of generations, in serially diluted batch cultures with various media, including galactose without 3AT, galactose plus histidine, and glucose plus histidine (data not shown). Note that the growth of wild-type cells is strongly inhibited at this level (40 mm) of 3AT (Kanazawa et al. 1988). These experiments show that the adapted state, once established, is a stable cell state with well-defined characteristics and metabolism distinguished from the native state before the exposure to glucose. Moreover, while the environmental switch to glucose is necessary to trigger a transition to the adapted cell state, once this state is established the environmental stimulus (glucose) is not required anymore to maintain the new state.
Figure 7.
Maintenance of the adapted state in the chemostat. The population from the experiment described in Figure 6, after stabilizing in the chemostat in glucose plus 40 mm 3AT, was switched to galactose plus 40 mm 3AT and maintained in this medium. Following a short transient period, the OD and fluorescence levels of the population in the chemostat were stable throughout the experiment (>220 generations). Each day, cells were harvested from the chemostat, washed, and the same amount of cells from each sample was distributed on four different plates (see materials and methods for plate preparation): glucose, glucose + 40mm 3AT, galactose, and galactose + 40mm 3AT. (a) The number of colonies on the different plates at saturation, relative to the number on glucose plates, as a function of chemostat generations (computed from the chemostat dilution rate, 1 generation ∼ 5 hr; 0 = medium switch to galactose in the chemostat). After a transient period, the number of colonies was approximately the same for all plates. During the initial transient period (first 70–80 generations) galactose plates exhibited the highest fluctuations (the zero counts were verified to be real, by growing reference cells on the same plates after enough time of no observed colonies from the original plating). (b) Images of different plates. Note the uniform-size colonies on glucose plates, in contrast to the broad size distribution of colony size for nonadapted cells (Figure 1b). (c) Kinetics of colony growth on plates during maintenance of the adapted state. a describes the saturated number of colonies counted on different media. Here, the kinetics of colony growth (fraction of colonies from saturated value as a function of hours from plating) on the different plates were measured for two chemostat time points. Note the change in kinetics between these two times. For comparison, note that the kinetics of colony growth of nonadapted cells (Figure 1b) are different; there, colonies grew faster on galactose plates than on glucose plates and reached saturation in a shorter time than the one observed here.
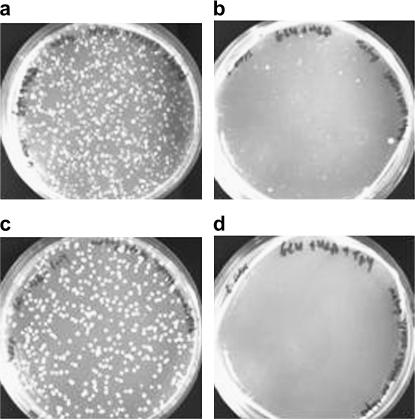
Given the strong stability of the adapted state, we asked whether there is a way to reset this state. To explore this possibility, we generated diploid cells by mating between haploid cells harvested from the chemostat in the glucose steady state (phase IV in Figure 2) and naive haploid cells of the opposite type. Figure 8, a and b, shows typical results of growing these diploid cells on plates lacking histidine with galactose and glucose, respectively. Colonies appeared on glucose plates after 3–4 days (Figure 8b) with slower growth rates than on galactose. Only a fraction of the diploid cells were fully adapted to glucose. This situation is in between the one observed in Figure 1b for nonadapted cells, where a significant number of colonies appeared only after 14 days, and the one shown in Figure 7 for fully adapted cells, where colonies on glucose plates grew faster than on galactose plates. The growth on galactose remained the same as for the haploid cells (Figure 8a). The diploid cells after mating were clearly sensitive to the carbon source, a hallmark of the GAL system. Thus, in these cells the control of HIS3 is under GAL in precisely the same manner as before. As a control, Figure 8, c and d, shows, respectively, galactose and glucose plates of diploid cells generated by mating two naive haploids that had not been previously exposed to glucose, grown for the same period of time as in Figure 8, a and b. The growth of the nonadapted diploids resembled that of the naive haploid cells exposed to glucose for the first time on the plate, as in Figure 1b. These results show that the partial adaptation observed for these diploid cells generated by mating with an adapted haploid was not a result of the mating action itself or a property of a naive diploid, but rather the partial propagation of the adapted state from the haploid to the diploid. Adaptation is not complete for the diploid cells, since mixing adapted and naive genomes seems to “dilute” the adaptation capability of the cells. Thus, the adaptation to glucose following gene recruitment is a quantitative phenomenon in nature rather than an “all or none” qualitative one. Interestingly, growing diploid cells from colonies grown on glucose plates for the second time on glucose shows that these diploids were fully adapted and grew uniformly and faster than on galactose. Thus, the partial adaptation observed after mating is not because of the diploid nature of cells, but caused by the presence of the naive genome.
Figure 8.
Growth of diploid cells. Diploid cells, generated by mating an adapted cell from the glucose steady-state chemostat (Figure 2, phase IV) and a naive cell of the opposite type, were plated on (a) galactose and (b) glucose plates lacking histidine. The image was captured after 5 days of growth. Note that the diploid cells partially lost their adaptive state; some colonies appear early while others need to recover on the glucose plate as in Figure 1b for naive cells. The diploid cells grew on galactose plates exactly as the haploid cells. As a control, diploid cells made by mating two naive haploids that had not been previously exposed to glucose are grown for the same period of time on (c) galactose and (d) glucose plates. Note the difference between b and d, showing that the adapted state can partially propagate after mating and that adaptation is a quantitative phenomenon in nature.
The diploid cells generated by mating between an adapted haploid and a naive one could be sporulated and the progeny spores analyzed by tetrad dissections. The adaptation phenotype could propagate through meiosis. Tetrad analysis showed that the adaptation phenotype segregated in a 2:2 fashion: two of the progeny spores exhibited strong adaptation, growing on glucose plates like fully adapted haploids, while the other two exhibited partial adaptation similar to that of the diploid cells exposed to glucose for the first time (∼10 tetrads were analyzed, all exhibiting this behavior). The partial adaptation in two of the spores remained even after a long propagation in galactose medium, showing that it was not due to factors acquired in the diploid state. The 2:2 segregation shows that the mechanism responsible for the stabilization of the adapted phenotype is connected to the genome (by either a genetic or an epigenetic process) and is probably strongly affected by a single locus (see the discussion below). It also shows that the initially naive genome used to generate the diploid did not remain completely naive; the presence of the adapted genome in the same diploid caused a partial imprint of the adaptation capability on it.
We now examine in more detail the gene expression and regulatory dynamics following a switch from galactose to glucose. Figure 9 compares the mRNA levels for the two experiments with and without 3AT inhibition (Figures 2 and 6). The GAL structural genes (Figure 9, a and b) exhibited strong transient repression in response to glucose, followed by long-term recovery to a higher expression level. With 40 mm 3AT (Figure 9a), the GAL genes were eventually expressed at similar levels in galactose and glucose. This is consistent with our previous observation of long-term derepression of the GAL system in glucose without the HIS3 recruitment (Braun and Brenner 2004). The recruited HIS3 and reporter gfp exhibited strikingly similar expression levels and followed the same dynamics as the GAL structural genes (Figure 9c). By contrast, at reduced environmental pressure in the absence of 3AT, HIS3 and gfp differed in their mRNA levels and did not follow the behavior of the other GAL genes (Figure 9d). Moreover, the ratio between HIS3 and gfp mRNA levels did not correlate with the ratio of the natural GAL1 and GAL10, although both pairs of genes have identical promoters. Sequencing revealed that the promoter region, pGAL1–pGAL10, controlling HIS3 and gfp, remained intact throughout the experiments with or without 3AT. These results suggest that the cells dynamically tuned HIS3 expression under GAL regulation according to the metabolic requirements. Thus, although the transcription of HIS3 has been detached from its wild-type control system, the gene-recruited cells were able to reprogram (Kafri et al. 2005) the regulation network to tune HIS3 expression in response to environmental demands.
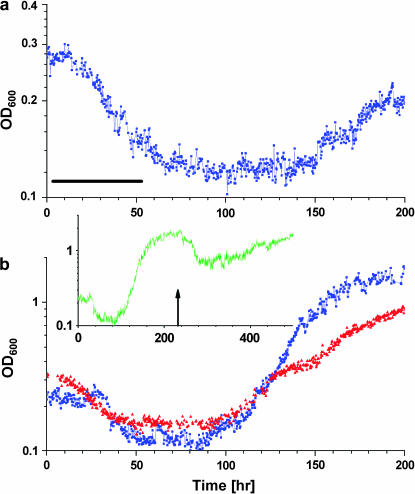
One of the challenges in recruiting HIS3 to the GAL system is multitasking in pure galactose medium, where both galactose utilization and histidine biosynthesis need to be supported. We therefore studied how the presence of the HIS3p inhibitor affects the population dynamics in galactose. Figure 10 shows that introduction of 3AT in pure galactose also led to adaptive dynamics; following a reduction in the population density in the chemostat (reduced cell fitness) and a period of stable density, the population exhibited adaptive recovery. Once again the adaptation characteristic timescale increased with environmental pressure (3AT concentration, compare Figure 10a with 10b). Below a threshold (∼45 mm 3AT) the population reached a final steady-state OD higher than the one prior to the introduction of 3AT. At this level of inhibition, cells could develop a better-fitted metabolic state since overexpression of HIS3 caused by the GAL system in galactose is compensated. The timescales (10–20 generations) and reproducibility of separate experiments (see Figure 10b) suggest again that the adaptation process was nongenetic. Interestingly, removal of the inhibitor after the establishment of the adapted state led to a transient decrease in OD followed by reestablishment of the same steady state (Figure 10b, inset), demonstrating that the adapted state was homeostatically stable. As before, once the cells established an adapted state following the environmental trigger, the presence of the stimulation is not required to maintain the new state.
Figure 10.
Response to HIS3p inhibition in galactose. (a) OD in a chemostat with pure galactose medium and no histidine. At t = 0 the medium was supplemented with 50 mm 3AT. Bar, 10 cell generations. (b) The same as in a but with 30 mm 3AT. Note that after adaptation in b, cell density is higher than the original one. The red curve shows a duplicate experiment under the same conditions. Inset: a longer trace of the same experiment as in b. 3AT was removed at the arrow. Note that the adapted state is homeostatically stable; the OD is attracted back to its adapted steady state after a short transient period.
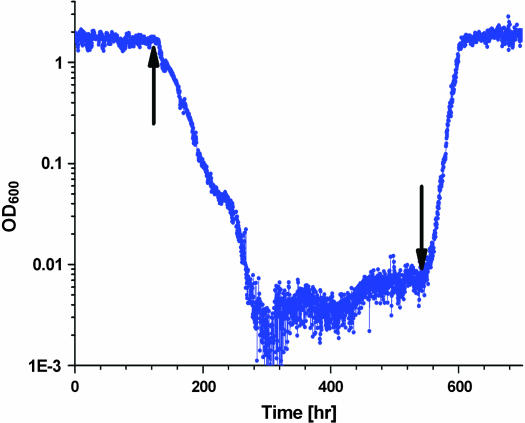
Expression relying on GAL regulation may suggest that galactose is the optimal growth medium (Johnston and Carlson 1992; Lohr et al. 1995). However, this is not necessarily true when the GAL system is required to regulate both sugar metabolism and amino acid biosynthesis. Figure 11 compares the ability of galactose and glucose to support growth under increasing load. The population, adapted to glucose with 80 mm 3AT (exhibiting the same OD as with glucose and 40 mm 3AT, Figure 6), strongly declined in density when switched into galactose (with 80 mm 3AT, left arrow). The same population recovered to the initial density following a medium switch back to glucose (right arrow). Thus multitasking, a natural consequence of gene recruitment, not only opens novel opportunities but also sets new constraints on cell physiology.
Figure 11.
Effect of multitasking in a gene-recruitment circuit. A pure glucose medium with 80 mm 3AT supported a steady-state culture at high OD (the population exhibited the same OD as with glucose and 40 mm 3AT, see Figure 6). The cell population collapsed upon switching the medium to galactose (+80 mm 3AT, left arrow) and recovered when switching back to glucose (+80 mm 3AT, right arrow).
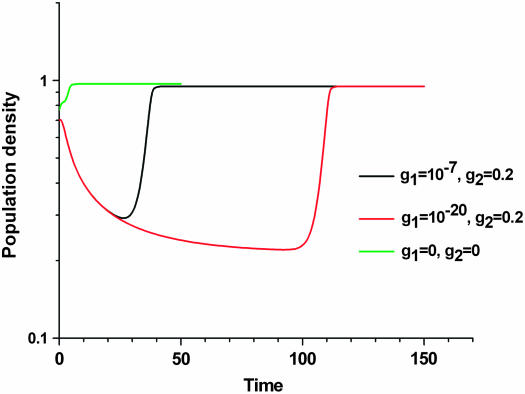
Integrating all the dynamic features of our experiments into a chemostat model of two subpopulations shows that a large fraction of adapted cells at the moment of a medium switch is inconsistent with both a long adaptation period and a fast exponential increase in cell density (see Figure 12). Thus, as explained before, selection of a preadapted subpopulation is unlikely in the experiments presented here. The experiments, however, are consistent with a model of an ongoing phenotypic transition of cells into a better-fitted metabolic state, the rate of which strongly affects the adaptation time.
Figure 12.
 |
 |
 |
Recruiting the HIS3 gene to the GAL system sets severe functional challenges to cell physiology. We have shown that under competitive conditions in a chemostat, the cells adapt fast enough to maintain histidine biosynthesis, supporting cell growth under different environmental constraints, and that this adaptation is sustained for many generations. The mechanism leading to the inherited adapted state is not known yet. The results exclude spontaneous mutations and selection of a rare subpopulation as possible sources of the phenomenon. They open the possibility that adaptation is nongenetic, implying an underlying epigenetic mechanism of inheritance(Pal and Miklos 1999; Rutherford and Henikoff 2003; Sollars et al. 2003; Jablonka and Lamb 2005). The partial reset of the adapted state after mating and the sensitivity to the carbon source show that the phenomenon was not likely to result from genetic stabilization of a new HIS3 regulation, bypassing our imposed GAL regulation. The strain used in our experiments contains the his3Δ200 deletion, which removed the entire HIS3 coding region and its upstream promoter, including the Gcn4 regulatory sequence, making it impossible for HIS3 to revert to its natural control.
This article is focused on the phenomenology of adaptation following a gene recruitment event. It paves the way for a program allowing us to eventually identify the mechanism behind the inherited adaptation. In particular, two crucial experiments are required: first, measuring the genomewide gene expression patterns in correlation with the adaptation dynamics and second, genomic mapping of the DNA locus (or loci) relevant for the observed phenotype. We discuss now these two complementary directions.
Adaptation is essentially regulatory and involves many genes residing on different chromosomes. The entire GAL module responded according to the requirements of the histidine pathway, tuning the foreign HIS3 gene in a precise way. This result reveals that a novel intermodular feedback has been established, affecting the GAL module and presumably involving other functional modules. To identify the set of genes involved in stabilizing the adaptation phenotype, genomewide patterns of expression correlated with the adaptation dynamics in the continuous culture will be measured. This can be done using DNA microarrays containing the complete set of the yeast ORFs, hybridized with the reverse-transcribed mRNAs extracted from cells collected at precise time points along the adaptation trajectory in the chemostat. By clustering the expression levels in correlation with the adaptation dynamics, we hope to be able to identify groups of genes relevant to adaptation and to expose the intermodular interactions responsible for the regulatory dynamics.
Adaptation is partially lost when a diploid cell is generated by mating an adapted haploid cell with another naive haploid cell; adaptation is therefore a quantitative phenomenon in nature. On the other hand, the well-defined phenotype of fast uniform growth on glucose of the gene-recruited HIS3 cells segregated in a 2:2 ratio through sporulation and meiosis; two of the progenies exhibited strong adaptation while the other two behaved similarly to the diploid cell, exhibiting partial adaptation. This result proves that the inherited adaptation is strongly connected to processes involving the genome (but still can be of genetic or epigenetic origin) and suggests that the phenomenon is strongly affected by a single locus. This locus can be identified by genomewide mapping (Steinmetz et al. 2002). The technique is based on generating a diploid cell by mating the adapted haploid with another polymorphic naive strain and correlating the adaptation phenotype of the spores with genomic markers, using hybridization of the total genomic DNA to microarrays. Once the locus is identified, the mechanism of adaptation could be correlated with the relevant DNA sequences and possible epigenetic mechanisms (e.g., histone states) there.
We still do not know how general the adaptation phenomenon observed in our experiments is, but our choice of HIS3 was arbitrary; histidine biosynthesis is an ancient conserved and highly regulated pathway (Fani et al. 1998), connected to many other subsystems (Alifano et al. 1996). It demonstrates the plasticity of gene regulation and that cells have the potential to physiologically support complex events of gene recruitment. The approach and technology presented in this work provide a step in making gene recruitment the subject of experimental investigation, promising to extend our understanding of genetic regulatory systems and their evolution.
Acknowledgments
We thank Shay Stern and Tamar Friedlander for useful discussions and Kinneret Keren and Yoav Soen for remarks on the manuscript. We thank Martin Kupiec and Daniel Kornitzer for their help with tetrad dissections. This research was partially funded by the Israel Science Foundation, the Center for Complexity Science (Yeshaya Horowitz Association), and the German–Israeli Foundation for Scientific Research.
References
- Acar, M., A. Becskel and A. v. Oudenaarden, 2005. Enhancement of cellular memory by reducing stochastic transitions. Nature 435: 228–232. [DOI] [PubMed] [Google Scholar]
- Alifano, P., R. Fani, P. Lio, A. Lazcano, M. Bazzicalupo et al., 1996. Histidine biosynthetic pathway and genes: structure, regulation, and evolution. Microbiol. Rev. 60: 44–69. [DOI] [PMC free article] [PubMed] [Google Scholar]
- Biggar, S. R., and G. R. Crabtree, 2001. Cell signaling can direct either binary or graded transcriptional responses. EMBO J. 20: 3167. [DOI] [PMC free article] [PubMed] [Google Scholar]
- Brachmann, C. B., A. Davies, G. J. Cost, E. Caputo, J. Li et al., 1998. Designer deletion strains derived from Saccharomyces cerevisiae S288C: a useful set of strains and plasmids for PCR-mediated gene disruption and other applications. Yeast 14: 115–132. [DOI] [PubMed] [Google Scholar]
- Braun, E., and N. Brenner, 2004. Transient responses and adaptation to steady state in eukaryotic gene regulation system. Phys. Biol. 1: 67. [DOI] [PubMed] [Google Scholar]
- Carlson, M., 1999. Glucose repression in yeast. Curr. Opin. Microbiol. 2: 202. [DOI] [PubMed] [Google Scholar]
- Carroll, S. B., 2005. Evolution at two levels: on genes and form. PLoS Biol. 3: 1159–1166. [DOI] [PMC free article] [PubMed] [Google Scholar]
- Carroll, S. B., J. K. Grenier and S. D. Weatherbee, 2001. From DNA to Diversity: Molecular Genetics and the Evolution of Animal Design. Blackwell Science, Oxford.
- Causton, H. C., B. Ren, S. S. Koh, C. T. Harbison, E. Kanin et al., 2001. Remodeling of yeast genome expression in response to environmental changes. Mol. Biol. Cell 12: 323–337. [DOI] [PMC free article] [PubMed] [Google Scholar]
- Davidson, E. H., 2001. Genomic Regulatory Systems, Development and Evolution. Academic Press, London.
- Fani, R., E. Mori, E. Tamburini and A. Lazcano, 1998. Evolution of the structure and chromosomal distribution of histidine biosynthetic genes. Origins Life Evol. Biosphere 28: 555–570. [DOI] [PubMed] [Google Scholar]
- Gasch, A. P., P. T. Spellman, C. M. Kao, O. Carmel-Harel, M. B. Eisen et al., 2000. Genomic expression programs in the response of yeast cells to environmental changes. Mol. Biol. Cell 11: 4241–4257. [DOI] [PMC free article] [PubMed] [Google Scholar]
- Gerhart, J., and M. Kirschner, 1997. Cells, Embryos, and Evolution. Blackwell Science, Oxford.
- Hinnebusch, A. G., 1992. General and pathway-specific regulatory mechanisms controlling the synthesis of amino acid biosynthesis enzymes in Saccharomyces cerevisiae, pp. 319–414 in The Molecular and Cellular Biology of the Yeast Saccharomyces: Gene Expression, edited by E. W. Jones, J. R. Pringle and J. R. Broach. Cold Spring Harbor Laboratory Press, Cold Spring Harbor, NY.
- Horecka, J., and G. F. Sprague, 2000. Use of imidazoleglycerophosphate dehydratase (His3) as a biological reporter in yeast. Methods Enzymol. 326: 107–119. [DOI] [PubMed] [Google Scholar]
- Jablonka, E., and M. J. Lamb (Editors), 2005. Evolution in Four Dimensions. MIT Press, Cambridge, MA.
- Jayadeva, P., and T. V. S. Murthy, 2001. Transcriptional control of the GAL/MEL regulon of the yeast Saccharomyces cerevisiae: mechanism of galactose-mediated signal transduction. Mol. Microbiol. 40: 1059. [DOI] [PubMed] [Google Scholar]
- Johnston, M., and M. Carlson, 1992. Regulation of carbon and phosphate utilization, pp. 193–281 in The Molecular and Cellular Biology of the Yeast Saccaromyces: Gene Expression, edited by E. W. Jones, J. R. Pringle and J. R. Broach. Cold Spring Harbor Laboratory Press, Cold Spring Harbor, NY.
- Johnston, M., J. S. Flick and T. Pexton, 1994. Multiple mechanisms provide rapid and stringent glucose repression of GAL gene expression in Saccharomyces cerevisiae. Mol. Cell. Biol. 14: 3834. [DOI] [PMC free article] [PubMed] [Google Scholar]
- Kacser, H., and J. R. Small, 1996. How many phenotypes from one genotype? The case of prion diseases. J. Theor. Biol. 182: 209–218. [DOI] [PubMed] [Google Scholar]
- Kafri, R., A. Bar-Even and Y. Pilpel, 2005. Transcription control reprogramming in genetic backup circuits. Nat. Genet. 37: 295–299. [DOI] [PubMed] [Google Scholar]
- Kanazawa, S., M. Driscoll and K. Struhl, 1988. ATR1, a Saccharomyces cerevisiae gene encoding a transmembrane protein required for aminotriazole resistance. Mol. Cell. Biol. 8: 664–673. [DOI] [PMC free article] [PubMed] [Google Scholar]
- Kirschner, M., and J. Gerhart, 1998. Evolvability. Proc. Natl. Acad. Sci. USA 95: 8420–8427. [DOI] [PMC free article] [PubMed] [Google Scholar]
- Li, J., S. Wang, W. J. VanDusen, L. D. Schultz, H. A. George et al., 2000. Green fluorescent protein in Saccharomyces cerevisiae: real-time studies of the GAL1 promoter. Biotechnol. Bioeng. 70: 187. [DOI] [PubMed] [Google Scholar]
- Lohr, D., P. Venkov and J. Zlatanova, 1995. Transcriptional regulation in the yeast GAL gene family: a complex genetic network. FASEB J. 9: 777. [DOI] [PubMed] [Google Scholar]
- Marini, N., N. Matmati and G. Morpurgo, 1999. Starvation in yeast increases non-adaptive mutation. Curr. Genet. 35: 77–81. [DOI] [PubMed] [Google Scholar]
- Novick, A., and L. Szilard, 1950. Experiments with the chemostat on spontaneous mutations of bacteria. Proc. Natl. Acad. Sci. USA 36: 708. [DOI] [PMC free article] [PubMed] [Google Scholar]
- Pal, C., and I. Miklos, 1999. Epigenetic inheritance, genetic assimilation and speciation. J. Theor. Biol. 200: 19–37. [DOI] [PubMed] [Google Scholar]
- Paquin, C., and J. Adams, 1983. Frequency of fixation of adaptive mutations is higher in evolving diploid than haploid yeast populations. Nature 302: 495. [DOI] [PubMed] [Google Scholar]
- Rutherford, S. L., and S. Henikoff, 2003. Quantitative epigentics. Nat. Genet. 33: 6–8. [DOI] [PubMed] [Google Scholar]
- Saldanha, A. J., M. J. Brauer and D. Botstein, 2004. Nutritional homeostasis in batch and steady-state culture of yeast. Mol. Biol. Cell 15: 4089–4104. [DOI] [PMC free article] [PubMed] [Google Scholar]
- Smith, H. L., and P. Waltman, 1995. The Theory of the Chemostat: Dynamics of Microbial Competition. Cambridge University Press, New York.
- Sollars, V., X. Liu, L. Xiao, X. Wang, M. D. Garfinkel et al., 2003. Evidence for an epigenetic mechanism by which Hsp90 acts as a capacitor for morphological evolution. Nat. Genet. 33: 70–74. [DOI] [PubMed] [Google Scholar]
- Steinmetz, L. M., H. Sinha, D. R. Richards, J. I. Spiegelman, P. J. Oefner et al., 2002. Dissecting the architecture of a quantitative trait locus in yeast. Nature 416: 326–330. [DOI] [PubMed] [Google Scholar]
- Struhl, K., and R. W. Davis, 1981. Transcription of the his3 gene region in Saccharomyces cerevisiae. J. Mol. Biol. 152: 535–552. [DOI] [PubMed] [Google Scholar]
- True, J. R., and S. B. Carroll, 2002. Gene co-option in physiological and morphological evolution. Annu. Rev. Cell Dev. Biol. 18: 53–80. [DOI] [PubMed] [Google Scholar]
- Wilkins, A. S., 2002. The Evolution of Developmental Pathways. Sinauer Associates, Sunderland, MA.


