Abstract
Stereoacuity thresholds, measured with bar targets, rise as the absolute disparity of the bars is increased. One explanation for this rise is that, as the bars are moved away from the fixation plane, the stereo system uses coarser mechanisms to encode the bars’ disparity; coarse mechanisms are insensitive to small changes in target disparity, resulting in higher thresholds. To test this explanation, we measured stereoacuity with a 6° wide 3 cpd grating presented in a rectangular envelope. We varied the disparity of the grating and its edges (envelope) parametrically from 0 to 20 arcmin (i.e., through one full period). To force observers to make judgments based on carrier disparity, we then varied the interocular phase incrementally from trial-to-trial while keeping edge disparity fixed for a given block of trials. The pedestal phase disparity of the grating necessarily cycles through 360° , back to zero disparity, as the edge disparity increases monotonically from 0 to 20 arcmin. Unlike mechanisms that respond to bars, the mechanism that responds to the interocular phase disparity of the grating should have the same sensitivity at 20 arcmin disparity (360° of phase) as it has at zero disparity. So, if stereoacuity were determined by the most sensitive mechanism, thresholds should oscillate with the pedestal phase disparity. However, these gratings are perceived in depth at the disparity of their edges. If stereoacuity were instead determined by the stereo matching operations that generate perceived depth, thresholds should rise monotonically with increasing edge disparity. We found that the rise in grating thresholds with increasing edge disparity was monotonic and virtually identical to the rise in thresholds observed for bars. Stereoacuity is contingent on stereo matching.
Keywords: Keywords: binocular vision, stereo matching, stereoacuity, stereopsis
Introduction
Stereoacuity thresholds rise exponentially as the absolute disparity of the target increases. This result has been obtained for stimuli as varied as bars and random dot displays (Ogle, 1953; Blakemore, 1970; Westheimer & McKee, 1978; Schumer & Julesz, 1984; Farell, Li, & McKee, 2004). One common explanation for this rise is that the stereo system employs different spatial scales as disparity increases (Marr & Poggio, 1979; Badcock & Schor, 1985; Lehky & Sejnowski, 1990; Smallman & MacLeod, 1997; Farell et al., 2004). Neurophysiological studies of disparity-selective neurons in primary visual cortex support this kind of explanation. Primate V1 neurons are tuned for absolute disparity (Cumming & Parker, 1999) and the disparity range of each neuron is related to the size of its receptive field (Prince, Cumming, & Parker, 2002). Fine-scale units respond to a small range of absolute disparities, whereas coarse-scale units respond to a larger range of absolute disparities.
Explanations of this type have been offered to account for two-dimensional hyperacuities, such as bisection acuity (Klein & Levi, 1985; Wilson, 1986). Typically, hyperacuity models assume that a shift in position will be detected if it produces a change in the response of the optimum filter that equals or exceeds some criterion. Detecting an incremental change in position depends on the same limitations as detecting an incremental change in contrast. Stereoacuity in the fixation plane is a hyperacuity, with the best thresholds being less than 10 arcsec. Therefore, a model based on spatial filters and contrast sensitivity functions could plausibly explain the general characteristics of stereoacuity thresholds. The disparity tuning functions of neurons selective to high spatial frequencies are steeper than those selective to low frequencies. So, a given change in disparity produces a larger response at a fine scale than at a coarse scale, provided that the absolute disparity of the target lies within the fine-scale range. Once the disparity exceeds this range, the stereo system must rely on ever-coarser scales, and these scales require larger disparity shifts to produce a criterion change in response. Thus, shifting from fine to coarse scales as absolute disparity increases could account for the increase in disparity thresholds. This type of model can undoubtedly explain stereoacuity for bar targets. In this study, we will explore whether this type of model can also handle stereoacuity for extended targets—in particular, sinusoidal gratings.
How does stereoacuity change with increasing disparity, if the target is a sinusoidal grating, instead of a bar? This may sound like a trick question. Assuming nearest-neighbor matching, the disparity range of a grating of infinite extent is confined to an interocular phase difference of 180° . Increasing the grating’s nominal disparity should cause the disparity of the nearest-neighbor match to oscillate in direction and size (Prince & Eagle, 2000a). As a result, stereoacuity too should oscillate. Farell et al. (2004) actually measured stereoacuity for a wide grating in a Gaussian envelope, with the envelope pinned at zero disparity. They found that disparity thresholds began to rise precipitously at an interocular phase of 90° , reaching catastrophic levels at 180° , and then returning to the previously low levels as the phase reached 360° . In short, the measured thresholds oscillated in a predictable way with the interocular phase of the carrier.
What happens if the disparity of the envelope and grating (carrier) were changed in tandem, as would occur if one half-image of a grating segment were shifted laterally? On the left of Figure 1, we have diagrammed the two retinal half-images of a grating target presented in the fixation plane. Because there is no disparity between the half-images, we have drawn them in alignment one above the other to indicate that they fall at corresponding retinal loci. Consider what happens when the right half-image is shifted by a full period (Figure 1, right). There is a substantial disparity between the half-images at the edges, but the shift of a full period returns the center of the grating to an interocular phase disparity of zero. The central region of the shifted grating is once again aligned at retinal correspondence with the grating in the other eye. Despite the identical matches of the grating center (boxed regions), these two stimuli produce radically different depth percepts. For presentations too brief (200 ms) to permit a voluntary change in convergence, the grating on the left appears in the fixation plane (zero disparity), whereas the shifted grating on the right appears at a uniform depth that corresponds to the disparity of the edges. Generally, a grating of limited extent appears in depth at or near the disparity of its edges even if the edge disparities are far greater than the 180° limit (Cumming & Parker, 2000; McKee, Verghese, & Farell, 2004). Thus, the disparity of the grating’s envelope(its ‘edges’) can disambiguate stereo matching for the grating as a whole.
Figure 1.
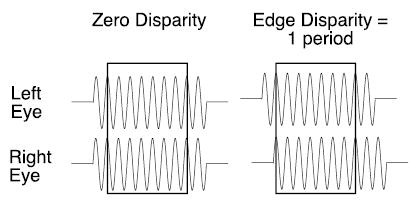
Diagram of stereoscopic half-images of grating (see text).
The disparity of the envelope determines perceived depth, but what effect does it have on stereoacuity? If the disparity of the envelope and the carrier were always varied together, it would be impossible to determine the basis of stereo thresholds. Thresholds might depend on the carrier up to an interocular phase of 90° –180° , and then switch over to the signal carried by the envelope. Or thresholds might depend on the envelope at all disparities. To learn if the envelope and the carrier interact in stereoacuity, we will vary the envelope disparity parametrically from 0 to 20 arcmin. However, we will keep the envelope disparity fixed for any block of trials and vary only the interocular phase disparity incrementally from trial to trial, thereby forcing the observer to use the carrier disparity as the basis of stereo judgments.
As the edge disparity is increased from zero to ever-larger absolute values, the phase disparity of the carrier changes from zero through a full period to return to zero again. Does human stereoacuity depend only on the local interocular phase or on the operations that determine perceived depth? If stereoacuity is limited by local interocular phase, thresholds should oscillate with the periodic disparity of the carrier as the edges are shifted to larger disparities, just as in the Farell et al. study (2004), where the envelope’s disparity was fixed at zero. If, on the other hand, stereoacuity is determined by matching operations, thresholds might follow the depth specified by the edges, rising exponentially with increasing edge disparity. Our experiments will determine whether stereoacuity for the carrier is limited by the mechanism with the optimum spatial scale or by mechanisms with suboptimal scale that underlie the perceived depth of the grating.
Methods
Stereoacuity measurements for gratings and bars
We measured stereoacuity for a sinusoidal grating segment, 6° wide and 2° high, as a function of edge disparity. Observers judged the relative disparity of the grating with respect to a reference that was presented below it. The ‘edges’ of the grating were simply the position where the grating began or ended abruptly on the screen (i.e., the grating was presented in a rectangular envelope). No additional aperture or frame surrounded the grating. The edges of the grating were laterally separated from the outer frame of the monitor by 3° on each side. All measurements in this study were for edge disparities presented in or behind the fixation plane. As a comparison to the grating thresholds, we also measured stereoacuity for a bright rectangular bar 18-arcmin wide and 2° high as a function of absolute disparity.
The reference stimulus for most of these experiments was a thin dark line, 30 arcmin in length, separated vertically by 1° from the grating (Figures 2, 3, and 5). For one study, we used a grating, also presented 1° below the upper test grating, as the reference stimulus (Figure 4). The large vertical separation between test and reference stimuli was intended to prevent the interaction between them that has been found to affect perceived depth in other studies (Zhang, Edwards, & Schor, 2001). To improve sensitivity, we repeated one condition with the reference 9.5 arcmin below the test grating (Figure 7).
Figure 2.
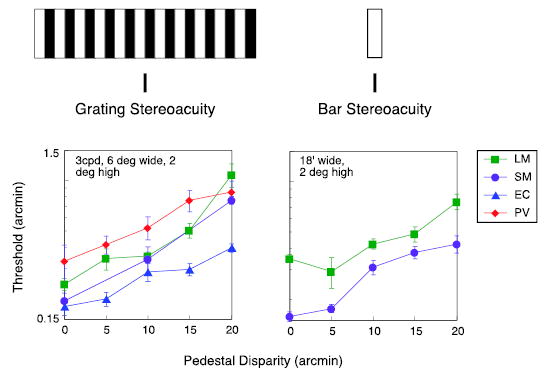
Disparity thresholds as a function of the absolute disparity of the targets. Left graph: thresholds for grating. Right graph: thresholds for bar.
Figure 3.
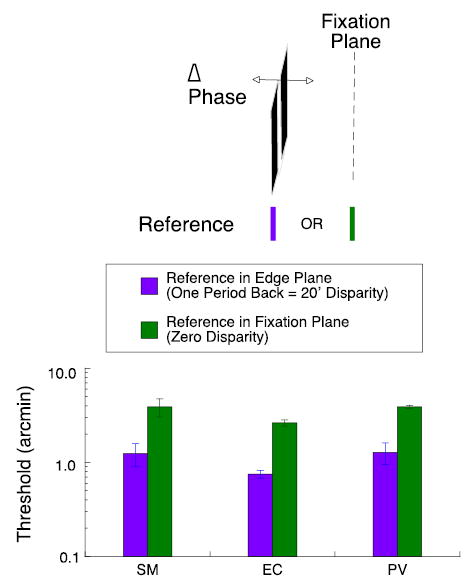
Purple bars show disparity thresholds when target grating and reference are located in same plane at an edge disparity of 20 arcmin, equal to one full period of 3 cpd grating. Green bars show disparity thresholds when test grating remains at 20 arcmin disparity but reference is located in the fixation plane.
Figure 5.
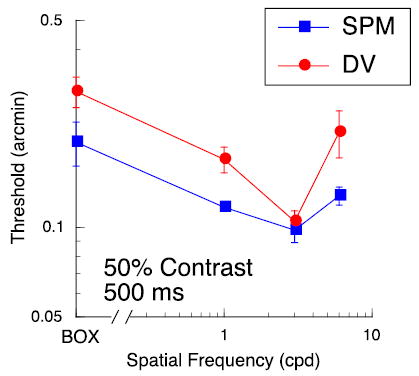
Disparity thresholds in fixation plane as a function of spatial frequency; data for two subjects. Leftmost point is for a luminous rectangle (‘Box’) equal in extent to the gratings (6° wide). Target duration was 500 ms. Grating contrast was 50%.
Figure 4.
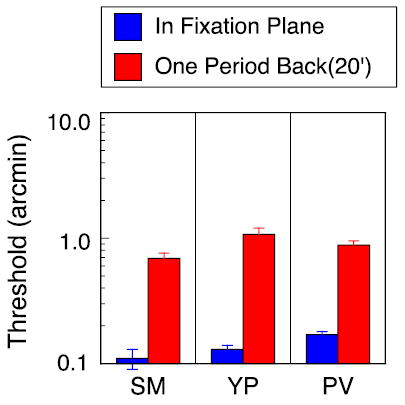
Interocular phase disparity thresholds for 3 cpd test grating with second grating serving as reference. Blue bars: test and reference gratings presented in the fixation plane (edge disparity = 0 arcmin). Red bars: test and reference gratings presented one period behind fixation plane (edge disparity = 20 arcmin). Interocular phase of upper test grating was varied in small increments around zero phase from trial to trial. Gratings were separated vertically by 1°.
Figure 7.
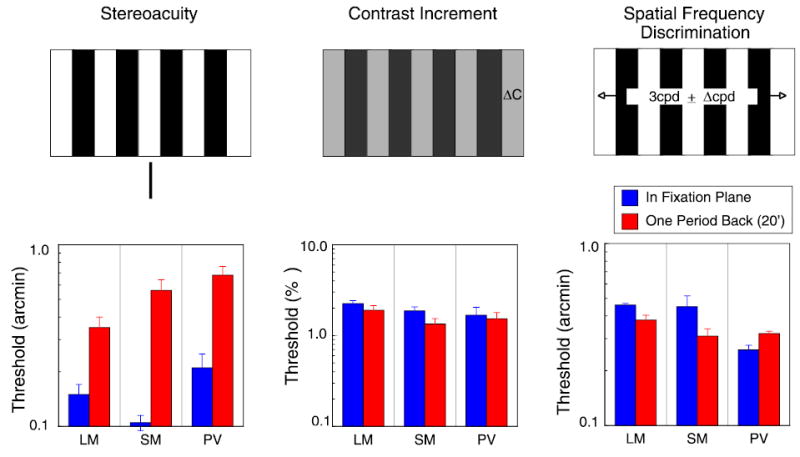
Blue bars in all three histograms are for a 3 cpd, 6° wide grating presented in the fixation plane; red bars are for grating presented with an edge disparity of 20 arcmin. Left: disparity thresholds; reference presented in same plane as grating edges. Center: contrast increment thresholds, expressed as percentage change in 50% contrast; right: spatial frequency discrimination thresholds, expressed in arcmin difference in periods.
The disparity of the grating edges and the reference line were fixed at the same value throughout a block of trials. The interocular phase disparity of the carrier was varied from trial to trial by adding one of five small increments centered on the fixed edge/reference disparity. On each trial, the observer judged whether the grating center was in front or behind the reference. We obtained a psychometric curve based on the proportion of trials on which the observer judged the grating to be behind the reference, as a function of the five test disparities. We fitted a cumulative normal function to the data with probit analysis to determine the change in phase disparity that produced a change in response rate from the 50% to the 75% level, equal to a d′ of 0.675. Each threshold in our graphs is based on a minimum of 200 trials. For all threshold measurements, we gave our observers feedback; they were also given practice for each stimulus type.
To minimize shifts in convergence, we asked the observer to align nonius lines before initiating a trial. The nonius lines were separated by 2° vertically and presented above and below the horizontal midpoint of the subsequently presented grating; a small dark fixation point was presented between the nonius lines to assist the observer with alignment. The nonius lines and the fixation point were turned off during the test presentation. The test stimuli were presented for 200 ms, a time too brief to permit the completion of a voluntary convergence movement during the target presentation (Rashbass & Westheimer, 1961). For one experiment performed only in the fixation plane (Figure 5), duration was increased to 500 ms to enhance sensitivity.
Contrast and spatial frequency discrimination
We measured contrast discrimination with the same grating used for the stereoacuity measurements (see diagram in Figure 7). From trial to trial, we varied the grating contrast in small increments around the mean contrast of 50%. The observer judged whether the test contrast was higher or lower than the mean. We obtained a psychometric curve from the proportion of trials that the observer judged the contrast to be higher than 50%, as a function of the five tested contrasts. We fitted a cumulative normal curve to the data using probit analysis to estimate the contrast increment threshold equal to a d′ of 0.675.
We also measured spatial frequency discrimination for the 3 cpd grating target. From trial-to-trial, we changed the spatial frequency of the grating in small increments around the mean spatial frequency of 3 cpd, using five test steps (2 higher, 2 lower, and 1 equal to the mean). The observer judged whether the frequency was higher or lower than the mean. We again used probit analysis to estimate the threshold equal to a d′ of 0.675 from the psychometric function based on the proportion of trials that the observer judged the test frequency to be higher than 3 cpd. This procedure, using an implicit standard equal to the mean of the test range, is a sensitive and efficient, although not widely used, method for assessing hyperacuity (Morgan, Watamaniuk, & McKee, 2000). Target duration for both the spatial frequency and contrast measurements was 200 ms.
General stimulus arrangements
Observers viewed the stereoscopic half-images of our stimuli in a mirror stereoscope. The displays were programmed on a Macintosh computer and presented on the screens of two 15-in. (14 in. viewable) Sony Trinitron monitors model 110GS. We used only the central 6° of each screen, where screen curvature was slight, for our displays. Nevertheless, we assessed the effect of screen curvature on visual direction from the perspective of the observer’s head position. We mounted a flat transparent grid of horizontal and vertical lines immediately in front of each screen and then aligned a thin cursor with each grid intersection for each screen separately, viewed in the stereoscope at a distance of 1.22 m. The cursor alignment measurements were incorporated into the software to correct each screen for any systematic deviations in x–y locations induced by screen curvature or raster imperfections.
The monitors were run at 74.9 Hz, using a 1024 × 768 resolution level. At our viewing distance of 1.22 m, each pixel subtended 0.71 arcmin. Subpixel shifts in disparity were achieved with dithering. For all studies except the explicit study on the effect of contrast on stereoacuity, the contrast of the grating targets was 50%. The gratings were presented against a homogeneous background equal to the mean luminance of the grating, which was 62 cd/m2. A Pritchard photometer was used to measure luminance as a function of monitor grey levels, and these values in turn were used in the contrast and dithering calculations. Overhead fluorescent lights illuminated the apparatus and the surrounding room at photopic levels.
Observers
The observers in these experiments were two of the authors and four young adult volunteers. For each observer, we explained the purpose and methods used in this study and then obtained a signed consent form. All six were experienced psychophysical observers with good stereoacuity. They wore optical corrections as needed for image clarity.
Results
We measured stereoacuity thresholds as a function of edge disparity for a 3-cpd, 6° wide grating (Figure 2, left). For comparison, we also measured stereoacuity for a bar, over a comparable range of absolute disparities (Figure 2, right). The rise in the thresholds for the grating—a factor of 3 at 20 arcmin disparity (one full period)—was virtually identical to the rise observed for the bar target.
As is common in stereoacuity studies, we presented the reference immediately below the grating in the plane of the edges. When the edges were shifted by one full period, the grating appeared in the depth plane associated with the disparity of the edges—at 20 arcmin behind the fixation plane. Despite its apparent depth, the carrier could generate neural responses in other depth planes, reflecting matching alternatives. In particular, it could generate strong responses in the fixation plane. If the stereo system has access to these responses, we might obtain better thresholds for a grating with an edge disparity of 20 arcmin by placing the reference in the fixation plane. This arrangement is diagrammed in Figure 3.
For bar targets, introducing a standing disparity between the test and reference produces a marked loss of sensitivity (McKee, Levi, & Bowne, 1990; Glennerster & McKee, 1999). The observer must judge whether the disparity between the reference and the test is larger or smaller than the mean disparity; thresholds rise proportionately with increasing standing disparity. Does introducing a standing disparity between the reference and the test produce the same loss in sensitivity for gratings as for bar targets? As shown in Figure 3, placing the reference in the fixation plane, 20 arcmin in front of the apparent location of the grating, increases thresholds by about a factor of three. Despite the potential match for the grating in the fixation plane, observers do not have access to this alternative match.
The short dark line may be an inadequate reference for the phase disparity information carried by the test grating. A more appropriate reference might be another grating, identical to the test except for the interocular phase disparity. We repeated the stereoacuity measurements, replacing the reference line with a reference grating. The reference grating had the same edge disparity as the test grating above it, but its interocular phase was fixed at zero. Threshold measurements were made in the fixation plane (edge disparity = 0) and with both gratings shifted by one full period (edge disparity = 20 arcmin). The histogram in Figure 4 shows thresholds for three observers. The reference grating provided better disparity information than the reference line; thresholds for observers PV and SM are somewhat lower than their thresholds in Figure 2. Nevertheless, the pattern of results is essentially the same. Stereoacuity in the fixation plane is much better than stereoacuity at 20 arcmin of disparity. This result is particularly striking because the observer can make the judgment by directly comparing the local phase disparities of the two gratings.
The control experiments demonstrate that the results shown in Figure 2 are not due to some artifact associated with the characteristics of the reference. So, why do stereo thresholds for the grating segment and the narrow bright bar show the same dependence on absolute disparity? It is sometimes argued that the stereo system cannot resolve the matching ambiguity associated with the carrier, and therefore it responds based on the disparity of the grating edges. In this conceptual framework, the stereo system treats the grating like a wide rectangular ‘box’ and ignores the contents of the box. It was to counteract this argument that we purposely varied only the interocular phase of the carrier from trial to trial. The envelope and reference were fixed for any block of trials.
However, for one set of control data, we fixed the interocular phase of the grating and the edge disparity at zero and varied the disparity of the reference line from trial to trial. Figure 5 shows thresholds plotted as a function of the spatial frequency of the grating. Note that the leftmost point is for an empty, bright rectangle, equal in area to the grating. These results demonstrate that sensitivity is affected by the carrier, even when the reference line, not the interocular phase of the carrier, is varied from trial to trial. Moreover, thresholds for the rectangle, a stand-in for the ‘envelope alone’, are somewhat worse than thresholds for the grating segments. Stereoacuity for the rectangle is degraded because the sharp vertical edges that carry the disparity information are presented at 3° eccentricity, whereas the interocular phase information of the grating is presented within the fovea. Nevertheless, it is likely that the edges of the rectangle provide better disparity information than the edges of the grating. In our prior work (McKee et al., 2004), we argued that the edge disparities of the grating segment were mediated by second-order stereo mechanisms that respond to the envelope, rather than the carrier (Hess & Wilcox, 1994; Wilcox, 1999; Schor, Edwards, & Sato, 2001; Langley, Fleet, & Hibbard, 1999; Read & Cumming, 2003). These second-order envelope mechanisms are thought to be fairly coarse, corresponding to filters with a peak tuning in the 0.25- to 0.5-cpd range. Human stereoacuity for gratings in this spatial frequency range is very poor, producing thresholds that are worse than our thresholds at 20-arcmin disparity (Schor & Wood, 1983; Legge & Gu, 1989). Also, Hess and Wilcox (1994) found that thresholds for a wide Gaussian envelope, presented in the fixation plane, were 3–5 arcmin. Therefore, we speculate that, even if we had varied the envelope disparity from trial to trial for the data shown in Figure 2, the envelope by itself would contribute little to sensitivity.
The alternative is that our thresholds depend on an interaction between second-order mechanisms at 3° eccentricity that encode the edge disparities and foveal mechanisms that respond to the carrier. We argue that this interaction reflects the matching operations that control the perceived depth of the grating. As shown in Figure 2, grating thresholds rise smoothly with increasing disparity. If the grating were infinitely long, or if the envelope were pinned to the fixation plane, thresholds would become very uncertain at 180° of phase (10 arcmin of disparity), because this phase angle corresponds to two equal and opposite disparities. At 10 arcmin of disparity, the edge disparities perform a useful disambiguation that enhances sensitivity. The threshold elevation for a 20-arcmin edge disparity, which returns the carrier to zero phase disparity, demonstrates that this same interaction can also produce a loss in sensitivity.
How do matching operations produce a loss in sensitivity? As noted in the introduction, hyperacuity thresholds can be equated to response changes produced by incremental changes in contrast, so manipulations of target contrast might offer some insight into the cause of the reduced sensitivity. We measured stereoacuity as a function of contrast for gratings presented in the fixation plane or 20 arcmin behind the plane (see Figure 6). In agreement with previous studies (Halpern & Blake, 1988; Legge & Gu, 1989; Westheimer & Pettet, 1990), we found that stereoacuity improves with increasing contrast. And, consistent with the results described above, thresholds at 20-arcmin disparity are significantly elevated compared to fixation plane thresholds. The interesting aspect of these results is that thresholds are uniformly elevated, by a factor of 2–3, over the whole tested contrast range. These results suggest that increasing the target’s absolute disparity increases disparity noise by a constant multiplicative factor at all contrast levels.
Figure 6.
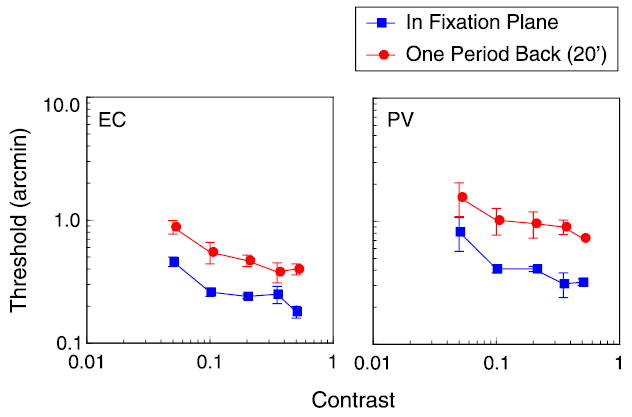
Disparity thresholds as a function of contrast for 3 cpd, 6° wide grating with edges in fixation plane (blue squares) and for the same grating with edge disparity of 20 arcmin, equal to one grating period. Reference was small black bar presented in edge plane, 1° below grating.
Perhaps the observer is having difficulty directing attention at the distant backward plane while fixating elsewhere. As attention is often modeled as producing changes in gain, it might have multiplicative effects on sensitivity. If so, one might expect that all sensitivity measures would be degraded for targets presented off the fixation plane. To test whether other judgments about the stimulus are similarly affected by nonzero disparity, we measured contrast and spatial frequency discrimination using the 3-cpd, 6° wide grating used for the stereoacuity measurements; the grating was presented either in the fixation plane or one period back at 20-min disparity. As shown in Figure 7, the 20-min disparity had almost no effect on either contrast or spatial frequency thresholds; the disparity pedestal affected only the disparity thresholds. Because many visual neurons are not tuned to disparity, but nevertheless respond to the contrast and spatial properties of the grating, this result is not surprising in itself. But it does rule out any generalized loss of sensitivity due to inattentiveness or task demands. The loss in sensitivity with absolute disparity is specific to stereoacuity.
Discussion
Stereo sensitivity for gratings, like that for any other stimulus, depends on absolute disparity. Our threshold measures for gratings show that sensitivity does not depend on the interocular phase disparity alone. As the edges of a 3-cpd, 6° wide grating are shifted off the fixation plane, thresholds rise, increasing by about a factor of 3 at a disparity of 20 arcmin. This disparity of 20 arcmin returns the 3-cpd grating to zero phase disparity, the same as for a grating presented in the fixation plane. Therefore, stereoacuity is not determined solely by the most sensitive scale responding to the stimulus—a finding supported by our previous study on stereoacuity for compound gratings (Farell et al., 2004).
Cumming and Parker (2000) measured the response of disparity-selective neurons in V1 to gratings presented within a large circular aperture. As the disparity of the aperture was changed, both human and monkey observers perceived the grating to shift to the depth of the aperture. However, shifts in the aperture disparity had no effect on the firing rate or tuning of neurons responsive to the local interocular phase at the grating center. If these neurons are unaffected by the edge disparities, why do stereo thresholds rise as edge disparities increase?
The V1 neurons set limits on the precision of primate disparity judgments (Prince, Pointon, Cumming, & Parker, 2000). Stereoacuity cannot be significantly better than the most sensitive disparity-selective neurons, but it may be a great deal worse. For one thing, human stereoacuity is based on relative disparity, not absolute disparity, so the minimum calculation underlying stereo judgments is a difference of two disparities. V1 neurons do not encode relative disparity (Cumming & Parker, 1999), so this calculation is probably performed in an extra-striate area (Thomas, Cumming, & Parker, 2002). However, this differencing operation is not the only one that could affect sensitivity. The stereo system must also assign a unique depth value to each stimulus by identifying the appropriate binocular match. As our thresholds follow the perceived depth of the grating, it appears that sensitivity is contingent on stereo matching.
Early stereo matching models (Julesz, 1971; Marr & Poggio, 1976; Pollard, Mayhew, & Frisby, 1985) were constructed of plausible constraints that could be incorporated into computational algorithms for matching the pixels in stereo image pairs (e.g., random dot stereograms). Most contemporary matching models (Qian, 1994; Fleet, Wagner, & Heeger, 1995; Mallot, Gillner, & Arndt, 1996; Gray et al., 1998; Prince & Eagle, 2000b; Tsai & Victor, 2003) use the responses of disparity neurons to the images, rather than pixel locations, as the input to their computations. For example, Qian (1994) demonstrated that a model composed only of complex disparity neurons was sufficient to resolve the matching ambiguities in a random dot stereogram containing a small range of disparities. And Prince and Eagle (2000a, 2000b) used disparity energy units, weighted by a steep prior favoring fixation-plane matches, to predict psychophysical data on dmax (the largest disparity that can be labeled consistently as in front or behind the fixation plane).
Matching models do not generally make predictions about stereo sensitivity. Gray et al. (1998) did calculate thresholds for different network architectures and different types of stimuli and demonstrated that their ‘mixture-of-experts’ model was more sensitive than competing models; predicted thresholds were consistent with human sensitivity in the hyperacuity range. However, Tsai and Victor (2003) have the only model that explicitly relates stereo sensitivity to stereo matching.
Stereo matching in the Tsai–Victor model depends on disparity templates. These templates consist of the pattern of responses of scaled disparity energy mechanisms to spatial white noise at each of 301 disparities falling within + 30 arcmin. Because white noise stimulates all spatial scales, each disparity has a unique frequency-dependent signature, something like a musical score. To find the appropriate match for any given stimulus, the stored templates are compared with the pattern produced by the novel stimulus. How the stereo system would implement template matching is unknown, but it is plausible to imagine that it examines the pattern of responses across scales, and recognizes which patterns correspond to which disparities.
In this model, sensitivity is contingent on the quality of the match between the stored template and the novel stimulus. If the sum of the squared errors between templates and stimulus reaches a tight minimum around a particular disparity value, sensitivity will be very good. If there is a broad minimum, many different disparities are equally plausible and sensitivity will be much poorer. Using this approach, Tsai and Victor (2003) were able to predict the rise in thresholds with increasing absolute disparity for small Gabor patches. Their predicted function resembled the functions shown in Figure 2, except that their predicted thresholds were considerably higher than ours. A serious drawback to applying the Tsai–Victor model to our results is that this model provides local estimates of disparity matches. The disparity mechanisms in their model that respond to the grating edges at 3° eccentricity would not interact with the disparity mechanisms that respond to the grating center.
As we noted above, these edge disparities are probably encoded by coarse scale second-order envelope mechanisms. It is possible to incorporate these second-order mechanisms into the Tsai–Victor templates, so that extended repetitive textures, like our grating stimulus, can be assigned a unique depth plane. The second-order mechanisms could have very large receptive fields that overlap the grating center. If so, the responses of fine first-order and coarse second-order mechanisms to the 6° wide grating would resemble the responses of standard disparity energy mechanisms to a compound grating. We note that compound gratings actually composed of a lower (0.5 cpd) and a higher frequency (2 or 4 cpd) component do not produce the slowly rising functions shown in Figure 2 (Farell et al., 2004). There may be multiple second-order mechanisms of differing scales that respond to the grating envelope (Sutter, Sperling, & Chubb, 1995; Schor et al., 2001), producing a pattern of activity that changes smoothly with increasing disparity.
Our amendment to the Tsai–Victor model might explain our results, but the postulated large receptive fields of the second-order detectors are an ad hoc element. Instead of large fields, second-order detectors could have an unusual neural organization. For example, they might be composed of many interlinked subunits that nevertheless function like a single disparity energy unit. Or they might be part of special network that modulates the responses of the primary disparity detectors. Gray et al. (1998) suggested that matching depends on two discrete mechanisms, a local network that assigns a disparity to each spatial location based on the activity in disparity energy neurons, and a selective network that determines which disparity overall has the best support. The selective network could assign the overall disparity of the envelope to the carrier but permit access to the carrier signals via the local network. The question is whether this neural network model could predict the slow increase in thresholds with increasing edge disparity shown in Figure 2.
Bredfeldt and Cumming (2005) described extra-striate units that respond selectively to disparity edges—meaning a significant discontinuity between a region at one disparity, and an adjacent region at another disparity. Edge disparity mechanisms, built out of these neurons, might detect an abrupt disparity step in one location, while other edge mechanisms might detect the corresponding step in the opposite direction at another location. Presumably, the intervening signals would be assigned to the implicit plane between the paired edge signals. If these putative edge mechanisms detect the envelope of our grating stimuli, they might specify the overall disparity of the grating. Our current results show that the interaction between the ‘edge’ mechanisms, however implemented, can influence sensitivity for local interocular phase.
Acknowledgments
This research was supported by NIH grants EY06644 (SPM) and EY012286 (BF). We thank Jenny Read for suggesting that we use a grating as a reference target (results shown in Figure 4).
Footnotes
Commercial relationships: none.
Address: Smith-Kettlewell Eye Research Institute, 2318 Fillmore Street, San Francisco, CA 94115.
Contributor Information
Suzanne P. McKee, Smith-Kettlewell Eye Research Institute, San Francisco, CA, USA.
Preeti Verghese, Smith-Kettlewell Eye Research Institute, San Francisco, CA, USA.
Bart Farell, Institute for Sensory Research Syracuse University, Syracuse, NY, USA.
References
- Badcock DR, Schor CM. Depth-increment detection function for individual spatial channels. Journal of the Optical Society of America A. 1985;2:1211–1216. doi: 10.1364/josaa.2.001211. [PubMed] [DOI] [PubMed] [Google Scholar]
- Blakemore C. The range and scope of binocular depth discrimination in man. Journal of Physiology. 1970;211:599–622. doi: 10.1113/jphysiol.1970.sp009296. [PubMed] [DOI] [PMC free article] [PubMed] [Google Scholar]
- Bredfeldt, C., & Cumming, B. G. (2005). Explaining cyclopean edge selectivity in macaque area V2. Abstract CoSyne Meeting, March, 2005.
- Cumming BG, Parker AJ. Binocular neurons in V1 of awake monkeys are selective for absolute, not relative, disparity. Journal of Neuroscience. 1999;19:5602–5618. doi: 10.1523/JNEUROSCI.19-13-05602.1999. [PubMed] [DOI] [PMC free article] [PubMed] [Google Scholar]
- Cumming BG, Parker AJ. Local disparity not perceived depth is signaled by binocular neurons in cortical area V1 of the Macaque. Journal of Neuroscience. 2000;19:5602–5618. doi: 10.1523/JNEUROSCI.20-12-04758.2000. [PubMed] [DOI] [PMC free article] [PubMed] [Google Scholar]
- Farell B, Li S, McKee SP. Coarse scales, fine scales, and their interactions in stereo vision. Journal of Vision. 2004;4(6):488–499. doi: 10.1167/4.6.8. http://journalofvision.org/4/6/8/, doi:10.1167/4.6.8. [PubMed] [Article] [DOI] [PubMed] [Google Scholar]
- Fleet DJ, Wagner H, Heeger DJ. Neural encoding of binocular disparity: Energy models, position shifts and phase shifts. Vision Research. 1996;36:1839–1857. doi: 10.1016/0042-6989(95)00313-4. [PubMed] [DOI] [PubMed] [Google Scholar]
- Glennerster A, McKee SP. Bias and sensitivity of stereo judgements in the presence of a slanted reference plane. Vision Research. 1999;39:3057–3069. doi: 10.1016/s0042-6989(98)00324-1. [PubMed] [DOI] [PubMed] [Google Scholar]
- Gray MS, Pouget A, Zemel RS, Nowlan SJ, Sejnowski TJ. Reliable disparity estimation through selective integration. Visual Neuroscience. 1998;15:511–528. doi: 10.1017/s0952523898153129. [PubMed] [DOI] [PubMed] [Google Scholar]
- Halpern DL, Blake RR. How contrast affects stereoacuity. Perception. 1988;17:483–495. doi: 10.1068/p170483. [PubMed] [DOI] [PubMed] [Google Scholar]
- Hess RF, Wilcox LM. Linear and nonlinear filtering in stereopsis. Vision Research. 1994;34:2431–2438. doi: 10.1016/0042-6989(94)90287-9. [PubMed] [DOI] [PubMed] [Google Scholar]
- Julesz, B. (1971). Foundations of cyclopean perception. Chicago: University of Chicago Press.
- Klein SA, Levi DM. Hyperacuity thresholds of 1 sec: Theoretical predictions and empirical validation. Journal of the Optical Society of America A. 1985;2:1170–1190. doi: 10.1364/josaa.2.001170. [PubMed] [DOI] [PubMed] [Google Scholar]
- Langley K, Fleet DJ, Hibbard PB. Stereopsis from contrast envelopes. Vision Research. 1999;39:2313–2314. doi: 10.1016/s0042-6989(98)00271-5. [PubMed] [DOI] [PubMed] [Google Scholar]
- Legge GE, Gu Y. Stereopsis and contrast. Vision Research. 1989;29:989–1004. doi: 10.1016/0042-6989(89)90114-4. [PubMed] [DOI] [PubMed] [Google Scholar]
- Lehky SR, Sejnowski TJ. Neural model of stereoacuity and depth interpolation based on a distributed representation of stereo disparity. Journal of Neuroscience. 1990;10:2281–2299. doi: 10.1523/JNEUROSCI.10-07-02281.1990. [PubMed] [DOI] [PMC free article] [PubMed] [Google Scholar]
- Mallot HA, Gillner S, Arndt PA. Is correspondence search in human stereo vision a coarse-to-fine process? Biological Cybernetics. 1996;74:95–106. doi: 10.1007/BF00204198. [PubMed] [DOI] [PubMed] [Google Scholar]
- Marr D, Poggio T. Cooperative computation of stereo disparity. Science. 1976;194:283–287. doi: 10.1126/science.968482. [PubMed] [DOI] [PubMed] [Google Scholar]
- Marr D, Poggio T. A computational theory of human stereo vision. Proceedings of the Royal Society of London B. 1979;204:301–328. doi: 10.1098/rspb.1979.0029. [PubMed] [DOI] [PubMed] [Google Scholar]
- McKee SP, Levi DM, Bowne SF. The imprecision of stereopsis. Vision Research. 1990;30:1763–1779. doi: 10.1016/0042-6989(90)90158-h. [PubMed] [DOI] [PubMed] [Google Scholar]
- McKee SP, Verghese P, Farell B. What is the depth of a sinusoidal grating? Journal of Vision. 2004;4(7):524–538. doi: 10.1167/4.7.1. http://journalofvision.org/4/7/1/, doi:10.1167/4.7.1. [PubMed] [Article] [DOI] [PubMed] [Google Scholar]
- Morgan MJ, Watamaniuk SNJ, McKee SP. The use of an implicit standard in psychophysical measurements. Vision Research. 2000;40:2341–2350. doi: 10.1016/s0042-6989(00)00093-6. [PubMed] [DOI] [PubMed] [Google Scholar]
- Ogle KN. Precision and validity of stereoscopic depth from double images. Journal of the Optical Society of America. 1953;43:906–913. doi: 10.1364/josa.43.000906. [PubMed] [DOI] [PubMed] [Google Scholar]
- Prince SJ, Cumming BG, Parker AJ. Range and mechanism of encoding of horizontal disparity in macaque V1. Journal of Neurophysiology. 2002;87:209–221. doi: 10.1152/jn.00466.2000. [PubMed] [DOI] [PubMed] [Google Scholar]
- Prince SJ, Eagle RA. Stereo correspondence in one-dimensional Gabor stimuli. Vision Research. 2000a;40:913–924. doi: 10.1016/s0042-6989(99)00242-4. [PubMed] [DOI] [PubMed] [Google Scholar]
- Prince SJ, Eagle RA. Weighted directional energy model of human stereo correspondence. Vision Research. 2000b;40:1143–1155. doi: 10.1016/s0042-6989(99)00241-2. [PubMed] [DOI] [PubMed] [Google Scholar]
- Prince SJ, Pointon AD, Cumming BG, Parker AJ. The precision of single neuron responses in cortical area V1 during stereoscopic depth judgments. Journal of Neuroscience. 2000;20:3387–3400. doi: 10.1523/JNEUROSCI.20-09-03387.2000. [PubMed] [DOI] [PMC free article] [PubMed] [Google Scholar]
- Pollard SB, Mayhew JEW, Frisby JP. PMF: A stereo correspondence algorithm using a disparity gradient limit. Perception. 1985;14:449–470. doi: 10.1068/p140449. [PubMed] [DOI] [PubMed] [Google Scholar]
- Qian N. Computing stereo disparity and motion with known binocular cell properties. Neural Computation. 1994;6:390–404. [Google Scholar]
- Rashbass C, Westheimer G. Disjunctive eye movements. Journal of Physiology, London. 1961;159:339–360. doi: 10.1113/jphysiol.1961.sp006812. [PubMed] [DOI] [PMC free article] [PubMed] [Google Scholar]
- Read JCA, Cumming BG. Testing quantitative models of binocular disparity selectivity in primary visual cortex. Journal of Neurophysiology. 2003;90:2795–2817. doi: 10.1152/jn.01110.2002. [PubMed] [DOI] [PMC free article] [PubMed] [Google Scholar]
- Schor CM, Edwards M, Sato M. Envelope tuning for stereo depth perception of small and large disparities. Vision Research. 2001;41:2555–2567. doi: 10.1016/s0042-6989(01)00155-9. [PubMed] [DOI] [PubMed] [Google Scholar]
- Schor CM, Wood I. Disparity range from local stereopsis as a function of luminance spatial frequency. Vision Research. 1983;23:1649–1654. doi: 10.1016/0042-6989(83)90179-7. [PubMed] [DOI] [PubMed] [Google Scholar]
- Schumer RA, Julesz B. Binocular disparity modulation sensitivity to disparities offset from the plane of fixation. Vision Research. 1984;24:533–542. doi: 10.1016/0042-6989(84)90107-x. [PubMed] [DOI] [PubMed] [Google Scholar]
- Smallman HS, MacLeod DIA. Spatial scale interactions in stereo sensitivity and the neural representation of binocular disparity. Perception. 1997;26:977–994. doi: 10.1068/p260977. [PubMed] [DOI] [PubMed] [Google Scholar]
- Sutter A, Sperling G, Chubb C. Measuring the spatial frequency selectivity of second-order texture mechanisms. Vision Research. 1995;35:915–924. doi: 10.1016/0042-6989(94)00196-s. [PubMed] [DOI] [PubMed] [Google Scholar]
- Thomas OM, Cumming BG, Parker AJ. A specialization for relative disparity in V2. Nature Neuroscience. 2002;5:472–478. doi: 10.1038/nn837. [PubMed] [DOI] [PubMed] [Google Scholar]
- Tsai JJ, Victor JD. Reading a population code: A multi-scale neural model for representing binocular disparity. Vision Research. 2003;43:445–466. doi: 10.1016/s0042-6989(02)00510-2. [PubMed] [DOI] [PubMed] [Google Scholar]
- Westheimer G, McKee SP. Stereoscopic acuity for moving retinal images. Journal of the Optical Society of America. 1978;68:450–455. doi: 10.1364/josa.68.000450. [PubMed] [DOI] [PubMed] [Google Scholar]
- Westheimer G, Pettet MW. Contrast and exposure duration differentially affect vernier and stereoscopic acuity. Proceedings of the Royal Society of London B. 1990;241:42–46. doi: 10.1098/rspb.1990.0063. [PubMed] [DOI] [PubMed] [Google Scholar]
- Wilcox LM. First and second-order contributions to surface interpolation. Vision Research. 1999;39:2335–2347. doi: 10.1016/s0042-6989(98)00261-2. [PubMed] [DOI] [PubMed] [Google Scholar]
- Wilson HR. Responses of spatial mechanisms can explain hyperacuity. Vision Research. 1986;26:453–469. doi: 10.1016/0042-6989(86)90188-4. [PubMed] [DOI] [PubMed] [Google Scholar]
- Zhang Z, Edwards M, Schor CM. Spatial interactions minimize relative disparity between adjacent surfaces. Vision Research. 2001;41:2995–3007. doi: 10.1016/s0042-6989(01)00179-1. [PubMed] [DOI] [PubMed] [Google Scholar]


