

Abstract
Upon homozygosis from a/α to a/a or α/α, Candida albicans must still switch from the ‘white' to ‘opaque' phenotype to mate. It was, therefore, surprising to discover that pheromone selectively upregulated mating-associated genes in mating-incompetent white cells without causing G1 arrest or shmoo formation. White cells, like opaque cells, possess pheromone receptors, although their distribution and redistribution upon pheromone treatment differ between the two cell types. In speculating about the possible role of the white cell pheromone response, it is hypothesized that in overlapping white a/a and α/α populations in nature, rare opaque cells, through the release of pheromone, signal majority white cells of opposite mating type to form a biofilm that facilitates mating. In support of this hypothesis, it is demonstrated that pheromone induces cohesiveness between white cells, minority opaque cells increase two-fold the thickness of majority white cell biofilms, and majority white cell biofilms facilitate minority opaque cell chemotropism. These results reveal a novel form of communication between switch phenotypes, analogous to the inductive events during embryogenesis in higher eukaryotes.
Keywords: C. albicans biofilms, C. albicans switching, white-opaque transition
Introduction
To mate, diploid Saccharomyces cerevisiae a/α cells need simply to undergo meiosis from a/α to a or α (Herskowitz, 1988; Haber, 1998). For Candida albicans a/α cells to mate, they must undergo MTL-homozygosis to a/a or α/α, but additionally switch from the mating-incompetent ‘white' phenotype to the mating-competent ‘opaque' phenotype (Miller and Johnson, 2002; Lockhart et al, 2003a). This added step in the C. albicans mating process is perplexing. Why has C. albicans uniquely inserted into its mating process this phenotypically complex transition (Anderson and Soll, 1987; Slutsky et al, 1987; Soll, 1992, 2003; Lan et al, 2002)? Additionally perplexing is the observation that the opaque phenotype is unstable at temperatures above 35°C (Slutsky et al, 1987). If unstable at physiological temperature (37°C), how can mating take place within the host? The observations first that opaque cells, but not white cells, colonize skin (Kvaal et al, 1999), which has a surface temperature of 32°C, and second that skin facilitates mating (Lachke et al, 2003) seemed to provide some resolution to these questions (Soll, 2006). However, while this explanation may prove to be part of the story, there is still a problem. Why develop so complex a phenotype as opaque and involve so many genes just to colonize skin, when skin represents such a minor site for C. albicans colonization (Odds, 1988)? Here, we explore a recent, unexpected discovery that may ultimately provide us with an explanation.
When a/α cells undergo homozygosis to the white a/a or α/α phenotype, there is no significant change in superficial cellular morphology. There, however, is a change in switching potential. While a/α cells are incapable of switching due to a1–α2 repression, white a/a and white α/α cells can switch to the opaque phenotype (Lockhart et al, 2002; Miller and Johnson, 2002). The differences between the white and opaque phenotypes, on the other hand, are extensive. Whereas opaque cells release pheromone, white cells do not (Miller and Johnson, 2002; Lockhart et al, 2003b), and whereas opaque cells are blocked in G1 and shmoo in response to pheromone, white cells do not (Miller and Johnson, 2002; Bennett et al, 2003; Lockhart et al, 2003a; Zhao et al, 2005). Most importantly, whereas opaque cells mate, white cells do not (Miller and Johnson, 2002; Lockhart et al, 2003a). One would, therefore, logically assume that only opaque cells express pheromone receptors and respond to pheromone by increased expression of mating-associated genes. However, in a negative control performed in an analysis of pheromone-induced gene expression, we discovered that two genes upregulated in opaque cells were also upregulated in white cells (Lockhart et al, 2003b). Why would opaque cells signal mating-incompetent white cells, and why with mating factor? Here, we verify and extend our original observations and demonstrate that white cells express pheromone receptors on their surface. Speculating upon the role of the white cell response to pheromone, we explore the hypothesis that pheromone released by opaque cells induces white cells to become highly cohesive and form a biofilm that provides a protective environment for opaque cell chemotropism in the mating process.
Results
Pheromone induction of gene expression
We previously demonstrated that α-pheromone upregulated STE2 and STE4 in white cells (Lockhart et al, 2003b). To verify this result, we performed an expanded Northern analysis that identified additional mating-associated genes upregulated by α-pheromone in white a/a cells, CEK1, CEK2 and SST2 (Figure 1A). These results were highly reproducible in the same strain (P37005) and in the unrelated natural a/a strain L26 (Figure 1B).
Figure 1.
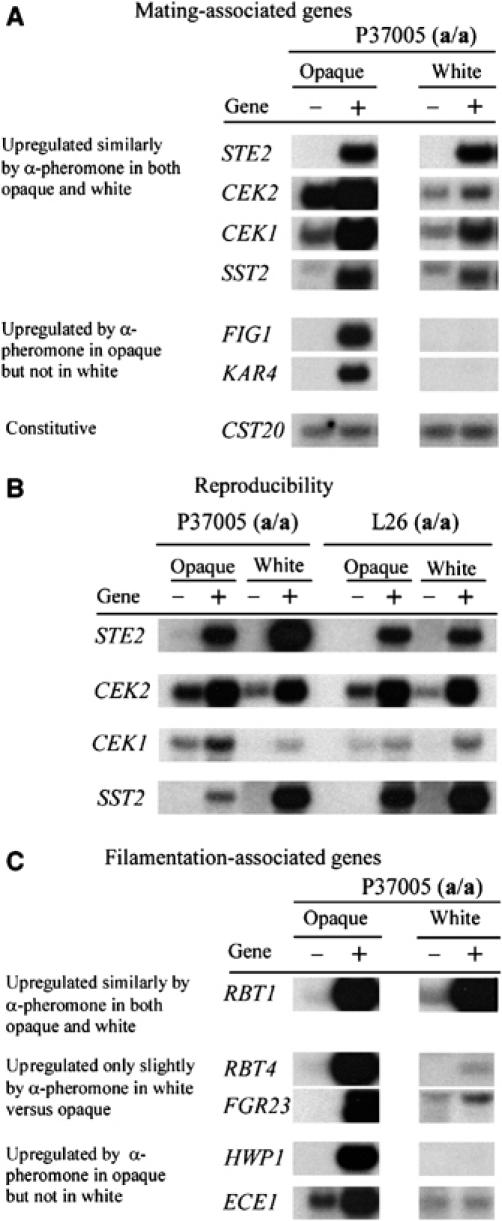
Northern analysis reveals that some, but not all, mating-associated and filamentation-associated genes upregulated by α-pheromone in opaque a/a cells are also upregulated by α-pheromone in white a/a cells. (A) Mating-associated genes. (B) A comparison of α-pheromone induction in the unrelated a/a strains P37005 and L26. (C) Filamentation-associated genes. Untreated control cells (−); α-pheromone-treated test cells (+).
In our previous report (Lockhart et al, 2003a), we also demonstrated that the effect of α-pheromone on gene expression was selective. Pheromone treatment of white cells did not upregulate two genes upregulated in opaque cells, FIG1 and KAR4. This result was verified (Figure 1A). Since α-pheromone also upregulates genes involved in filamentation in opaque cells (Bennett et al, 2003; Zhao et al, 2005), we analyzed expression of five of these genes in α-pheromone-treated white a/a cells. Three of these genes, RBT1, RBT4 and FGR23, were upregulated, although in the latter two cases not to the same extent as in opaque cells (Figure 1C). α-Pheromone also did not upregulate the hypha-specific genes HWP1 (Staab et al, 1996) or ECE1 (Birse et al, 1993), as it did in opaque a/a cells. Together, these results demonstrate that the induction by pheromone of gene expression in white cells is real, but more restricted than in opaque cells.
White a/a cells express α-pheromone receptors on their surface
The response to α-pheromone by white cells indicated that they expressed an α-pheromone receptor. To demonstrate this, we treated live a/a cells with biotinylated α-pheromone on ice to retard internalization (Schandel and Jenness, 1994), fixed the cells, permeabalized them with methanol, and then stained them with Oregon Green®-tagged streptavidin, which specifically binds biotin (Weber et al, 1992). Laser scanning confocal microscopy (LSCM) revealed punctate staining at the surface of opaque a/a cells (Figure 2A and B). The number of fluorescent dots on the opaque cell surface varied between 100 and 200 per cell (N=20), which corresponded to the average number of pimples (141±39) previously measured on the opaque cell surface (Anderson et al, 1990). LSCM performed at the same settings for pixel intensity (i.e., laser power, gain and aperture) revealed staining at the surface of white a/a cells, but staining was uniform (Figure 2C and D). a/α cells (Figure 2E and F), white α/α cells (Figure 2G) and opaque α/α cells (Figure 2H), which we assumed would possess no α-pheromone receptors, did not stain. White a/a cells treated with streptavidin alone also did not stain (data not shown).
Figure 2.
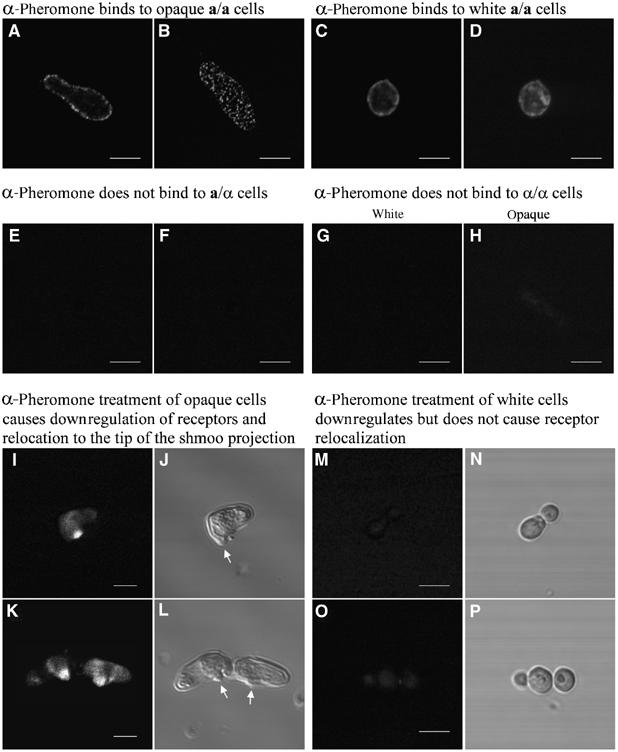
White a/a cells express α-pheromone receptors on their surface, but the distribution prior to pheromone treatment and the redistribution after pheromone treatment differ from that of opaque cells. Live white or opaque cells were treated with biotinylated α-pheromone on ice, fixed, and stained with Oregon Green® streptavadin to assess receptor distribution. (A, B) Punctate staining pattern of opaque cells visualized by LSCM 1 μm above the substratum or at the substratum, respectively. (C, D) Uniform staining pattern of white cells visualized by LSCM 1 μm above the substratum or at the substratum, respectively. (E, F) α-Pheromone does not label a/α cells. (G, H) α-Pheromone does not stain white or opaque α/α cells, respectively. (I–L) α-Pheromone treatment of opaque a/a cells leads to downregulation and relocalization of receptors to the site of conjugation tube evagination in the shmoo. (M–P) α-Pheromone treatment of white a/a cells leads to downregulation, but not to relocalization, of receptors. Arrows in (J, L) denote conjugation tube evaginations. Scale bars, 2 μm.
In S. cerevisiae, α-pheromone treatment of a cells results in the downregulation of occupied receptors, and relocalization to the site of conjugation tube evagination (Schandel and Jenness, 1994; Stefan and Blumer, 1999). To test whether the α-pheromone receptors of white and opaque C. albicans a/a cells were similarly downregulated, cells were treated with biotinylated α-pheromone for 4 h, then washed, treated with fresh biotinylated α-pheromone on ice, fixed, permeabalized with methanol, and stained with Oregon Green®-conjugated streptavadin. Staining decreased at the opaque cell surface and localized to the site of conjugation tube evagination (Figure 2I–L). Similar treatment of white cells also resulted in a decrease in surface staining, but no relocalization to a single site at the cell surface (Figure 2M–P). Similar results were obtained in cells that were stained with fluorescein-conjugated α-pheromone (data not shown). These results demonstrate that white a/a cells, like opaque a/a cells, express α-pheromone receptors at their surface, and that α-pheromone treatment results in the downregulation of receptors from the surface of both cell types, but that receptors relocalize to the site of conjugation tube evagination in pheromone-treated opaque cells, but do not in pheromone-treated white cells.
α-Pheromone does not affect the white budding cycle
It was previously demonstrated that although α-pheromone blocks opaque a/a cells in G1 and induces shmoo formation, it does not appear to affect white cells similarly (Bennett et al, 2003; Lockhart et al, 2003a; Zhao et al, 2005). Because α-pheromone not only upregulates select mating-associated genes in white a/a cells, but does so for some genes to the same extent as in opaque cells, we revisited the question of whether α-pheromone had any measurable effect on the white budding cell cycle (Table I). When white a/a cells from either an early or a late saturation phase growth culture were diluted into fresh medium containing α-pheromone, and pheromone replenished at hourly intervals, the proportion of budding cells after 8 h of treatment was indistinguishable from that in untreated cultures (Table II). DNA staining of 8 h white cells revealed that in both untreated and treated cultures, all cells with large buds contained one nucleus in the mother cell and one in the bud (N=200 for each condition). When the same experiments were performed with opaque a/a cells, the majority in untreated cultures possessed buds, whereas the majority in pheromone-treated cultures formed shmoos (Table II). Staining of nuclei revealed that in untreated cultures, all opaque cells with large buds contained two nuclei, but in treated cultures the great majority of opaque cells had formed conjugation tubes and contained only one nucleus, which was located in the mother cell (N=200 for each condition). These results indicate that even though α-pheromone has a dramatic effect on gene expression, it has no measurable effect on the budding growth cycle of white a/a cells, as it has on opaque a/a cells.
Table 1.
Pheromone does not induce shmooing in white cells or block them in G1
| Percent of population |
|||||||
|---|---|---|---|---|---|---|---|
| Cell type | Growth phasea | Growth time (h)b | Pheromone treatmentc | No. of cells | Unbudded cells (%) | Cells with bud (%) | Shmoos (%) |
| White | ESP | 0 | − | 276 | 70 | 30 | 0 |
| 8 | − | 289 | 17 | 83 | 0 | ||
| 8 | + | 213 | 7 | 93 | 0 | ||
| White | LSP | 0 | − | 206 | 97 | 3 | 0 |
| 8 | − | 204 | 5 | 94 | 0 | ||
| 8 | + | 214 | 6 | 94 | 0 | ||
| Opaque | ESP | 0 | − | 258 | 76 | 25 | 0 |
| 8 | − | 224 | 22 | 78 | 0 | ||
| 8 | + | 200 | 9 | 4 | 85 | ||
| Opaque | LSP | 0 | − | 221 | 86 | 13 | 0 |
| 8 | − | 194 | 15 | 85 | 0 | ||
| 8 | + | 206 | 9 | 19 | 72 | ||
| aESP, early saturation phase; LSP, late saturation phase. | |||||||
| bWhite or opaque cells were grown at 25°C in supplemented Lee's medium for 36 h to early saturation phase or for 48 h to late stationary phase, and diluted into fresh medium at 2 × 10⁶/ml. Cells were then incubated for 8 h. | |||||||
| cFor pheromone-treated cells (+), pheromone was added every hour for 7 h, then cells were harvested at 8 h. Untreated (−) cells were also harvested at 8 h. | |||||||
Table 2.
Minority opaque cells stimulate biofilm development by majority white cells
| Cell type proportions |
|||||
|---|---|---|---|---|---|
| Experiment | Whitea (%) | Opaquea (%) | Depthb (μm) | Increase (+) or decrease (−)c (%) | Significantly different from 100% whited |
| 1 | 100.0 (a,α) | 0.0 | 27.2±1.9 | ||
| 0.0 | 100.0 (a,α) | 8.2±1.7 | −70 | + | |
| 90.0 (a,α) | 10.0 (a,α) | 60.3±3.3 | +122 | + | |
| 50.0 (a,α) | 50.0 (a,α) | 30.2±2.8 | +11 | – | |
| 2 | 100.0 (a,α) | 0.0 | 30.0±2.7 | ||
| 0.0 | 100.0 (a,α) | 11.0±1.7 | −63 | + | |
| 99.9 (a,α) | 0.1 (a,α) | 28.3±2.1 | −6 | – | |
| 99.0 (a,α) | 1.0 (a,α) | 58.6±3.1 | +95 | + | |
| 90.0 (a,α) | 10.0 (a,α) | 64.9±3.6 | +116 | + | |
| 50.0 (a,α) | 50.0 (a,α) | 30.7±1.4 | +2 | – | |
| 90.0 (a,α) | 10.0 (a) | 28.2±3.2 | −6 | – | |
| 90.0 (a,α) | 10.0 (α) | 31.8±2.0 | +6 | – | |
| 100.0 (a) | 0.0 | 29.6±2.2 | −1 | – | |
| 90.0 (a) | 10.0 (α) | 33.6±1.7 | +12 | – | |
| 90.0 (a) | 10.0 (a, α) | 41.3±1.7 | +38 | + | |
| 100.0 (α) | 0.0 | 32.0±2.2 | +7 | – | |
| 90.0 (α) | 10.0 (a) | 38.4±2.4 | +28 | + | |
| 90.0 (α) | 10.0 (a, α) | 47.8±1.2 | +59 | + | |
| a(a/α) 50% a/a, 50% α/α; (a) 100% a; (α) 100% α. | |||||
| bDepth is presented as the mean±standard deviation of the depth of three biofilms, each measured at three sites, for a total (N) of nine measurements. | |||||
| cPercent increase or decrease computed relative to the value for 100 (a/α). | |||||
| dP-values were computed by the Student's t-test between 100% white and each test measure. A P-value ⩾0.05 was considered significant (+), and <0.05 insignificant (−). | |||||
Paradox and possible explanation
Why do white cells, which are mating-incompetent, respond to pheromone? To find an explanation, we stepped back and speculated about mating scenarios in vivo. We hypothesized that on occasions, natural a/a and α/α strains co-colonize a host (Soll, 2002). We would expect co-colonizing a/a and α/α strains to express primarily the white phenotype, as has been demonstrated for natural MTL-homozygous strains at sites of colonization (Soll et al, 1987). Based upon experiments performed in vitro (Anderson and Soll, 1987; Slutsky et al, 1987; Rikkerink et al, 1988; Bergen et al, 1990), we would expect a switch to the opaque phenotype in these overlapping white a/a and α/α populations to be a rare event (Figure 3A). Physiological temperature would induce switching of these opaque cells back to the white phenotype after two cell generations (Srikantha and Soll, 1993; Soll, 2003). If, however, an opaque a/a and an opaque α/α cell were generated within pheromone-signaling distance, they would reciprocally block each other in G1 (Zhao et al, 2005), thus inhibiting a switch back to white. a-Pheromone released by an opaque a/a cell would form a spatial gradient that decreased in the direction of the α/α cell, and α-pheromone released by the α/α cell would form a spatial gradient that decreased in the direction of the a/a cell (Figure 3B). In response to the opposing spatial gradients of pheromone, the opaque a/a and opaque α/α cells would polarize and shmoo, and each conjugation tube would grow in the direction of the other (Figure 3B), the process referred to as ‘chemotropism' (Figure 3B). In vivo, conjugation tubes of opposite mating type would have to extend over relatively long distances (i.e., many cell diameters in length) to fuse. Hence, the pheromone gradients would have to remain stable over long distances for extended periods of time. Soluble gradients of such low molecular weight molecules would be susceptible to mechanical perturbations, and dissipate as a result of rapid diffusion. How could such gradients be stabilized? We searched for analogies and considered gel electrophoresis. When separating molecules by electrophoresis, diffusion and mechanical perturbation are minimized by starch, polyacrylamide or agarose gels. What if opaque cells signaled white cells of opposite mating type to form a stable 3D matrix (biofilm?) (Figure 3C) that facilitated chemotropism by protecting soluble spatial gradients of pheromone?
Figure 3.
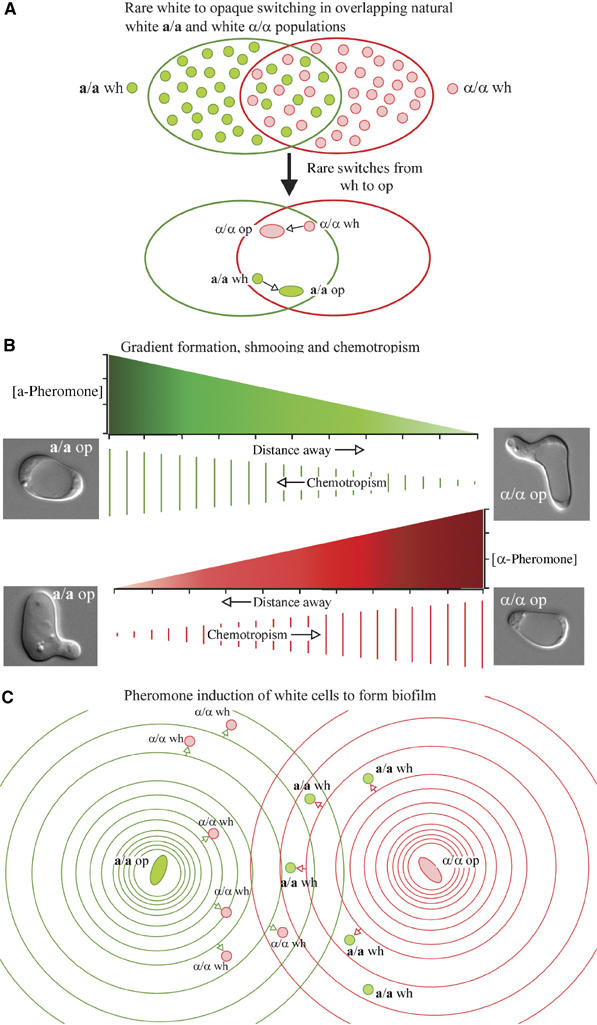
Developing the hypothesis that opaque cells signal white cells of opposite mating type, through the release of pheromone, to form a biofilm that protects the opposing spatial gradients of pheromone that must develop for chemotropism to proceed. (A) In overlapping populations of natural white a/a and white α/α cells in the host, the predominant phenotype is white, but there are rare and transient switches from white to opaque. (B) An opaque a/a cell releases a-pheromone, which forms a spatial gradient that induces shmooing and promotes chemotropism of an opaque α/α cell, and vice versa. The spatial gradients of opposing pheromones are diagrammed between an opaque a/a and opaque α/α cell both as a graph of concentration as a function of distance (green and red, respectively) and as a sequence of parallel lines decreasing in length as concentration decreases. (C) The a-pheromone released by the rare opaque a/a cell and the α-pheromone released by the rare opaque α/α cell promote biofilm formation in white cells of opposite mating type. The spatial gradients of opposing pheromones are diagrammed as rings separated by greater distances denoting concentration decreases. Small arrows represent pheromone induction of white cells of opposite mating type to join in biofilm formation.wh, white; op, opaque.
Exploring the validity of our hypothesis
To explore the validity of this hypothesis, we employed a number of experimental protocols that tested different aspects.
Does pheromone induce white cell cohesiveness and formation of a cohesive cell film on a substratum?
A first step in biofilm development is the formation of a basal layer of cohesive cells adhering to a substratum (Hawser and Douglas, 1994; Burscher and van der Mei, 2000; Mukherjee et al, 2005). To test whether α-pheromone selectively induces cohesiveness between white a/a cells in suspension, a mixture of white (60%) and opaque (40%) cells of the natural a/a strain P37005 were diluted into fresh medium either lacking or containing α-pheromone, and incubated in suspension for 2 h. Samples were then pressed down with a coverslip and examined microscopically. Cells from untreated cultures dispersed (Figure 4A, B and C), but cells from treated cultures formed clumps of tightly cohering cells (Figure 4D, E and F). Clumps were made up predominantly of white cells, which flattened into cohesive monolayers when pressed by coverslips onto the glass slides (Figure 4D, E and F). Opaque cells, for the most part, were excluded from the interior of these clumps. Large clumps were composed exclusively of white cells (Figure 4G and H). Each white cell bordered six other cells on average in a hexagonal array referred to by Buckminster Fuller as ‘closest sphere packing' (Fuller, 1975) (Figure 4I). Experiments in which suspension cultures were examined every 30 min revealed that cohesiveness was induced by pheromone within 1 h of treatment.
Figure 4.
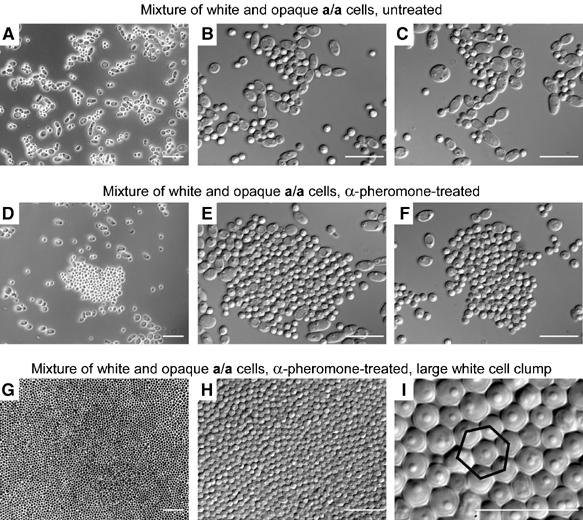
α-Pheromone induces cohesiveness between a/a white cells, but not between a/a opaque cells, in suspension cultures. Cells from each suspension culture were pipetted through a wide bore pipette onto a slide and pressed into a monolayer with a coverslip. (A–C) Mixture of untreated white (60%) and opaque (40%) a/a cells (strain P37005). (D–F) Mixture of white (60%) and opaque (40%) a/a cells treated with 3 × 10⁻⁶ M α-pheromone. (G–I) Increasing magnification of α-pheromone-treated white a/a cells in a large clump pressed into a monolayer by a coverslip on a microscope slide. Neighboring cells form a hexagonal array around each cell according to ‘closest sphere packing' geometry (Fuller, 1975). Scale bar, 10 μm.
To test whether α-pheromone induced white a/a cells to form an adhesive film directly on a plastic substratum, cells were incubated with pheromone in a multiwell plastic tissue culture plate undisturbed for 16 h. α-Pheromone-treated white a/a cells formed an adherent, thick film on the plastic well bottom (Figure 5A), whereas untreated white a/a cells (Figure 5E), α-pheromone-treated opaque a/a cells (Figure 5B), α-pheromone-treated white α/α cells (Figure 5C), α-pheromone-treated opaque α/α cells (Figure 5D) and α-pheromone-treated a/α cells (Figure 5F) did not.
Figure 5.

α-Pheromone selectively induces white a/a cells to form a cohesive film adhering to plastic. (A) White a/a cells treated with α-pheromone. (B) Opaque a/a cells treated with α-pheromone. (C) White α/α cells treated with α-pheromone. (D) Opaque α/α cells treated with α-pheromone. (E) White a/a cells untreated. (F) a/α cells treated with α-pheromone. Cells were inoculated into wells of a six-well cluster plate in the presence (+) or absence (–) of 3 × 10⁻⁶ M α-pheromone. After 16 h of undisturbed incubation at 29°C, the bottoms of the dishes were gently washed with buffered saline and photographed.
Finally, we tested whether a-pheromone induced white α/α cells to form a basal layer of cohesive cells on a plastic substratum. Because the a-pheromone gene has not been identified in C. albicans, synthetic a-pheromone was unavailable. We therefore developed a protocol in which live opaque a/a cells stimulated by live opaque α/α cells in a source well provided a-pheromone for α/α cell stimulation in a response well (Figure 6A and B). After 16 h of undisturbed treatment, the response wells were gently rinsed to remove nonadhering cells, and the cells adhering to the well bottom scraped off with a toothpick and examined microscopically. In preparations in which white a/a or white α/α cells were not challenged with opposite mating type pheromone, cells were only loosely bound to the well bottom and those removed by scraping were dispersed (Figure 6C and G, respectively). In test preparations in which white a/a or white α/α cells were challenged with pheromone of opposite mating type, cells were tightly bound to the well bottom and those removed formed cohesive sheets (Figure 6D and H, respectively). When white a/a cells were placed in the response well and only opaque α/α cells alone in the source well, or when white α/α cells were placed in the response well and opaque a/a cells alone in the source well, there was no induction of cohesivity (data not shown), suggesting that a combination of opaque a/a and α/α cells in the source well led to cross-stimulation of pheromone production. Opaque a/a or opaque α/α cells, unstimulated or stimulated, remained dispersed (Figure 6E, F, I and J, respectively). The majority of pheromone-stimulated opaque a/a or α/α cells formed conjugation tubes (Figure 6F and J, respectively). These results demonstrate that a-pheromone induces white α/α cells, but not opaque α/α cells, to form a cohesive basal layer of cells on a substratum, just as α-pheromone induces white a/a cells, but not opaque a/a cells.
Figure 6.
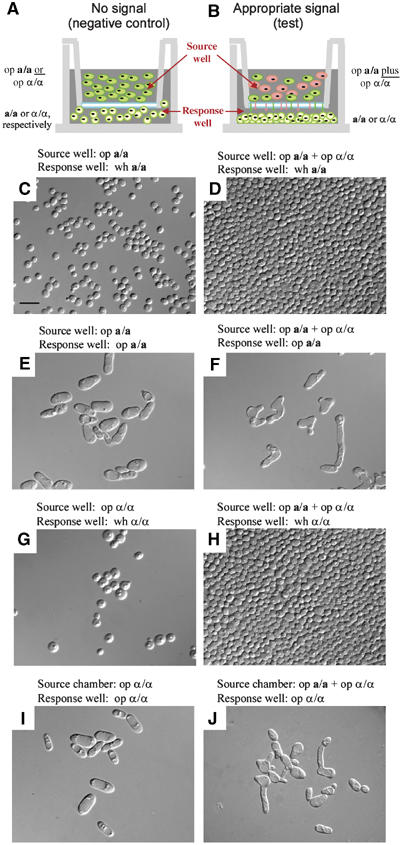
Natural α-pheromone released from opaque α/α cells and natural a-pheromone released from opaque a/a cells induce white cells of opposite mating type to form a cohesive basal layer of cells on plastic. (A) Diagram of the apparatus under control conditions in which a/a or α/α cells are placed in the bottom well (response), and only opaque cells of the same mating type are placed in the top well (source). In this negative control configuration (no signal), there is no pheromone from opposite mating type to signal a response. (B) Diagram of the apparatus under test conditions in which a/a or α/α cells are placed in the response well and a mixture of opaque a/a plus opaque α/α cells is placed in the source well. Wells are separated by a nucleopore filter. In this test configuration, there is continuous release of both a- and α-pheromone from opaque a/a and α/α cells in the source well, which diffuse into the response well (arrows). Opaque a/a and opaque α/α cells presumably cross-stimulate pheromone production. Preparations were incubated for 16 h at 29°C, then the bottom of the response well was scraped and wet mounts were made of scraped cells. (C, D) Unstimulated and stimulated white a/a cells, respectively. (E, F) Unstimulated and stimulated opaque a/a cells, respectively. (G, H) Unstimulated and stimulated white α/α cells, respectively. (I, J) Unstimulated and stimulated opaque α/α cells, respectively. Scale bar, 5 μm. wh, white; op, opaque.
Do opaque cells affect the development of white cell biofilms?
After a basal layer of cells is laid down on a substratum, it grows in the z-axis, forming a thick biofilm with hyphae concentrated in the mid-region (Baillie and Douglas, 1999; Mukherjee et al, 2005). To test whether minority opaque cells affected the growth and development of a majority white cell biofilm, different proportions of white and opaque cells were mixed and cast on a silicon elastomer surface. After 90 min, the elastomer surface was gently washed to remove nonadhering cells and incubated for 48 h on a slow rocker (Kuhn et al, 2002). In each test mixture, the white cell component was half a/a (strain P37005) and half α/α (WO-1), as was the opaque cell component. Three independent biofilms were cast and analyzed for each combination of white and opaque cells. Under these conditions, an initial monolayer formed on the elastomer of every test population that reflected the proportions of original cell types cast. Three measurements of depth were made for each biofilm after 48 h, resulting in a total of nine measurements per combination.
When a relatively pure preparation of white cells was cast on a silicon elastomer and rocked, a dense biofilm developed in which budding cells were prevalent at the bottom and top, and a mixture of budding cells and hyphae filled the mid-region (Figure 7A and B). The mean depth (±standard deviation) of these biofilms was 27.3±1.9 and 30.0±2.7 μm in two separate experiments (Table II). In contrast, biofilms formed by a relatively pure preparation of opaque cells were thin and fragile, and made up almost entirely of cells that had extended conjugation tubes (Figure 7D and E). The mean depth of these biofilms (Figure 7F) was 8.2±1.7 and 11.0±1.7 μm, in two separate experiments, one-third the thickness of white cell biofilms (Table II; compare Figures 7C and F). Biofilms formed by 50% white and 50% opaque cells contained budding cells, septated hyphae and unseptated conjugation tubes in the mid-region (Figure 7G and H). In two separate experiments, the mean depth was similar to that of biofilms formed by 100% white cells (Table II; compare Figures 7C and I). The mid-region of biofilms formed by 90% white and 10% opaque cells contained a higher proportion of hyphae than biofilms formed by 100% white cells (Figure 7J and K). The average thickness of biofilms formed by 90% white–10% opaque cells in two separate experiments was twice that of biofilms formed by 100% white cells (Table II; compare Figures 7C and L). To assess the minimum proportion of opaque cells that affected the thickness of a predominantly white cell biofilm, the proportion of opaque cells cast with white cells was systematically varied (50, 10, 1 and 0.1%). While 0.1% opaque cells had no significant effect on biofilm thickness, 1 and 10% opaque cells both resulted in majority white cell biofilms twice as thick as those formed by 100% white cells (Table II).
Figure 7.
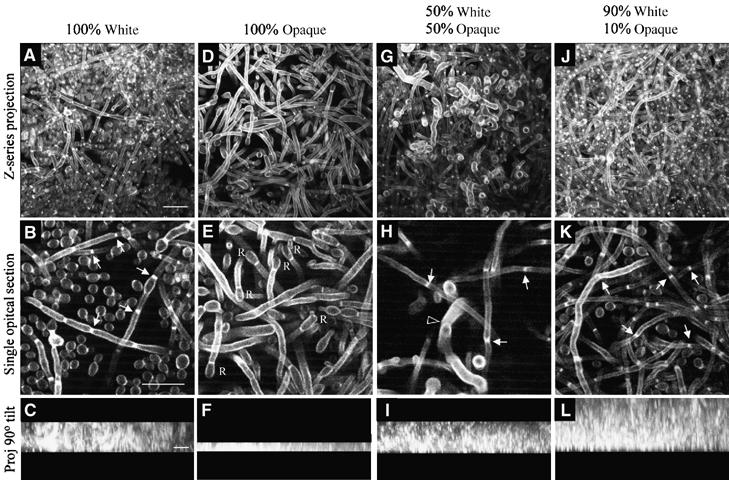
A minority of opaque cells enhance white cell biofilm development. Different proportions of white and opaque cells were mixed and the same total number of cells spread on a silicon elastomer. After 90 min of undisturbed incubation, the elastomers were gently rinsed, then flooded with fresh growth medium and gently rocked for 48 h. In all combinations, white cells were 50% a/a and 50% α/α, and opaque cells 50% a/a and 50% α/α. In all combinations, a monolayer of cells covered the elastomer at the initiation of rocking which reflected the proportions of white and opaque cells initially inoculated. (A, D, G, J) Z-series projection of multiphoton LSCM scans through the biofilm. (B, E, H, K) Single optical section in the middle of the biofilm. (C, F, I, L) Z-series projections viewed from the side (90° tilt). At the end of the incubation period, the top of each gel was identified by a precipitous decrease in pixel intensity. The small solid arrows in (B), (H) and (K) point to septae in hyphae. The unfilled arrowhead in (H) points to a conjugation tube. ‘R's in (E) refer to apical reversion to the budding growth form at the ends of conjugation tubes that have failed to fuse. Scale bar in the first image for each horizontal row represents 10 μm.
In the preceding mixing experiments, both the white and the opaque cell components were always composed of half a/a and half α/α cells. For opaque cells, we assumed that the mixture cross-stimulated pheromone production. To test this assumption, biofilms were generated from 90% white a/a or α/α cells, and 10% opaque α/α or 10% opaque a/a cells, respectively. The thickness of the biofilm generated by these mixtures were then compared with biofilms generated from mixtures of white a/a or white α/α cells mixed with a mixture of opaque a/a plus opaque α/α cells. The thickness of biofilms formed by mixtures of white a/a and opaque α/α cells, or white α/α and opaque a/a cells were enhanced, but enhancement was far below that achieved when opaque cells included a mixture of a/a and α/α cells (Table II). These results suggested that cross-stimulation between opaque a/a and opaque α/α cells was necessary for maximum enhancement of majority white cell biofilms.
Does a majority white cell biofilm facilitate chemotropism between minority opaque cells?
To explore this key component of our hypothesis, we dispersed mixtures of 10% opaque cells (half a/a, half α/α) and 90% white cells (half a/a, half α/α) on filters in the chamber described in Figure 8A. The opaque a/a cells were vitally stained green with fluorescein-conjugated ConA and the opaque α/α cells were vitally stained red with rhodamine-conjugated ConA. The mixture was incubated undisturbed for 48 h. Preparations were then treated with calcofluor, which stained all cells blue. Hence, opaque a/a cells stained green, opaque α/α cells stained red, and white cells, white cell hyphae and opaque cell conjugation tubes stained blue. Multiphoton microscopy and LSCM were employed to locate fields in the upper region of the biofilm that contained both a green cell (opaque a/a) and a red cell (opaque α/α) within an arbitrary distance of 25 cell diameters, which had each extended conjugation tubes (blue). Assessment of conjugation tube orientation is diagrammed in Figure 8B. In 18 of 20 cases (90%) in which an opaque a/a cell and an opaque α/α cell with tubes were within 25 cell diameters of one another, the tubes of both opaque cells were positively oriented (i.e., +, +) (Figure 8C, D and E). In three additional examples, we identified a red (α/α) and green (a/a) cell separated by over 50 cell diameters in each case with conjugation tubes oriented towards one another (i.e., +, +), suggesting that the distances over which effective gradients are formed and maintained can be extremely large in a biofilm.
Figure 8.
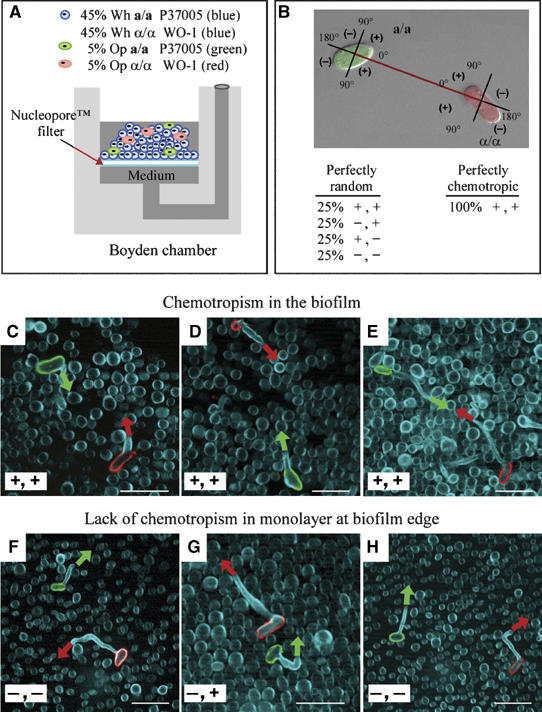
Majority white cell biofilms promote chemotropism between rare opaque a/a and opaque α/α cells. (A) Diagram of the modified Boyden chamber that was employed. The upper well was inoculated with 45% white a/a cells, 45% white α/α cells, 5% opaque a/a cells vitally stained green with fluorescein-conjugated ConA and 5% opaque α/α cells vitally stained red with rhodamine-conjugated ConA. Medium was replenished from below after 24 h. After 48 h at 29°C, cells were fixed, stained with calcofluor (Blue) and imaged by multiphoton LSCM. Cells were visualized in the upper region of the thickest portion of the biofilm or in the monolayer at the biofilm edge. Fields were scanned for a green and red cell that had formed conjugation tubes within 25 cell diameters of each other. (B) The orientation of the conjugation tubes was assessed as diagrammed. (C–E). In the majority of cases in which a red and green cell were observed within 25 cell diameters of one another (18 of 20; 90%) in the three-dimensional upper region of the biofilm proper, their conjugation tubes were oriented in the approximate direction of each other (+, +). (F–H) In the majority of cases in which a red and green cell were observed within 25 cell diameters of one another (16 of 20; 80%) in the two-dimensional monolayer at the edge of the biofilm proper, one or both tubes were oriented away from each other (+, − or −, + or −, −). a/a cells, strain P37005; α/α cells, strain WO-1. Scale bar, 5 μm.
To explore whether the superstructure of the thick biofilm proper facilitated chemotropism, we identified in the monolayer of cells that forms at the outer edge of these biofilms, 20 fields that contained both a green opaque a/a and a red opaque α/α cell within 25 cell diameters of each other, each extending a conjugation tube. In 17 out of 20 cases (85%), one or both tubes were oriented away from the opposing opaque cell (−, + or +, − or −, −); in only three cases (15%) were both tubes oriented towards each other (+, +) (Figure 8F, G and H). Hence, the monolayer did not support chemotropism under the same conditions that supported it in the thick multilayered biofilm matrix, presumably because pheromone gradients dissipated rapidly due to diffusion and perturbation. Similarly, when mixtures of white cells (half a/a, half α/α) and opaque cells (half a/a, half α/α) were dispersed on a plastic surface and allowed to form a monolayer, opaque a/a and opaque α/α cells separated by distances within 25 cell diameters formed conjugation tubes in random directions (data not shown). To demonstrate that the biofilm proper facilitated protected gradients from physical perturbation of pheromone gradients, we repeated the above set of experiments, but this time rocked the culture (Kuhn et al, 2002). After 48 h, 14 of 20 pairs of green (opaque a/a) and red (opaque α/α) cells in the biofilm proper that were within 25 cell diameters of each other had extended tubes in each other's direction (i.e., 70% +,+). In the monolayer at the biofilm edge, 18 of 20 green (opaque a/a) and red (opaque α/α) cell combinations within 25 cell diameters had extended one or both tubes away from the opposing cell (+, − or −, + or −, −) (i.e., 10% +,+).
Additional observations relevant to our hypothesis
Two additional observations are consistent with different aspects of the hypothesis we have proposed. First, because the release of pheromone by an opaque cell in a predominantly white cell biofilm would block opaque cells, but not white cells, of opposite mating type in G1, we would expect that biofilms originally cast with 90% white cells (half a/a, half α/α) and 10% opaque cells (half a/a, half α/α) would contain a far lower proportion of opaque cells (i.e. far lower than 10%) after biofilm development. We found this to be the case. After 48 h of biofilm development, the preparation of opaque cells in these biofilms had decreased to proportions well below 1% (Figure 8C through H). Second, we realized that for chemotropism to occur between opaque a/a and opaque α/α cells in a white cell biofilm, the density of opaque cells would have to be quite low so that gradients between an opaque a/a cell and a neighboring opaque α/α cell could develop without interference from gradients released by other opaque cells in the neighborhood. High densities of opaque cells should, therefore, result in high frequencies of conjugation tube formation, but random a/a and α/α orientation, few fusions, and as a result, a high proportion of apical reversion to the budding growth form. This is exactly what was observed in biofilms cast entirely of opaque cells (half a/a, half α/α) (Figure 7D and E), or 50% opaque cells (half a/a, half α/α) and 50% white cells (half a/a, half α/α) (Figure 7G and H).
Discussion
We have verified our original observation (Lockhart et al, 2003b) that pheromone treatment of white cells selectively upregulates mating-associated genes. We have also verified that the response is selective (Lockhart et al, 2003b). The list of upregulated genes in white cells, however, is far from complete. Most notably, it does not include genes selectively upregulated by pheromone in white but not opaque cells, which we believe exist based on the selective induction of cohesiveness and adhesiveness in white cells, and enhancement of the thickness of predominantly white cell biofilms. The difference in the repertoire of genes upregulated by pheromone suggests differences between white and opaque cells in the pheromone-induced signal transduction pathways.
We have demonstrated with labeled pheromone that untreated white a/a cells express α-pheromone receptors on their surface, as do untreated opaque cells, but the labeling patterns differ. Treatment with α-pheromone resulted in surface receptor downregulation in both white and opaque a/a cells, but receptor relocalization occurred only in opaque cells, presumably because pheromone-treated opaque cells, but not white cells, shmoo (Bennett et al, 2003; Lockhart et al, 2003a).
In speculating about an in vivo scenario of mating, we hypothesized that rare opaque cells appeared in overlapping white a/a and α/α populations in nature, and that the pheromones they released stimulated white cells of opposite mating type to form a biofilm that facilitated chemotropism by protecting soluble pheromone gradients. In support of the first component of this hypothesis, we demonstrated that pheromone rapidly induced white, but not opaque, cells to cohere and form an adhesive film on a substratum. The formation of a tightly packed basal layer of cells on a substratum is a first step in biofilm formation (Hawser and Douglas, 1994; Burscher and van der Mei, 2000; Enos-Berlage and McCarter, 2000; Mukherjee et al, 2005). Pheromone most likely induces the expression of genes encoding surface molecules in white, but not opaque, cells that facilitate the formation of a cohesive basal layer of cells that adheres to a substratum. In a screen for biofilm-defective mutants, Richard et al (2005) identified three genes involved in the early stages of biofilm development, but their deduced functions suggest that none of them would appear to play a direct role in the cohesion or adhesion response we have identified.
We also found that as few as 1% opaque cells mixed with 99% white cells doubled the thickness of the subsequent white cell biofilm that developed. Minority opaque cells also appeared to cause an increase in hypha formation in the mid-region of majority white cell biofilms. Stimulation occurred only when minority opaque cells were derived from both a/a and α/α strains, suggesting that it was necessary for opaque a/a and α/α cells to cross-stimulate each other to release effective levels of pheromone. A variety of genes have been demonstrated to be upregulated during biofilm development (Garcia-Sanchez et al, 2004; Murillo et al, 2005). Several involved in hypha formation, an important component of biofilms (Baillie and Douglas, 1999; Mukherjee et al, 2005), were demonstrated by mutational studies to play a critical role in biofilm development (Ramage et al, 2002; Nobile and Mitchell, 2005). Nobile and Mitchell (2005) demonstrated that the zinc finger protein Bcr1p, which is required for biofilm formation, activates genes encoding cell surface proteins and adhesins, some of them induced during hypha formation. A systematic comparison of the expression of these genes between unenhanced and opaque cell-enhanced white cell biofilms is therefore warranted.
In support of the second component of our hypothesis, we found that the 3D environment in developing white cell biofilms facilitated chemotropism between minority opaque cells of opposite mating type. Chemotropic orientation was observed at distances as great as 50 cell diameters, which represents roughly 100 μm. It seems reasonable to conclude from these experiments that while pheromone gradients are not stable in a 2D environment, they are stable in the 3D environments provided by biofilms. Several observations also suggest that opaque cells may have to be rare within a majority white cell biofilm for chemotropism to proceed. When biofilms were cast with a high proportion of opaque to white cells (e.g., 50:50), the majority of opaque cells formed conjugation tubes, but the tubes were randomly oriented, a result suggesting that the same signal released in opposing directions nulls the development of gradients. We suggest that in the evolution of opaque cell induction of white cell biofilms, opaque cell formation evolved as a rare event to optimize chemotropism.
While signaling between mating types is a general phenomenon in yeast (Fraser and Heitman, 2004), signaling between mating-competent and mating-incompetent cells for reasons other than the induction of the actual mating event, as we have demonstrated here between opaque and white cells, represents a new phenomenon. The induction of white cells by opaque cells to develop a biofilm is in some ways similar to the inductive events between mesoderm and ectoderm in embryonic development (Spemann and Mangold, 1924; Nieuwkoop, 1969), and the inductive events between germ cells and somatically derived follicle cells during germ cell development (Gilchrist et al, 2004). One must therefore wonder whether such inductive events in higher eukaryotes may have evolved from a mating-associated inductive event like that which we have discovered occurs between opaque and white cells in C. albicans.
Materials and methods
Strain maintenance
Cells of the natural strains P37005 (a/a) (Lockhart et al, 2002), L26 (a/a) (Lockhart et al, 1996) and WO-1 (α/α) (Slutsky et al, 1987) were initially plated at 25°C on modified Lee's agar medium (Bedell and Soll, 1979). Cells from 7-day colonies were diluted into liquid modified Lee's medium and grown at 25°C to saturation phase and diluted into fresh medium for experimentation.
Treatment of a/a cells with α-pheromone
The 13-mer α-pheromone (Bennett et al, 2003; Panwar et al, 2003), chemically synthesized by Open BioSystems, Inc. (Huntsville, AL), was dissolved in 50 mM MES buffer, pH 6.1. Saturation phase cultures (2 × 10⁷/ml opaque cells, 1 × 10⁸/ml white cells) were pelleted, resuspended at 107 cells/ml in 1 ml of fresh liquid modified Lee's medium containing 3 × 10⁻⁶ M α-pheromone in a 15 ml Falcon tube, and mixed at 25°C in a rotary water bath shaker at 250 r.p.m.
Northern analysis
Northern analyses were performed as previously described (Srikantha et al, 2005). The primer pairs are provided in Table III.
Table 3.
Primers used in this study for Northern analysis
| Gene | Primer | Sequence |
|---|---|---|
| STE2 | STE2sma1F | 5′-TCC CCC GGG TCA ATG AAT ATC AAT TCA ACT-3′ |
| STE2sma1R | 5′-TCC CCC GGG ATT TAT TAC ACT CTT TTG A-3′ | |
| CEK2 | cek2f | 5′-GGG CTG TAT ATT GGC TGA ACT-3′ |
| cek2r | 5′-TCT AAT GCG TCT TGA ACG GTG-3′ | |
| CEK1 | cek1f | 5′-CGT AGC TAC AAG ATG GTA TAG-3′ |
| cek1r | 5′-TCG TAC CGC CAG TAT TAC TAG-3′ | |
| SST2 | sst2f1 | 5′-AGC CTT AGT TTC TCT AGA GAC GCC-3′ |
| sst2r1 | 5′-TAC CTA TTA CTT GTT ACA CC-3′ | |
| FIG1 | FIG1F | 5′-ATG AAT TTA CCA TAA GTT TGG G-3′ |
| FIG1R | 5′-CAT AGC TTC TGC TCT ACC-3′ | |
| KAR4 | KAR4F | 5′-ATG TAT ACT TAC AAT AAG TTT GGG-3′ |
| KAR4R | 5′-TAC CTC TGT AGC ACC AGA-3′ | |
| CST20 | CST20F | 5′-CTC CAC CAT TCA TTA ATC AGA-3′ |
| CST20R | 5′-CGT ATC ACT ATG GTG GGT ACA-3′ | |
| RBT1 | Rb1f1 | 5′-AGC CAC TGA ATC AGT TCC-3′ |
| Rb1r1 | 5′-ATC AAG AAT GCA GCA ATA CC-3′ | |
| RBT4 | Rb4f1 | 5′-CTT GGG ATG CTA CTG GTT AC-3′ |
| Rb4r1 | 5′-GGT CTC AAG ACA TTT TCA GC-3′ | |
| FGR23 | fg23f1 | 5′-GTG TTT CTA GCA CCT CTA GC-3′ |
| fg23r1 | 5′-GTG CTG GTG CTG TAG TAA TC-3′ | |
| HWP1 | Hwp1f | 5′-CAC AGG TAG ACGGTG AAG GT-3′ |
| Hwp1r | 5′-CAT CCA GAA GTA ACT GGA ACA GAA CTT-3′ | |
| ECE1 | ece1f1 | 5′-TTG CCA CTG GTG TTC AAC-3′ |
| ece1r1 | 5′-CCG ACA GTT TCA ATG CTC-3′ | |
| CBK1 | cbkf1 | 5′-TGA TGG TGG ACG CCA TTC-3′ |
| cbkr1 | 5′-CTT TGG ATT CTT TCT GCC GC-3′ |
Localization of the α-pheromone receptor and nuclear staining
The 13-mer α-pheromone was biotinylated or conjugated with fluorescein by Open BioSystems, Inc. (Huntsville, AL). Washed cells were chilled on ice for 15 min and biotinylated α-pheromone or fluorescein-conjugated α-pheromone was then added to a final concentration of 3 × 10⁻⁶ M or 10−3, respectively. After 15 min, treated cells were resuspended in −20°C methanol, pelleted and rehydrated. Cells were then treated with Oregon Green® streptavidin (Molecular Probes, Eugene, OR) and then imaged using a Bio-Rad Radiance 2100 MP multiphoton LSCM (Bio-Rad, Hermel, Hamstead, UK). Nuclei were stained with Sytox Green™ (Molecular Probes, Eugene, OR) according to methods previously described (Zhao et al, 2005).
Assessing cohesiveness
To measure cohesiveness in suspension, cells from a saturation phase culture were resuspended at 107/ml in nutrient medium containing 3 × 10⁻⁶ M α-pheromone in a 15 ml Falcon tube and cultured at 25°C on a rotary shaker at 250 r.p.m. Samples were removed with a large bored pipette and deposited on a microscope slide. Cells were examined under a coverslip for clumping. To test whether chemically synthesized α-pheromone induced formation of a nascent biofilm of white a/a cells on a plastic surface, cells were inoculated into a well of a Costar™ six-cluster well plate (Costar, Cambridge, MA) containing 2 ml of nutrient medium plus 10−6 M α-pheromone. After 16 h at 29°C, the bottom of the plates were gently washed and examined. To test whether natural a- and α-pheromone released by a/a and α/α cells stimulated formation of a cohesive basal layer of cells on a plastic substratum, white or opaque phase a/a or α/α cells were cultured on the bottom of a well in a Costar™ six-cluster Transwell™ plate (response well) (Costar) that was separated by a porous membrane (0.4 μm pore size Transwell-Clear™ polyester membrane) from an overlying well containing a mixture of opaque a/a and α/α cells (source well), in medium containing 1 μl pepstatinA (Sigma). The plates were incubated undisturbed at 29°C for 16 h, rinsed twice and scraped across the middle with a toothpick. Released material was examined by either phase or DIC microscopy.
Biofilm development
White cells (50:50 a/a and α/α) and opaque cells (50:50 a/a and α/α) were mixed at different proportions to assess whether minority opaque cells enhanced majority white cell biofilm formation. A washed and autoclaved silicone elastomer square (0.04 in thick; Cardiovascular Instrument Corp., Wakefield, MA) was placed in a well of a 12-well cluster plate (Costar®, Corning Inc., Corning, NY), each well filled with 2.5 ml of cell suspension containing a total of 5 × 10⁷ cells in RPMI medium, and incubated at 29°C without agitation for 90 min. The silicone square was then gently rinsed with phosphate buffer saline, placed in a fresh well in RPMI medium, and incubated at 29°C on a rocker (Immunetics, Cambridge, MA) with 60° total deflection every 10 s. After 48 h, the biofilms were fixed in a 37% formalin solution, gently rinsed with 0.1 M Tris–HCl, pH 8.8, and stained with Calcofluor™ White M2R (Fluorescent Brightener 28, Sigma Aldrich, St Louis, MO). Biofilm structure was analyzed by LSCM. Z-series were gathered, projected, rotated and depth measurements obtained using BioRad LaserSharp™ software.
Chemotropism within a biofilm
a/a and α/α opaque cells were vitally stained with fluorescein- and rhodamine-conjugated ConA, respectively, as previously described (Daniels et al, 2003). Unlabeled white cells and ConA-labeled opaque cells were combined in the following ratio: 45% white a/a cells, 45% white α/α cells, 5% fluorescein-ConA-labeled opaque a/a cells and 5% rhodamine-ConA-labeled opaque α/α cells, at a final cell concentration of 1 × 10⁷/ml. Cells were cultured in a Boyden chamber on the upper surface of a Nucleopore™ filter (13 mm polycarbonate poly-vinyl pyrolidone-free with 0.4 μm pores; Fisher Scientific, Hanover Park, IL). The lower well of the Boyden chamber was filled to the level of the filter with modified Lee's medium. The mixed white and opaque cell suspension (300 μl) was then added to the upper surface of the membrane, the upper chamber filled and the apparatus incubated undisturbed at 29°C. Lower well medium was replaced after 24 h with fresh Lee's medium. After 48 h, the filter was fixed by floating in 4% paraformaldehyde-HBSS, stained with Calcofluor™ White M2R and analyzed by LSCM.
Acknowledgments
This work was supported by NIH grant AI2392. Use of the WM Keck Dynamic Image Analysis Facility is acknowledged.
References
- Anderson J, Mihalik R, Soll DR (1990) Ultrastructure and antigenicity of the unique cell wall pimple of the Candida opaque phenotype. J Bacteriol 172: 224–235 [DOI] [PMC free article] [PubMed] [Google Scholar]
- Anderson JM, Soll DR (1987) Unique phenotype of opaque cells in the white–opaque transition of Candida albicans. J Bacteriol 169: 5579–5588 [DOI] [PMC free article] [PubMed] [Google Scholar]
- Baillie GS, Douglas LJ (1999) Role of dimorphism in the development of Candida albicans biofilms. J Med Microbiol 48: 671–679 [DOI] [PubMed] [Google Scholar]
- Bedell G, Soll DR (1979) The effects of low concentrations of zinc on the growth and dimorphism of Candida albicans: evidence for zinc resistant and zinc sensitive pathways for mycelium formation. Infect Immun 26: 348–354 [DOI] [PMC free article] [PubMed] [Google Scholar]
- Bennett RJ, Uhl MA, Miller MG, Johnson AD (2003) Identification and characterization of a Candida albicans mating pheromone. Mol Cell Biol 23: 8189–8201 [DOI] [PMC free article] [PubMed] [Google Scholar]
- Bergen M, Voss E, Soll DR (1990) Switching at the cellular level in the white–opaque transition of Candida albicans. J Gen Microbiol 136: 1925–1936 [DOI] [PubMed] [Google Scholar]
- Birse CE, Irwin MY, Fonzi WA, Sypherd PS (1993) Cloning and characterization of ECE1, a gene expressed in association with cell elongation of the dimorphic pathogen Candida albicans. Infect Immun 61: 3648–3655 [DOI] [PMC free article] [PubMed] [Google Scholar]
- Burscher HJ, van der Mei HC (2000) Initial microbial adhesion events: mechanisms and implications. In SGM Symp 59: Community Structure and Cooperation in Biofilms, Allison D, Gilbert P, Lappin-Scott H, Wilson M (eds) Cambridge, UK: Cambridge University Press [Google Scholar]
- Daniels KJ, Lockhart SR, Sundstrum P, Soll DR (2003) During Candida albicans mating, the adhesin Hwp1 and the first daughter bud localize to the a/a portion of the conjugation bridge. Mol Biol Cell 14: 4920–4930 [DOI] [PMC free article] [PubMed] [Google Scholar]
- Enos-Berlage JL, McCarter LL (2000) Relation of capsular polysaccharide production and colonial cell organization to colony morphology in Vibrio parahaemolytica. J Bacteriol 182: 5513–5520 [DOI] [PMC free article] [PubMed] [Google Scholar]
- Fraser JA, Heitman J (2004) Evolution of fungal sex chromosomes. Mol Microbiol 51: 299–306 [DOI] [PubMed] [Google Scholar]
- Fuller RB (1975) Snyergetics: Explorations in the Geometry of Thinking. New York, NY: Macmillan Publishing Co., Inc [Google Scholar]
- Garcia-Sanchez S, Aubert S, Iraqui I, Janbon G, Ghigo JM, d'Enfert C (2004) Candida albicans biofilms: a developmental state associated with specific and stable gene expression patterns. Euk Cell 3: 536–545 [DOI] [PMC free article] [PubMed] [Google Scholar]
- Gilchrist RB, Ritter LJ, Armstrong DT (2004) Oocyte–somatic cell interactions during follicle development in mammals. Anim Reprod Sci 82-83: 431–446 [DOI] [PubMed] [Google Scholar]
- Haber JE (1998) Mating-type gene switching in Saccharomyces cerevisiae. Annu Rev Genet 32: 561–599 [DOI] [PubMed] [Google Scholar]
- Hawser SP, Douglas LJ (1994) Biofilm formation by Candida species on the surface of catheter materials in vitro. Infect Immun 62: 915–921 [DOI] [PMC free article] [PubMed] [Google Scholar]
- Herskowitz I (1988) Life cycle of the budding yeast Saccharomyces cerevisiae. Microbiol Rev 52: 536–553 [DOI] [PMC free article] [PubMed] [Google Scholar]
- Kuhn DM, Chandrta J, Mukherjee PK, Ghannoum MA (2002) Comparison of biofilms formed by Candida albicans and Candida parapsilosis on biosynthetic surfaces. Infect Immun 70: 878–888 [DOI] [PMC free article] [PubMed] [Google Scholar]
- Kvaal C, Lachke SA, Srikantha T, Daniels D, McCoy J, Soll DR (1999) Misexpression of the opaque phase-specific gene PEP1 (SAP1) in the white phase of Candida albicans confers increased virulence in a mouse model of cutaneous infection. Infect Immun 67: 6652–6662 [DOI] [PMC free article] [PubMed] [Google Scholar]
- Lachke SA, Srikantha T, Soll DR (2003) The regulation of EFG1 in white–opaque switching in Candida albicans involves overlapping promoters. Mol Microbiol 48: 523–536 [DOI] [PubMed] [Google Scholar]
- Lan CY, Newport G, Murillo LA, Jones T, Scherer S, Davis RW, Agabian N (2002) Metabolic specialization associated with phenotypic switching in Candida albicans. Proc Natl Acad Sci USA 99: 14907–14912 [DOI] [PMC free article] [PubMed] [Google Scholar]
- Lockhart SR, Daniels KJ, Zhao R, Wessels D, Soll DR (2003a) Cell biology of mating in Candida albicans. Euk Cell 2: 49–61 [DOI] [PMC free article] [PubMed] [Google Scholar]
- Lockhart SR, Pujol C, Daniels K, Miller M, Johnson A, Soll DR (2002) In Candida albicans, white–opaque switchers are homozygous for mating type. Genetics 162: 737–745 [DOI] [PMC free article] [PubMed] [Google Scholar]
- Lockhart SR, Reed B, Pierson CL, Soll DR (1996) Most frequent scenario for recurrent Candida vaginitis is strain maintenance with ‘substrain shuffling': demonstration by sequential DNA fingerprinting with probes Ca3, C1, and CARE2. J Clin Microbiol 34: 767–777 [DOI] [PMC free article] [PubMed] [Google Scholar]
- Lockhart SR, Zhao R, Daniels KJ, Soll DR (2003b) α-Pheromone-induced shmooing and gene regulation require white–opaque switching during Candida albicans mating. Euk Cell 2: 847–855 [DOI] [PMC free article] [PubMed] [Google Scholar]
- Miller MG, Johnson AD (2002) White–opaque switching in Candida albicans is controlled by mating-type locus homeodomain proteins and allows efficient mating. Cell 110: 293–302 [DOI] [PubMed] [Google Scholar]
- Mukherjee PK, Zhou G, Munyon R, Ghannoum MA (2005) Candida biofilm: a well-designed protected environment. Med Mycol 43: 191–208 [DOI] [PubMed] [Google Scholar]
- Murillo LA, Newport G, Lan CY, Habelitz S, Dungan J, Agabian NM (2005) Genome-wide transcription profiling of the early phase of biofilm formation by Candida albicans. Euk Cell 4: 1562–1573 [DOI] [PMC free article] [PubMed] [Google Scholar]
- Nieuwkoop PD (1969) The formation of the mesoderm in Urodelean amphibians. I. Induction by the endoderm. W Roux' Arch Ent Org 162: 341–373 [DOI] [PubMed] [Google Scholar]
- Nobile CJ, Mitchell AP (2005) Regulation of cell-surface genes and biofilm formation by the C. albicans transcription factor Bcr1p. Curr Biol 15: 1150–1155 [DOI] [PubMed] [Google Scholar]
- Odds FC (1988) Candida and Candidosis, 2nd edn. London, England: Baillier Tindall [Google Scholar]
- Panwar SL, Legrand M, Dignard D, Whiteway M, Magee PT (2003) MFα1, the gene encoding the α mating pheromone of Candida albicans. Euk Cell 2: 1350–1360 [DOI] [PMC free article] [PubMed] [Google Scholar]
- Ramage G, VandeWalle K, Lopez-Ribot JL, Wickes BL (2002) The filamentation pathway controlled by the Efg1 regulator protein is required for normal biofilm formation and development in Candida albicans. FEMS Microbiol Lett 214: 95–100 [DOI] [PubMed] [Google Scholar]
- Richard ML, Nobile CJ, Bruno VM, Mitchell AP (2005) Candida albicans biofilm-defective mutants. Euk Cell 4: 1493–1502 [DOI] [PMC free article] [PubMed] [Google Scholar]
- Rikkerink EH, Magee BB, Magee PT (1988) Opaque–white phenotype transition: a programmed morphological transition in Candida albicans. J Bacteriol 170: 895–899 [DOI] [PMC free article] [PubMed] [Google Scholar]
- Schandel KA, Jenness DD (1994) Direct evidence for ligand-induced internalization of the yeast α-factor pheromone receptor. Mol Cell Biol 14: 7245–7255 [DOI] [PMC free article] [PubMed] [Google Scholar]
- Slutsky B, Staebell M, Anderson J, Risen L, Pfaller M, Soll DR (1987) ‘White–opaque transition': a second high-frequency switching system in Candida albicans. J Bacteriol 169: 189–197 [DOI] [PMC free article] [PubMed] [Google Scholar]
- Soll DR (1992) High frequency switching in Candida albicans. Clin Microbiol Rev 5: 183–203 [DOI] [PMC free article] [PubMed] [Google Scholar]
- Soll DR (2002) Mixed mycotic infections. In Polymicrobial Infection and Disease, Brogden KA, Guthmillen J (eds) pp 335–356. Washington, D.C.: ASM Press [Google Scholar]
- Soll DR (2003) Candida albicans. In Antigenic Variation, Craig A, Scherf A (eds) pp 165–201. London: Academic Press [Google Scholar]
- Soll DR (2006) The mating-type locus and mating of Candida albicans and Candida glabrata. In Molecular Principles of Fungal Pathogenesis, Heitman JH (ed) pp 89–112. Washington DC: ASM Press [Google Scholar]
- Soll DR, Langtimm CJ, McDowell J, Hicks J, Galask R (1987) High frequency switching in Candida strains isolated from vaginitis patients. J Clin Microbiol 25: 1611–1622 [DOI] [PMC free article] [PubMed] [Google Scholar]
- Spemann H, Mangold H (1924) Uber induktion von embryonanlagen durch implantation artfremder organisatoren. Arch Mikr Anat Entw Mech 100: 599–638 [Google Scholar]
- Srikantha T, Soll DR (1993) A white-specific gene in the white–opaque switching system of Candida albicans. Gene 131: 53–60 [DOI] [PubMed] [Google Scholar]
- Srikantha T, Zhao R, Daniels K, Radke J, Soll DR (2005) Phenotypic switching in C. glabrata accompanied by changes in expression of genes with deduced functions in copper detoxification and stress. Euk Cell 4: 1434–1445 [DOI] [PMC free article] [PubMed] [Google Scholar]
- Staab JF, Ferrer CA, Sundstrom P (1996) Developmental expression of a tandemly repeated, proline- and glutamine-rich amino acid motif on hypha surfaces on Candida albicans. J Biol Chem 271: 6298–6305 [DOI] [PubMed] [Google Scholar]
- Stefan CJ, Blumer KJ (1999) A syntaxin homolog encoded by VAM3 mediates down-regulation of a yeast G protein-coupled receptor. J Biol Chem 274: 1835–1841 [DOI] [PubMed] [Google Scholar]
- Weber PC, Wendoloski JJ, Pantoliano MW, Salemme FR (1992) Crystallographic and thermodynamic comparison of natural and synthetic ligands bound to streptavidin. J Am Chem Soc 114: 3197–3200 [Google Scholar]
- Zhao R, Daniels KJ, Lockhart SR, Yeater KM, Hoyer LL, Soll DR. (2005) Unique aspects of gene expression during Candida albicans mating and possible G1 dependency. Euk Cell 4: 1175–1190 [DOI] [PMC free article] [PubMed] [Google Scholar]