

Abstract
Synaptotagmin 2 resembles synaptotagmin 1, the Ca2+ sensor for fast neurotransmitter release in forebrain synapses, but little is known about synaptotagmin 2 function. Here, we describe a severely ataxic mouse strain that harbors a single, destabilizing amino-acid substitution (I377N) in synaptotagmin 2. In Calyx of Held synapses, this mutation causes a delay and a decrease in Ca2+-induced but not in hypertonic sucrose-induced release, suggesting that synaptotagmin 2 mediates Ca2+ triggering of evoked release in brainstem synapses. Unexpectedly, we additionally observed in synaptotagmin 2 mutant synapses a dramatic increase in spontaneous release. Synaptotagmin 1-deficient excitatory and inhibitory cortical synapses also displayed a large increase in spontaneous release, demonstrating that this effect was shared among synaptotagmins 1 and 2. Our data suggest that synaptotagmin 1 and 2 perform equivalent functions in the Ca2+ triggering of action potential-induced release and in the restriction of spontaneous release, consistent with a general role of synaptotagmins in controlling ‘release slots' for synaptic vesicles at the active zone.
Keywords: Calyx of Held, neuromuscular junctions, synaptic transmission, synaptotagmin
Introduction
Synaptotagmin 1 is a synaptic vesicle protein that binds Ca2+ via its two C2-domains and functions as a Ca2+ sensor for fast neurotransmitter release (Perin et al, 1990; Geppert et al, 1994; Fernandez et al, 2001; Fernandez-Chacon et al, 2001). The Ca2+ affinities of the synaptotagmin C2-domains are unphysiologically low (>0.1 mM) in the absence of phospholipids, but are boosted to physiological levels (∼1–20 μM Ca2+) in the presence of phospholipids (Ubach et al, 1998; Zhang et al, 1998; Fernandez et al, 2001). In hippocampal synapses and in chromaffin cells, Ca2+-binding to synaptotagmin 1 determines the Ca2+ affinity of fast exocytosis (Fernandez-Chacon et al, 2001; Sorensen et al, 2003).
In addition to synaptotagmin 1, 14 other synaptotagmins exist that share the same overall domain structure, but differ in expression patterns and biochemical properties. Among the ‘other' synaptotagmins, synaptotagmin 2 most closely resembles synaptotagmin 1 (76% sequence identity in mice), and is the only synaptotagmin besides synaptotagmin 1 that was unequivocally localized to synaptic vesicles (Geppert et al, 1991). Synaptotagmins 1 and 2 both bind to SNARE proteins and phospholipids in a Ca2+-dependent manner, although with distinct apparent Ca2+ affinities (Li et al, 1995a, 1995b; Sugita et al, 2001, 2002; Rickman et al, 2004; Hui et al, 2005). These data suggest that synaptotagmins 1 and 2 perform similar functions. Consistent with this hypothesis, synaptotagmin 2 rescues the synaptotagmin 1 deficiency phenotype in neurons and chromaffin cells (Stevens and Sullivan, 2003; Nagy et al, 2006). However, synaptotagmin 2 has only been studied in overexpression experiments, and it remains unclear whether synaptotagmins 1 and 2 really perform equivalent functions. One reason for this uncertainty is that although synaptotagmins 1 and 2 share many properties, they also exhibit differences. For example, synaptotagmin 1 is primarily present in the forebrain, which contains almost no synaptotagmin 2, whereas synaptotagmin 2 is more abundant in caudal brain areas (Geppert et al, 1991; Ullrich et al, 1994; Marqueze et al, 1995; Berton et al, 1997). Moreover, synaptotagmin 2 but not synaptotagmin 1 selectively binds inositolpolyphosphates (Fukuda et al, 1994; Mehrotra et al, 2000).
Although synaptotagmin 1 has been studied more extensively than synaptotagmin 2, even its functional definition remains incomplete. Loss-of-function mutants of synaptotagmin 1 cause a decrease in fast Ca2+-triggered synchronous release in all preparations tested (Littleton et al, 1993; Nonet et al, 1993; Geppert et al, 1994; Mackler et al, 2002; Yoshihara and Littleton, 2002; Sorensen et al, 2003; Nishiki and Augustine, 2004), but the additional role of synaptotagmin 1 in other forms of release is unclear. Among others, this is illustrated by results with Drosophila synaptotagmin 1 mutants in which an increase of spontaneous release was observed at late larval stages (Littleton et al, 1993; Broadie et al, 1994; DiAntonio and Schwarz, 1994; Mackler et al, 2002), but not at embryonic synapses (Yoshihara and Littleton, 2002), or in larval synapses after acute inactivation of synaptotagmin 1 (Marek and Davis, 2002).
In the present study, we describe mice that contain a point mutation in the synaptotagmin 2 gene. Analysis of synaptic transmission in the Calyx of Held of the mutant mice revealed that Ca2+-triggered synchronous neurotransmitter release is decreased, but spontaneous release is enhanced. We show that synaptotagmin 1-deficient cortical neurons also displayed a similar phenotype. Our data, the first functional analysis of synaptotagmin 2 in neurons and of any synaptotagmin in a central synapse in situ, reveal that synaptotagmin 1 and 2 generally act in triggering evoked release and in limiting spontaneous release. This result is consistent with the notion that in different types of synapses, synaptotagmin 1 and 2 perform analogous functions in ‘release slots' at the active zone (Maximov and Südhof, 2005) where they, possibly in a Ca2+-independent complex with SNARE proteins, simultaneously stabilize primed vesicles in the absence of Ca2+, and trigger the exocytosis of these vesicles in the presence of Ca2+.
Results
An ataxic mouse harboring a point mutation in synaptotagmin 2
Synaptotagmin 2I377N mutant mice were identified in a screen of chemically mutagenized mice by Ingenium Pharmaceuticals, and shown by standard procedures (Russ et al, 2002; Stumm et al, 2002) to carry a single base pair substitution in exon 8 of the synaptotagmin 2 gene. This base pair change causes a nonconservative substitution (I377N) in the seventh β-strand of the C2B-domain (Figures 1A and B). Homozygous synaptotagmin 2I377N mutant mice were viable but infertile, weighed less and were severely uncoordinated (Figures 1C and E). On a force actometer (Fowler et al, 2001), wild-type (WT) mice walked along the edges of the plate, exploring all four sides with even, smooth movements. In contrast, synaptotagmin 2I377N mutant mice stayed in a small sector of the force plate, and moved abruptly with sudden shifts of the head and tail, often appearing to shoot out of the perimeter of the force plate (Figure 1E). Quantitation of the cumulative movements of mice on the force plate showed that the ataxia index was increased >2-fold in synaptotagmin 2I377N mutant mice compared to littermate WT controls (Figure 1F). Heterozygous mutant mice exhibited no change in weight (Figure 1D) or force-plate behavior (data not shown), indicating that the synaptotagmin 2I377N mutation acts recessively.
Figure 1.
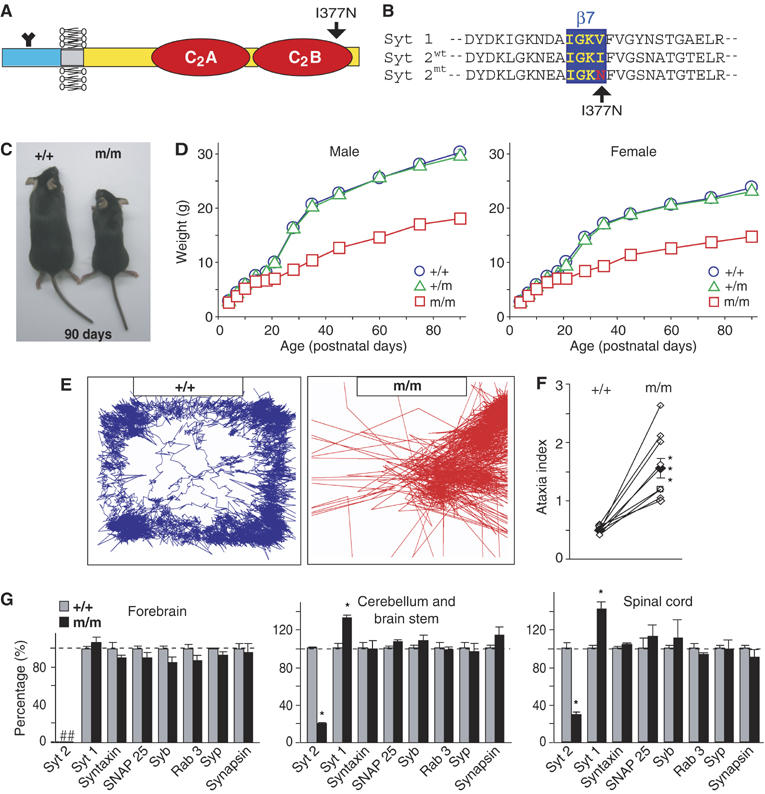
Characterization of synaptotagmin 2I377N mutant mice. (A) Domain structure of synaptotagmin 2; arrow points to position of the I377N substitution. (B) Sequence alignment of WT synaptotagmin 1 and 2 and mutant synaptotagmin 2I377N. (C) Pictures of littermate WT (+/+) and synaptotagmin 2I377N homozygous mutant mice (m/m). (D) Body weights of WT and hetero- and homozygous mutant male and female mice as a function of age (n=10–33). (E) Representative traces of the movements of littermate WT and synaptotagmin 2I377N mutant mice monitored on a force plate. (F) Ataxia indices of eight independent pairs of littermate WT and synaptotagmin 2I377N mutant mice calculated from force-plate traces (***P<0.001). (G) Protein levels in synaptotagmin 2I377N mutant mice (m/m; black) expressed as the percent of WT levels (+/+; gray). Protein levels were determined in three independent pairs of littermate WT and synaptotagmin 2I377N mutant mice using quantitative immunoblotting with 125I-labeled secondary antibodies and PhosphoImager detection. For additional proteins, see Supplementary data. Abbreviations used: syt 1 and syt 2, synaptotagmin 1 and 2; Syb, synaptobrevin; Syp, synaptophysin (*P<0.05). In these and all subsequent figures, data shown are means±s.e.m.'s; statistical significance is assessed with the Student's t-test.
As a first test of how the I337N mutation might alter synaptotagmin 2 function, we measured the levels of synaptotagmin 2 and a series of control proteins in the forebrain, cerebellum and spinal cord from littermate WT and synaptotagmin 2I377N mutant mice (Figure 1G and Supplementary Figure S1). Consistent with earlier studies (Ullrich et al, 1994; Marqueze et al, 1995), synaptotagmin 2 was not detectable in the forebrain, but abundant in caudal brain regions. In the cerebellum and spinal cord from mutant mice, we observed a large decrease in synaptotagmin 2 (to 20–30% of WT levels) but an increase in synaptotagmin 1 (to 130–140% of WT levels; Figure 1G and Supplementary Table 1). No other significant changes were found.
The synaptotagmin 2I377N mutant C2B-domain is unstable but functional
To test the effect of the synaptotagmin 2I377N substitution on the structural and functional properties of the C2B-domain, we examined recombinant WT and I377N-mutant C2B-domains biophysically. The circular dichroism (CD) spectra of WT and mutant C2B-domains were indistinguishable, suggesting that the mutant domain folded correctly (Figure 2A). Thermal denaturation curves in the absence or presence of 5 mM Ca2+ showed that the mutant C2B-domain exhibited a sharp melting point that is shifted by Ca2+ to higher temperatures, consistent with Ca2+-binding to the properly folded mutant C2B-domain (Figure 2B). However, both in the absence and presence of Ca2+, the I377N-mutant C2B-domain was denatured at lower temperatures than the WT C2B-domain (Figure 2C).
Figure 2.
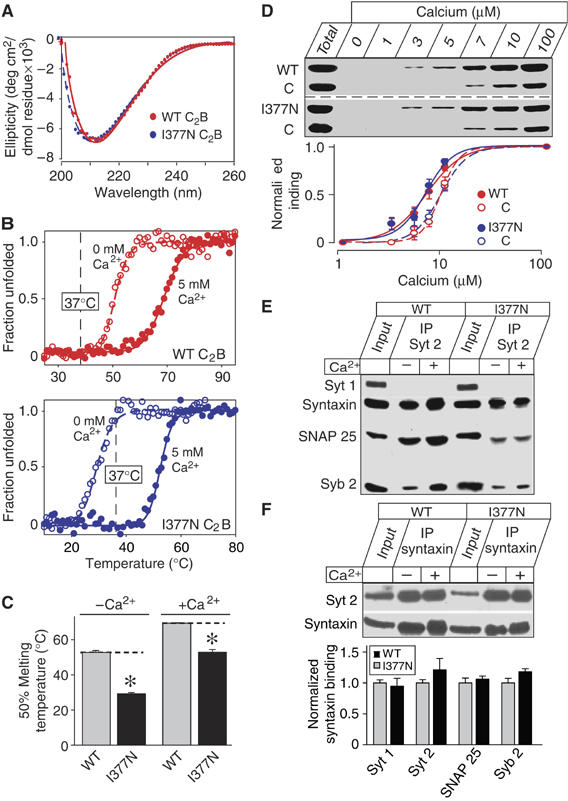
Biochemical characterization of synaptotagmin 2I377N mutant protein. (A, B) CD spectra (A) and thermal denaturation curves (B) of WT and I377N-mutant synaptotagmin 2 C2B domains. Denaturation was monitored by CD at 217 nm without or with 5 mM Ca2+. (C) Mean 50% melting temperature of WT and I377N-mutant C2B-domain without or with 5 mM Ca2+ (*P<0.05). (D) Ca2+-dependent phospholipid binding by the double C2AB-domain fragment from WT and I377N-mutant synaptotagmin 2 (tested as purified GST fusion proteins). Liposomes (25% PS/75% PC) were incubated at the indicated free Ca2+ concentrations with the C2AB-domain fragment of synaptotagmin 2 and the C2-domain of PKCβ (as an internal control); bound C2-domains were measured by SDS–PAGE and Coomassie staining. Upper panel shows a representative Coomassie-stained gel; binding was quantified in multiple independent experiments by scanning of Coomassie-stained gels as shown in lower panel. (E, F) Binding of WT and I337N-mutant synaptotagmin 2 to SNARE complexes analyzed by immunoprecipitations. Synaptotagmin 2 (E) or syntaxin-1 (F) were immunoprecipitated from detergent-solubilized brain extracts from control and synaptotagmin 2I377N mutant mice without or with Ca2+; co-precipitated proteins were examined by immunoblotting (syt 1 and 2=synaptotagmins 1 and 2; Syb 2=synaptobrevin 2). In (F), the amount of synaptotagmins 1 and 2, SNAP-25 and synaptobrevin 2 present in the syntaxin-1 immunoprecipitates in the absence of Ca2+ were quantified using 125I-labeled secondary antibodies and PhosphoImager detection.
We next investigated whether the I377N mutation alters phospholipid- or SNARE-binding by the C2B-domain. We measured phospholipid binding with a centrifugation assay that monitors Ca2+-dependent binding of recombinant C2-domains to liposomes (Fernandez et al, 2001), using the double C2A/B-domain fragment instead of the single C2B-domain because the properties of the normally occurring double C2A/B-domain fragment differ from those of the single domains (Earles et al, 2001; Fernandez-Chacon et al, 2001). To ensure that we did not miss subtle shifts in apparent Ca2+ affinity, we included the PKCβ C2-domain as an internal standard (Figure 2D). We found that the apparent Ca2+ affinities of WT and mutant C2-domains were indistinguishable (WT C2B: EC50=7.0±0.1 μM Ca2+; I377N-mutant C2B: EC50=6.7±0.1 μM Ca2+), but higher than that of the PKC C2-domain (10.0±0.0 μM Ca2+ (n=5)).
We next examined the binding of SNARE proteins to WT and mutant synaptotagmin 2 (Figures 2E and F). We prepared homogenates of the cerebellum and brainstem from WT and synaptotagmin 2I377N mutant mice under conditions favoring SNARE complex assembly, immunoprecipitated synaptotagmin 2 or syntaxin-1 and analyzed the immunoprecipitates by immunoblotting. We found that both WT and I377N-mutant synaptotagmin 2 co-immunoprecipitated with syntaxin-1, SNAP-25 and synaptobrevin-2 (Figures 2E and F). The immunoprecipitations were specific because control antibodies were inactive, and control proteins were not co-immunoprecipitated (data not shown), and because synaptotagmin 1 was not brought down by the synaptotagmin 2 antibodies (Figure 2E). To test whether SNARE proteins bind less well to mutant synaptotagmin 2, or whether binding of synaptotagmin 1 to SNARE proteins is upregulated in mutant synapses, we quantitated the amount of co-immunoprecipitated synaptotagmin 1 and 2 as well as co-immunoprecipitated SNAP-25 and synaptobrevin 2 in syntaxin-1 immunoprecipitates (Figure 2F). However, we found that synaptotagmin 2 mutation did not impair binding of synaptotagmin 2 to immunoprecipitated SNARE complexes, nor did the mutation lead to a compensatory increase in synaptotagmin 1 binding to SNARE complexes. Viewed together, these experiments establish that the synaptotagmin 2I377N mutation impairs the motor behavior of the mutant mice by destabilizing synaptotagmin 2 and depressing synaptotagmin 2 levels without altering the known functional properties of synaptotagmin 2.
Neurotransmitter release in WT and synaptotagmin 2I377N mutant neurons
To measure whether neurotransmitter release is altered in the mutant mice, we examined synaptic transmission in the Calyx of Held synapse, using whole-cell recordings in the MNTB (medial nucleus of the trapezoid body) in acute brainstem slices. Immunofluorescence labeling showed that the Calyx terminals only contain synaptotagmin 2, but no detectable synaptotagmin 1 (Figure 3). In synaptotagmin 2I377N mutant Calyx synapses, staining for synaptotagmin 2 is significantly decreased (Figure 3A) as expected from the decrease in synaptotagmin 2 protein levels in the mutant mice (Figure 1), but no upregulation of synaptotagmin 1 was observed (Figure 3B).
Figure 3.
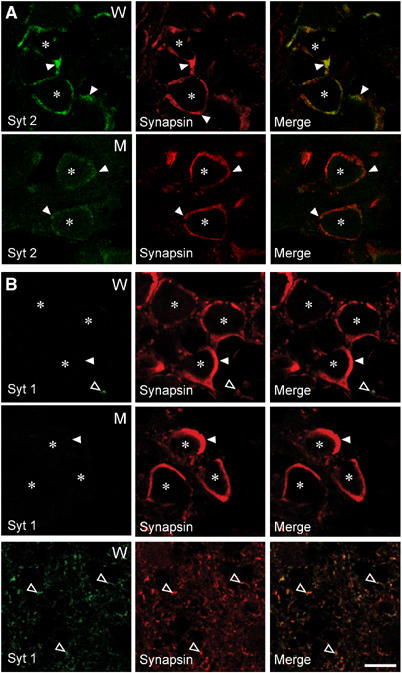
Synaptotagmin 2 but not synaptotagmin 1 is present in Calyx terminals. Panels show double immunofluorescence labeling experiments of brainstem sections from wild-type and synaptotagmin 2I377N mutant mice with antibodies to synaptotagmin 2 (syt 2) and synapsins (A) or to synaptotagmin 1 and synapsins (B). Note that although no synaptotagmin 1 can be detected in wild-type (W) or mutant Calyx terminals (M) in the ventral brainstem, synaptotagmin 1 is abundantly expressed in smaller terminals in the dorsal brainstem (bottom panels in B). Closed arrowheads identify Calyx presynaptic terminals; open arrowheads non-Calyx terminals; *=soma of postsynaptic MNTB neurons. Bar=10 μm.
We first patched presynaptic Calyx terminals and postsynaptic MNTB neurons simultaneously to monitor both presynaptic Ca2+ currents and postsynaptic EPSCs, and stimulated release with a presynaptic depletion protocol (Sakaba and Neher, 2001). According to this protocol, we depolarized the terminals from −80 to +80 mV for 4 ms, partly repolarized them to 0 mV for 50 ms and then returned them to the holding potential of −80 mV (Figure 4A). These experiments were performed with tetrodotoxin (1 μM), kynurenic acid (1 mM), cyclothiazide (0.1 mM) and D-AP-5 (50 μM) in the bath solution.
Figure 4.
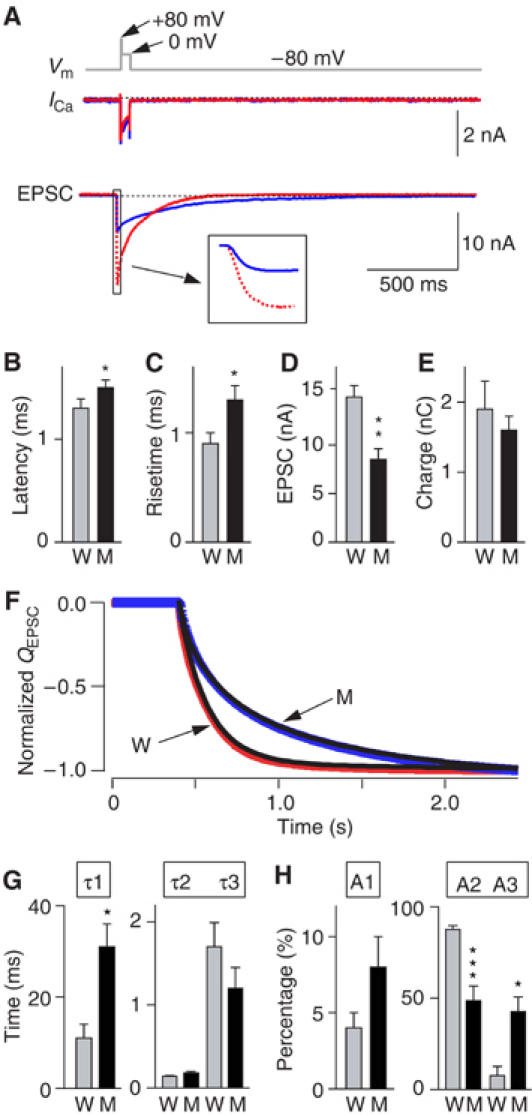
Kinetics of release in Calyx synapses in response to a 50 ms presynaptic depolarization. Simultaneous pre- and postsynaptic voltage-clamp recordings were obtained in brainstem slices from WT and synaptotagmin 2I377N mutant mice at P7–P9 in the presence of 0.1 mM CTZ, 1 mM kynurenic acid and 50 μM D-AP5. (A) Experimental protocol (top gray line) and representative traces of presynaptic Ca2+ currents (ICa) and postsynaptic EPSCs in WT (W; red) and mutant mice (M; blue). In the bottom panels, representative WT and mutant ICa and EPSCs traces are superimposed; inset shows an enlargement of the initial phase of the EPSCs. (B–E) Quantitative comparison of EPSCs from WT and synaptotagmin 2I377N mutant synapses: latencies from the onset of the Ca2+ current to 10% of the EPSC (B), 20–80% rise times (C), amplitudes (D) and synaptic charge transfer integrated over 2 s (E; W: n=12; M: n=14 for B–D; W: n=6; M: n=8 for E). (F). Normalized integrals of EPSC charge transfer over 2 s from littermate WT (W; red) and mutant mice (M; blue). The integration traces are fitted by three-exponential functions (black line, r2>0.9999). (G, H). Time constants (G) and fraction (H) of each component from a three-exponential function fitting for each trace of the integral of EPSCs from WT (n=6) and synaptotagmin 2 mutants (n=8).
We found that synaptotagmin 2I377N mutant synapses exhibited no major change in presynaptic Ca2+ currents (Figure 4A, Supplementary Figure S2), but that the EPSCs displayed a significantly longer latency, slower risetimes and decreased EPSC amplitudes, consistent with a role for synaptotagmin 2 in Ca2+ triggering of release (Figure 4B–D). The total charge transfer, when integrated over 2 s, was not significantly different between WT and mutant synapses (Figure 4E), whereas the kinetics of release was dramatically altered. Plotting the normalized charge transfer as a function of time and fitting it with a three-exponential function (Figure 4F) revealed that the time constant for the first component of release was >2-fold longer for mutant than for WT synapses, while the time constants for the second and third components were unchanged (Figure 4G). Moreover, the relative contributions of the three components to total release changed significantly: in WT synapses, the second component accounted for almost 90% of the total charge transfer, whereas in mutant synapses, the contribution of the second component was halved, but the contribution of the third component increased five-fold (Figure 4H).
To examine release triggered by action potentials (APs), we induced APs by afferent fiber stimulation, and measured postsynaptic responses by whole-cell recordings. The amplitude and charge of the AP-induced EPSCs were significantly smaller in synaptotagmin 2I377N mutant than in WT synapses (Figures 5A and B). In addition, we unexpectedly found that the frequency of unitary release events was dramatically enhanced in synaptotagmin 2I377N mutant synapses (Figure 5C). In the following discussion, we refer to all unitary release events as ‘minis', independent of whether they are recorded from resting synapses or from synapses stimulated by APs. At rest, the miniature EPSC (mEPSC) frequency was potentiated almost five-fold in mutant synapses (Figure 5C). After an AP, the mini frequency was increased in both WT and mutant synapses, but the absolute increase was ∼2-fold higher in mutant than in WT synapses (Figure 5D). The augmentation in mini frequency in synaptotagmin 2I377N mutant synapses, however, was insufficient to compensate for their decrease in synchronous release, because the total charge of the AP-induced EPSC (the sum of synchronous and spontaneous release) when integrated over 100 ms was significantly reduced in synaptotagmin 2I377N mutant synapses (Figure 5B; please note that this result refers to an AP-induced EPSC as opposed to the presynaptic depletion protocol applied in Figure 4E).
Figure 5.
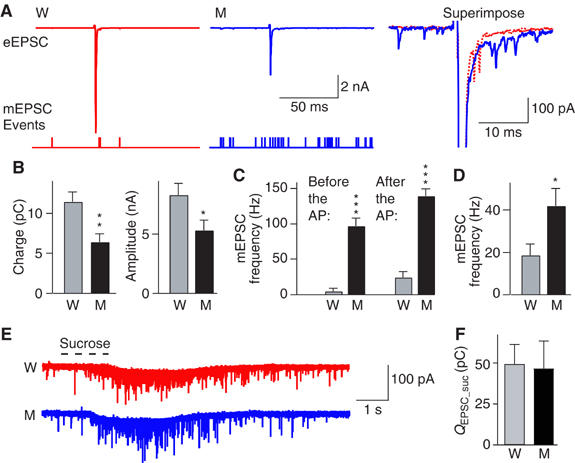
Release evoked by single APs or hypertonic sucrose in Calyx synapses at postnatal day P14. (A) Representative EPSC traces monitored in the presence of bicuculline (10 μM), strychnine (10 μM) and D-AP-5 (50 μM) in response to isolated APs evoked by fiber stimulation (WT=W; red; synaptotagmin 2I377N mutants=M; blue); traces are scaled and superimposed on the right. Below the traces, mEPSC events are indicated as notches. (B) Mean electrical charge transfer (integrated over 100 ms) and amplitude of evoked EPSCs. (C) Frequency of mEPSCs in the 100 ms periods before and after stimulation. (D) Absolute increases in mEPSCs frequency in 100 ms after stimulation (W: n=12; M: n=9). (E) Representative recordings of mEPSCs induced by a 1 s puff of hypertonic sucrose (a glass pipette containing 2 M sucrose positioned ∼5 μm from the Calyx, and puffed the sucrose solution onto the terminal using a 1 s pressure pulse as indicated by the dashed line above the traces) from WT (W; red) and mutant (M; blue). (F) Average charge transfer during hypertonic sucrose-induced mEPSCs from WT (n=4) and mutant (n=4) integrated over 5 s (*P<0.05; **P<0.01; ***P<0.001).
The decrease in evoked release and the increase in spontaneous release could reflect abnormal synaptic vesicle priming that establishes the readily releasable pool of vesicles (RRP). One operational definition of the RRP is the amount of release triggered by the application of hypertonic sucrose, which provokes Ca2+-independent release of vesicles (Rosenmund and Stevens, 1996). To measure the RRP, we puffed 2 M sucrose onto the terminal for 1 s using a glass pipette that was positioned close to the Calyx (<5 μm). Hypertonic sucrose induced a train of mEPSCs; integration of the charge transfer revealed that the WT and synaptotagmin 2I377N mutant synapses produced similar amounts of sucrose-induced release (Figures 5E and F).
Release evoked by AP stimulus trains
We next monitored synaptic responses induced by 40 APs applied at 50 Hz, a physiological stimulation frequency for this synapse (Sommer et al, 1993). In WT synapses, the EPSC amplitudes initially depressed during the stimulus train to stabilize at a steady-state level, but the EPSC time course remained completely synchronous (Figure 6A). Although the initial EPSCs were decreased in synaptotagmin 2I377N mutant synapses, no use-dependent depression was observed, and EPSCs stabilized after ∼5 APs in mutant synapses at the same average amplitude as in WT synapses (Figure 6B). When plotted as normalized data, this behavior manifests as moderate facilitation (Figure 6C). Thus, the increase in residual Ca2+ that presumably accumulates during the high-frequency train ‘rescues' the decrease in synchronous release in synaptotagmin 2I377N mutant synapses; as a result, the mutant synapses exhibit the same amount of neurotransmitter release as WT synapses after ∼5 APs (Figure 6B).
Figure 6.
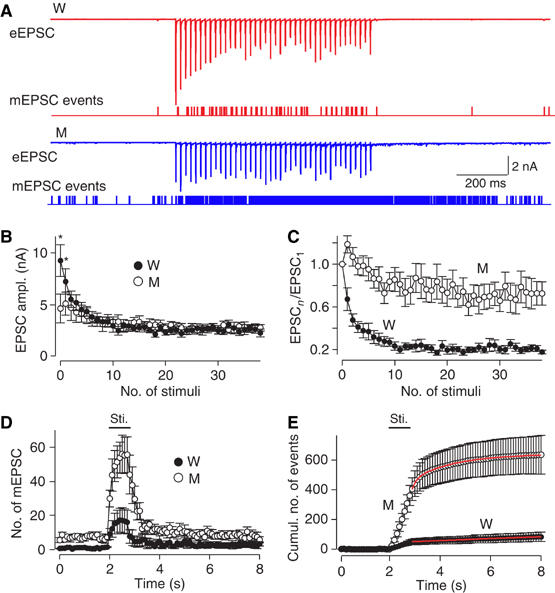
EPSCs evoked by a 50 Hz AP train. (A) Representative traces of EPSCs evoked by 40 APs at 50 Hz (WT, red; synaptotagmin 2I377N mutant, blue). Below the traces, mini events are indicated as notches. (B, C) Absolute (B) and normalized (C) EPSC amplitudes of 40 stimuli at 50 Hz. (D, E) Mini event frequency before, during and after the 50 Hz stimulus train plotted as a function of time as the number of events per 0.1 s interval (D) or as the cumulative number of events after normalization for basal mini release (E; see text for detail). The time of stimulation is indicated by the horizontal bar above the plot (WT, W: n=6, filled symbols; synaptotagmin 2I377N mutant, M: n=5, open symbols).
As observed in response to a single AP, synaptotagmin 2I377N mutant synapses exhibited a massive stimulation-dependent increase in mini frequency during AP trains (Figure 6D). We plotted the cumulative number of minis as a function of time during the stimulus train, and corrected for the increase in mini frequency in mutant synapses by adjusting the slope of cumulative mini events before stimulation to zero (Figure 6E). The corrected plot thus represents the accumulated mini release during and after the stimulus train. According to the slope of the accumulative mini release, the average rate of mini release during stimulation (indicated by the horizontal bar in Figures 6D and E) was estimated as 0.45 vesicle/ms for synaptotagmin 2 mutant synapses and 0.06 vesicle/ms for WT synapses. In synaptotagmin 2 mutant synapses, the latter part of the trace (after 2.8 s) could be fitted with a double-exponential function (τ1=0.21 s (37%), τ2=1.79 s (63%); Figure 6E). In contrast, the WT trace could only be fitted by a single-exponential function with a long time constant (33 s), implying the negligible amount of mini release after stimulation.
Spontaneous neurotransmitter release in WT and synaptotagmin 2I377N mutant neurons
To test whether the increase in mini frequency in synaptotagmin 2I377N mutant synapses reflects an intrinsic alteration of the release machinery or is due to residual bulk Ca2+ remaining after an AP, we systematically examined spontaneous minis in MNTB neurons at rest, both from P7–P9 and from P14 mice, and both in the presence or absence of Ca2+ (Figure 7). We found that at P7–P9 and at P14, the resting mini frequency was dramatically increased in synaptotagmin 2I377N mutant synapses (>6 times at P7–P9; >12 times at P14), whereas the mini amplitudes and rise times were unchanged (Figure 7). Removal of Ca2+ by application of 0.1 mM BAPTA-AM in a Ca2+-free bath solution had no effect on the amplitudes and risetimes of minis, but reduced the frequency of minis in both WT and mutant synapses ∼10-fold (Figure 7B and D). Even under Ca2+-free condition, synaptotagmin 2I377N mutant synapses exhibited an increased mini frequency (∼3 times at P7–P9; ∼5 times at P14). Quantitatively, Ca2+ removal caused a relatively larger decrease in mini frequency in mutant synapses (∼18-fold at P7–P9, ∼12-fold at P14) than in WT synapses (∼5-fold at both P7–P9 and at P14), indicating that although the mini frequency in mutant synapses is enhanced in the absence of Ca2+, it is increased more strongly than in WT synapses by the low levels of Ca2+ present in resting synapses.
Figure 7.
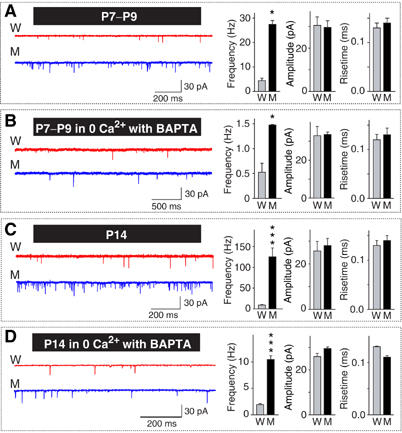
Spontaneous neurotransmitter release in WT and synaptotagmin 21377N mutant neurons. In all panels, representative traces are shown on the left, and summary diagrams for the mini frequency, amplitude and risetimes (20–80% for the calyx; 10–90% for NMJ) on the right. (A, B) Recordings from the calyx at P7–P9 in regular extracellular medium (A; W: n=7; M: n=8) or medium containing 0 mM Ca2+ and 0.1 mM BAPTA-AM (B; W and M: n=6 for both). (C, D) Recordings from the calyx at P14 in regular extracellular medium (C; W: n=8; M: n=9) or medium containing 0 mM Ca2+ and 0.1 mM BAPTA/AM (B; W and M: n=9 and 6, respectively) (*P<0.05; ***P<0.001).
To ensure that the changes observed are not specific to the Calyx synapse, we additionally monitored minis as miniature endplate potentials (mEPPs) in neuromuscular junctions (NMJs) of diaphragm muscle in WT and synaptotagmin 2I377N mutant mice at P16. Again, we detected a massive increase in mini frequency in mutant synapses (Figure 8A), but no changes of mini amplitudes and risetimes. Next, to confirm the generality of the observed effect of Ca2+ on spontaneous release in the Calyx (Figure 7), we tested the effect of Ca2+ on mini frequency in NMJs by recording mEPPs either in Ca2+-free external solution with BAPTA-AM (to ensure that the conditions are totally Ca2+ free) or in external solutions containing 2, 5 or 10 mM Ca2+ (Figure 8C). These recordings were performed at P22 when NMJ development is more mature. As in the Calyx synapse, significant spontaneous release was observed even in the total absence of Ca2+, but was dramatically enhanced with increasing concentrations of Ca2+. At all Ca2+ concentrations examined—both in the complete absence of Ca2+ and in the presence of high extracellular Ca2+ concentrations—the frequency of mEPPs was several fold higher in mutant NMJs than in NMJs from littermate control mice (Figure 8D).
Figure 8.
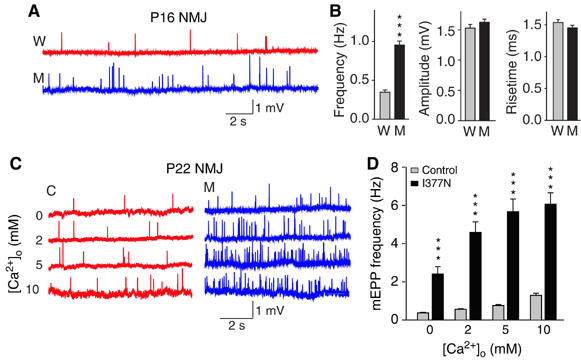
Spontaneous neurotransmitter release at the NMJ. (A, B) Representative traces of mEPPs (A) and summary diagrams of mEPP frequency, amplitude and 10–90% risetimes (B) in diaphragm NMJs from wild-type (W) and synaptotagmin 2I377N mutant mice at P16, recorded in normal Ringer's solution (W: n=57, three mice; M: n=68, three mice). (C, D) Representative traces of mEPPs (C) and summary diagrams of the mEPP frequencies (D) recorded at the indicated Ca2+ concentrations in NMJs from control (C) and synaptotagmin 2I377N mutant mice (M) at P22. Note that the 0 Ca2+ condition included BAPTA-AM to remove nerve terminal Ca2+ (n=25–30, two animals each genotype) (***P<0.001 in B and D).
Deletion of synaptotagmin 1 also increases mini frequency
The properties we describe here for synaptotagmin 2I377N mutant synapses resemble those of the synaptotagmin 1-deficient synapses in mice with one exception: no increase in mini frequency was detected in autapses from such mice (Geppert et al, 1994; Nishiki and Augustine, 2004), although recent analyses of cortical inhibitory synapses from synaptotagmin 1-deficient mice suggested that such an increase may in fact occur (Maximov and Südhof, 2005). To examine this question, we measured the mini frequency in synapses formed by cultured cortical neurons from synaptotagmin 1-deficient mice. We monitored both excitatory and inhibitory synapses, and examined the effects of either lowering or raising the Ca2+ concentration (Figures 9A–D). In resting excitatory and inhibitory synapses, deletion of synaptotagmin 1 enhanced the mini frequency ∼5-fold. Decreasing Ca2+ in the bath depressed, whereas increasing Ca2+ augmented the mini frequency both in WT and mutant synapses; however, under both conditions the large difference between the mutant and WT synapses was retained (Figure 9D). The addition of EGTA-AM to remove intracellular Ca2+ had little further effect on mini frequency in WT and mutant synapses. Thus, synaptotagmin 1-deficient cortical synapses behave very similar to synaptotagmin 2I377N mutant synapses in that an intrinsic difference in mini frequency is present. In synaptotagmin 1-deficient synapses, this difference is not a compensatory change in response to the decrease in release because it persisted even after prolonged treatment of the cultures with TTX, which should abolish all network activity in WT and mutant synapses (Figure 9D).
Figure 9.
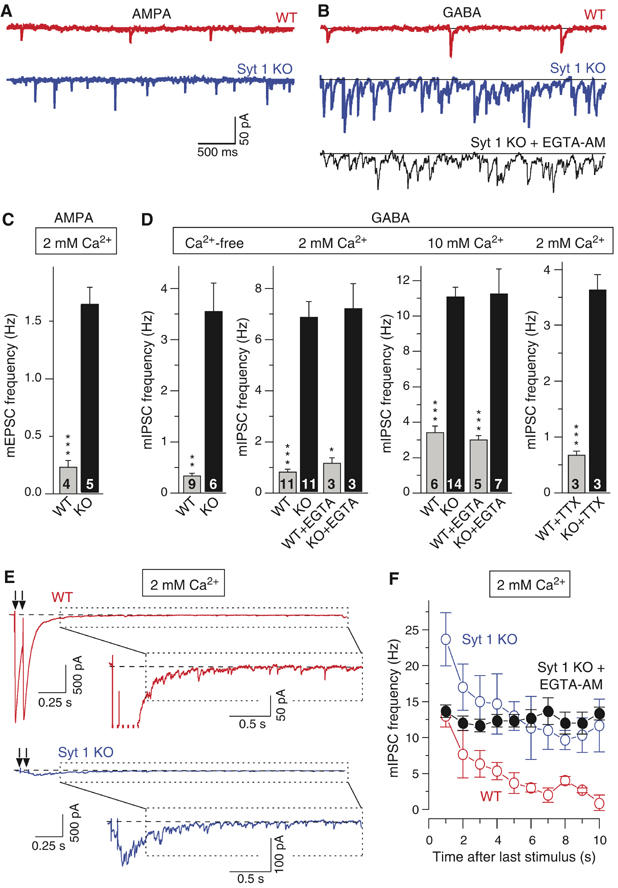
Spontaneous release in synaptotagmin 1-deficient cortical neurons. (A, B) Representative spontaneous mEPSCs (A) and mIPSCs (B) recorded in the presence of acutely added TTX (1 μM) from WT (red) and synaptotagmin 1-deficient neurons (blue). In (B), mIPSCs were also recorded from synaptotagmin 1-deficient neurons preincubated for 5 min in 0.1 mM EGTA-AM (black; holding potential=−70 mV; scale bars apply to all traces). (C, D) Average mEPSC (C) and mIPSC (D) frequencies in WT and synaptotagmin 1-deficient neurons. Extracellular Ca2+ concentrations are indicated on the top; number of cells analyzed are shown in the bars. The 2 and 10 mM Ca2+ experiments were also carried out after a 5 min preincubation of neurons in 0.1 mM EGTA-AM. The 2 mM Ca2+ data on the right were obtained in neurons that were incubated with 1 μM TTX for 4 days prior to the recordings. (E) Representative IPSCs evoked by two closely spaced (0.1 s interval) APs in the presence of AP5 and CNQX. Insets illustrate individual mini events observed at the ends of evoked responses. (F) Plot of the average mIPSC frequency in WT and synaptotagmin 1-deficient neurons after the neurons were stimulated by two APs separated by 0.1 s. Frequencies were calculated in 1 s bins starting 0.5 s after the second AP in the train. Data are from three different WT, synaptotagmin 1-deficient neurons and synaptotagmin 1-deficient neurons preincubated with 0.1 mM EGTA-AM (*P<0.05; **P<0.01; ***P<0.001).
We next applied two closely spaced APs to examine whether stimulation of release increases mini frequency in synaptotagmin 1-deficient neurons. We found that after the APs, the mini frequency was enhanced in both WT and mutant synapses, again with mutant synapses exhibiting a higher frequency (Figures 9E and F). The stimulation-dependent increase in mini frequency in mutant synapses was abolished by EGTA-AM, demonstrating that it is due to the increase in intracellular Ca2+ produced by the APs (Figure 9F).
Discussion
Using mutant mice that carry a single amino-acid substitution (I377N) in synaptotagmin 2, we demonstrate that synaptotagmin 2 is an essential component of the Ca2+-triggering machinery for release in the Calyx of Held synapse. Moreover, we show that impairment of synaptotagmin 2 enhances the rate of spontaneous synaptic vesicle exocytosis, as does deletion of synaptotagmin 1. Our study demonstrates that the normal function of synaptotagmin 2 is analogous to that of synaptotagmin 1, although performed in different neurons, thereby extending the synaptotagmin 1 paradigm to synaptotagmin 2. In addition, our data reveal that synaptotagmin 1 and 2 generally limit spontaneous release at a synapse. These results show that synaptotagmin 1 and 2, as integral components of the release machinery, control initiation of fusion pore opening of synaptic vesicles at the active zone.
Effect of the I377N substitution on synaptotagmin 2
Three observations show that the I377N mutation does not change known functional properties of synaptotagmin 2, but destabilizes synaptotagmin 2 in the brain. First, the I377N-mutant C2B-domain was normally folded (Figure 2A) but exhibited decreased thermal stability (Figures 2B and C). Second, mutant synapotagmin-2I377N exhibited apparently normal Ca2+-dependent phospholipid binding and Ca2+-dependent and Ca2+-independent SNARE binding (Figures 2D–F). Finally, the levels of mutant synaptotagmin 2I377N were selectively decreased ∼5-fold in the brainstem and spinal cord of the mutant mice (Figure 1G). Hence, the phenotypes observed in the I377N-mutant mice likely arise from a reduction in the amount of synaptotagmin 2 protein.
Synaptotagmin 2 functions in the fast Ca2+ triggering of neurotransmitter release
In Calyx synapses, the synaptotagmin 2I377N mutation slowed the time course of release and decreased the EPSC amplitude (Figures 4 and 5). Both the latency and risetime of EPSCs were increased (Figures 4B and C). The size of the RRP, as defined by the amount of release that can be triggered with hypertonic sucrose, was unchanged (Figures 5E and F). Overall, this phenotype resembles that of the synaptotagmin 1 deletion in hippocampal (Geppert et al, 1994) and cortical synapses (Maximov and Südhof, 2005), suggesting that synaptotagmin 1 and 2 perform analogous functions, although in different synapses.
The I377N mutation impairs release in the Calyx synapse less severely than the synaptotagmin 1 deletion in hippocampal or cortical synapses (Geppert et al, 1994; Maximov and Südhof, 2005). This difference is most likely due to the fact that the I377N mutation does not delete synaptotagmin 2, but only decreases its levels (Figure 1, Supplementary Figure S1 and Supplementary Table 1). Thus, residual synaptotagmin 2 may mediate the remaining Ca2+-triggered fast release.
Synaptotagmin function in asynchronous release
Synaptotagmin 1-deficient synapses exhibit no significant change in asynchronous release in response to single APs, but display a selective increase in asynchronous delayed release triggered by trains of APs (Maximov and Südhof, 2005). The delay in the EPSC time course after a 50 ms depolarization in synaptotagmin 2I377N mutant synapses suggests that a similar increase in asynchronous delayed release may be present in the synaptotagmin 2 mutant (Figure 4H). Alternative explanations for this delay are that it is caused by a change in the properties of postsynaptic receptors, such that the receptors remain active longer, or by a decrease in the clearance of glutamate from the synaptic cleft, such that ‘lingering' glutamate continues to activate receptors. The fact that the shape of spontaneous minis and of EPSCs triggered by isolated APs is not altered in synaptotagmin 2I377N mutant neurons makes the two alternative explanations implausible. Moreover, it is difficult to imagine a postsynaptic mechanism for synaptotagmin 2 because synaptotagmin 2 is highly enriched in presynaptic vesicles. This indicates that, as previously demonstrated for synaptotagmin 1 mutants (Maximov and Südhof, 2005), the synaptotagmin 2 mutants may exhibit an increase in delayed release.
Synaptotagmin 1 and 2 function in spontaneous ‘mini' release
In synaptotagmin 2I377N mutant mice, Calyx and NMJ synapses exhibited large increases in mini frequency at rest, after removal of Ca2+, and after stimulation by APs (Figures 5, 6, 7 and 8). Thus, the synaptotagmin 2 mutation increases both spontaneous Ca2+-independent fusion and fusion induced by residual Ca2+ after an AP. The increase in spontaneous fusion is not a peculiar effect of the I377N mutation, but reflects a general participation of synaptotagmins in spontaneous exocytosis because we observed a comparable increase in mini frequency in both excitatory and inhibitory synapses in cortical neurons from synaptotagmin 1-deficient mice (Figure 9). This increase again was Ca2+-independent, and was not due to a homeostatic effect because the difference was retained after chronic treatment with TTX. Furthermore, in synaptotagmin 1-deficient cortical neurons, minis were also increased after AP stimulation (Figures 9E and F).
Previous studies obtained conflicting data on minis in synaptotagmin mutants. In autapses formed by cultured hippocampal neurons, deletion of synaptotagmin 1 consistently does not increase spontaneous release (e.g., see Geppert et al, 1994; Shin et al, 2003; Nishiki and Augustine, 2004). However, in the NMJ of Drosophila, deletion of synaptotagmin 1 increased mini frequency at least under certain conditions (Littleton et al, 1993; Broadie et al, 1994; DiAntonio and Schwarz, 1994, see discussion in the Introduction), and overexpression of synaptotagmin 1 or 2 in frog NMJs inhibited spontaneous release (Morimoto et al, 1998). We observed an increase in mini frequency for mutations in two different synaptotagmins (synaptotagmin 1 and 2) and four different synapses (the Calyx of Held synapse, the NMJ, and excitatory and inhibitory cortical synapses), suggesting that the lack of this phenotype in autapses is peculiar to that system, and that synaptotagmin 1 and 2 mutations truly alter spontaneous fusion. Moreover, in cultured neurons this phenotype was not abolished by activity blockade (Figure 9D), demonstrating that the mini frequency increase is not a secondary phenomenon of decreased synaptic activity.
Implications for the mechanism of Ca2+ triggering of fast release by synaptotagmin 1 and 2
Together with earlier data, our results demonstrate that synaptotagmin 1 and 2 are not passive inhibitors of fusion that block a constitutive fusion reaction because the total amount of Ca2+-dependent fusion is dramatically decreased in the absence of synaptotagmins. Conversely, synaptotagmin 1 and 2 do not simply act separately from the fusion machinery but are intrinsic components of this machinery because in their absence, spontaneous fusion, even under totally Ca2+-free conditions, is enhanced. Previous observations showed that synaptotagmin 1 is unlikely to be a component of the fusion pore (Sorensen et al, 2003). Consistent with these observations, we thus propose that synaptotagmin 1 and 2 bind to assembled SNARE complexes during priming (Shin et al, 2003; Rickman et al, 2004) to achieve two effects: first, to inhibit spontaneous fusion and evoked fusion triggered by low Ca2+ concentrations that are unable to activate synaptotagmin 1 and 2, and second, to position synaptotagmin 1 and 2 close to where the fusion pore will form, presumably by SNARE proteins. This model suggests Ca2+ flowing into the terminal during an AP triggers fusion pore opening by binding to the synaptotagmin C2-domains, which in turn causes these C2-domains to bind to the phospholipid membrane, thereby inducing a mechanical stress on the membrane that is instrumental in catalyzing fusion pore opening.
Although this hypothesis accounts for all currently available data, it raises questions that need to be addressed before it can be considered plausible. A key question relates to SNARE binding: if Ca2+-independent binding of SNAREs by synaptotagmin 1 and 2 is crucial, why do synaptotagmins additionally bind to SNAREs in a Ca2+-dependent manner? Another question regards the role of complexins that bind to SNARE complexes and are essential for normal Ca2+ triggering of release, but whose action is obscure (McMahon et al, 1995; Reim et al, 2001). A third question concerns the nature of asynchronous release during and after APs. Clearly, additional Ca2+ sensors must exist, but do these trigger release analogous to, but slower than synaptotagmin 1 and 2, or do these Ca2+ sensors simply act indirectly by accelerating reactions upstream of the final fusion step? Future experiments using additional tools that need to be developed will have to address these issues.
Materials and methods
Generation, breeding and analysis of synaptotagmin 2I377N mutant mice
Synaptotagmin 2I377N mutant mice were generated by Ingenium Pharmaceuticals in a screen of chemically mutagenized mice (Russ et al, 2002; Stumm et al, 2002). All analyses described were performed on littermate offspring of heterozygous matings to control for background effects.
Behavioral assays
Force-plate actometry (Fowler et al, 2001) was performed with 3-month-old mice on a force plate (28 cm × 28 cm) for 6 min. The ataxia index was calculated from the area:distance ratio measured from the movement traces monitored over 6 min (normal range: 0.26–0.60).
Expression and purification of recombinant proteins
WT and I377N-mutant synaptotagmin 2 and PKC C2-domain expression vectors in pGEX-KG were described previously (Guan and Dixon, 1991; Sugita et al, 2001) or generated by mutagenesis. Recombinant C2B-domain proteins were stripped of their bacterial contaminants by treatment with benzonase and extensive washing as described (Ubach et al, 2001; see Supplementary data).
Centrifugation phospholipid binding assays
Ca2+-dependent phospholipid binding assays were carried out with purified soluble GST fusion proteins in 50 mM HEPES–NaOH, pH 6.8, 0.1 M NaCl and 4 mM Na2EGTA using a centrifugation assay (Fernandez et al, 2001; Shin et al, 2002, 2003).
CD spectra
CD spectra were recorded on an Aviv model 62 DS spectropolarimeter at 200 to 260 nm using a 1 mm path-length cell. Thermal denaturation curves were collected by monitoring the absorption at 217 nm, with or without 5 mM Ca2+. The fraction of unfolded protein at each temperature was calculated by using the formula (Iobs−If)/(Iu−If), where Iobs is the observed signal intensity, and Iu and If are the signal intensities of the unfolded and folded states, respectively. Iu and If as a function of temperature were calculated by extrapolation of the linear regions at the extremes of the unfolding curves.
Immunoprecipitations were performed from brain homogenates using synaptotagmin 2 polyclonal (A320) or syntaxin monoclonal (HPC-1) antibodies essentially as described (Shin et al, 2003).
Immunofluorescence labeling of brainstem cryostat sections was performed with antibodies to synaptotagmins 1 or 2 and to synapsins (syt 1: 41.1, 1:5000; syt 2: A320, 1:500; synapsin: Cl10.22, 1:1000 or E028, 1:1000) essentially as described (Ullrich et al, 1994, see Supplementary data).
Brain slicing and whole-cell recordings from MNTB neurons
Preparation of slices (200 μm thickness), simultaneous whole-cell recordings of the nerve terminal and the postsynaptic neuron were performed mostly as described (Borst et al, 1995; Wu and Borst, 1999). Presynaptic whole-cell recordings were made with an EPC-9 amplifier (HEKA, Lambrecht, Germany) and postsynaptic recordings with an Axopatch 200B amplifier (Axon Instruments Inc., Foster City, CA). The pre- and postsynatpic series resistances (<15 MΩ) were compensated by 60 and 98% (lag 10 μs), respectively. Both pre- and postsynaptic currents were low-pass filtered at 5 kHz and digitized at 20 kHz. mEPSCs were analyzed by a home-made program in Igor, which automatically recognizes individual single mini events in the trace.
NMJ recordings
Intracellular recordings from isolated whole diaphragm were made using an Axoclamp 2B amplifier in normal Ringer's solution (for Figure 8A: 136.8 mM NaCl, 5 mM KCl, 1 mM MgCl2, 1 mM NaH2PO4, 12 mM NaHCO3, 11 mM D-glucose and 2 mM CaCl2) or in HEPES buffer for the Ca2+ titrations (Figure 8B: 140 mM NaCl, 5 mM KCl, 1 mM MgCl2, 10 mM HEPES, 10 mM glucose, pH 7.4) with a sharp electrode containing 3 M KCl. mEPPs were analyzed by minianalysis software (Synaptosoft Inc., NJ).
Neuronal cortical cultures from E18 or P1 pups of WT or synaptotagmin 1-deficient mice were obtained and used for recordings as described (Maximov and Südhof, 2005).
Statistical analysis
All data are presented as means±s.e.m.'s, and were analyzed using the two-tailed paired Student's t-test.
Supplementary Material
Supplementary Information
Acknowledgments
We thank Armin Bareiss, Dr Gabi Stumm and Michael Ade (Ingenium Pharmaceuticals) for the generation, identification and supply of synaptotagmin 2I377N mice; these mice can be obtained from Ingenium Pharmaceuticals (michael.ade@ingenium-ag.com). We also thank Drs Weichun Lin and Yun Liu for help of electrophysiology for NMJs, Dr Rolf Joho for actometry and Han Dai for help with the CD experiments.
References
- Berton F, Iborra C, Boudier JA, Seagar MJ, Marqueze B (1997) Developmental regulation of synaptotagmin I, II, III, and IV mRNAs in the rat CNS. J Neurosci 17: 1206–1216 [DOI] [PMC free article] [PubMed] [Google Scholar]
- Borst JG, Helmchen F, Sakmann B (1995) Pre- and postsynaptic whole-cell recordings in the medial nucleus of the trapezoid body of the rat. J Physiol 489 (Part 3): 825–840 [DOI] [PMC free article] [PubMed] [Google Scholar]
- Broadie K, Bellen HJ, DiAntonio A, Littleton JT, Schwarz TL (1994) Absence of synaptotagmin disrupts excitation–secretion coupling during synaptic transmission. Proc Natl Acad Sci USA 91: 10727–10731 [DOI] [PMC free article] [PubMed] [Google Scholar]
- DiAntonio A, Schwarz TL (1994) The effect on synaptic physiology of synaptotagmin mutations in Drosophila. Neuron 12: 909–920 [DOI] [PubMed] [Google Scholar]
- Earles CA, Bai J, Wang P, Chapman ER (2001) The tandem C2 domains of synaptotagmin contain redundant Ca2+ binding sites that cooperate to engage t-SNAREs and trigger exocytosis. J Cell Biol 154: 1117–1123 [DOI] [PMC free article] [PubMed] [Google Scholar]
- Fernandez I, Arac D, Ubach J, Gerber SH, Shin O, Gao Y, Anderson RG, Sudhof TC, Rizo J (2001) Three-dimensional structure of the synaptotagmin 1 C2B-domain: synaptotagmin 1 as a phospholipid binding machine. Neuron 32: 1057–1069 [DOI] [PubMed] [Google Scholar]
- Fernandez-Chacon R, Konigstorfer A, Gerber SH, Garcia J, Matos MF, Stevens CF, Brose N, Rizo J, Rosenmund C, Sudhof TC (2001) Synaptotagmin I functions as a calcium regulator of release probability. Nature 410: 41–49 [DOI] [PubMed] [Google Scholar]
- Fowler SC, Birkestrand BR, Chen R, Moss SJ, Vorontsova E, Wang G, Zarcone TJ (2001) A force-plate actometer for quantitating rodent behaviors: illustrative data on locomotion, rotation, spatial patterning, stereotypies, and tremor. J Neurosci Methods 107: 107–124 [DOI] [PubMed] [Google Scholar]
- Fukuda M, Aruga J, Niinobe M, Aimoto S, Mikoshiba K (1994) Inositol-1,3,4,5-tetrakisphosphate binding to C2B domain of IP4BP/synaptotagmin II. J Biol Chem 269: 29206–29211 [PubMed] [Google Scholar]
- Geppert M, Archer BT III, Sudhof TC (1991) Synaptotagmin II. A novel differentially distributed form of synaptotagmin. J Biol Chem 266: 13548–13552 [PubMed] [Google Scholar]
- Geppert M, Goda Y, Hammer RE, Li C, Rosahl TW, Stevens CF, Sudhof TC (1994) Synaptotagmin I: a major Ca2+ sensor for transmitter release at a central synapse. Cell 79: 717–727 [DOI] [PubMed] [Google Scholar]
- Guan KL, Dixon JE (1991) Eukaryotic proteins expressed in Escherichia coli: an improved thrombin cleavage and purification procedure of fusion proteins with glutathione S-transferase. Anal Biochem 192: 262–267 [DOI] [PubMed] [Google Scholar]
- Hui E, Bai J, Wang P, Sugimori M, Llinas RR, Chapman ER (2005) Three distinct kinetic groupings of the synaptotagmin family: candidate sensors for rapid and delayed exocytosis. Proc Natl Acad Sci USA 102: 5210–5214 [DOI] [PMC free article] [PubMed] [Google Scholar]
- Li C, Davletov BA, Sudhof TC (1995a) Distinct Ca2+ and Sr2+ binding properties of synaptotagmins. Definition of candidate Ca2+ sensors for the fast and slow components of neurotransmitter release. J Biol Chem 270: 24898–24902 [DOI] [PubMed] [Google Scholar]
- Li C, Ullrich B, Zhang JZ, Anderson RG, Brose N, Sudhof TC (1995b) Ca2+-dependent and -independent activities of neural and non-neural synaptotagmins. Nature 375: 594–599 [DOI] [PubMed] [Google Scholar]
- Littleton JT, Stern M, Schulze K, Perin M, Bellen HJ (1993) Mutational analysis of Drosophila synaptotagmin demonstrates its essential role in Ca2+-activated neurotransmitter release. Cell 74: 1125–1134 [DOI] [PubMed] [Google Scholar]
- Mackler JM, Drummond JA, Loewen CA, Robinson IM, Reist NE (2002) The C2B Ca2+-binding motif of synaptotagmin is required for synaptic transmission in vivo. Nature 418: 340–344 [DOI] [PubMed] [Google Scholar]
- Marek KW, Davis GW (2002) Transgenically encoded protein photoinactivation (FlAsH-FALI): acute inactivation of synaptotagmin I. Neuron 36: 805–813 [DOI] [PubMed] [Google Scholar]
- Marqueze B, Boudier JA, Mizuta M, Inagaki N, Seino S, Seagar M (1995) Cellular localization of synaptotagmin I, II, and III mRNAs in the central nervous system and pituitary and adrenal glands of the rat. J Neurosci 15: 4906–4917 [DOI] [PMC free article] [PubMed] [Google Scholar]
- Maximov A, Südhof TC (2005) Autonomous function of synaptotagmin 1 in triggering synchronous release independent of asynchronous release. Neuron 48: 547–554 [DOI] [PubMed] [Google Scholar]
- McMahon HT, Missler M, Li C, Sudhof TC (1995) Complexins: cytosolic proteins that regulate SNAP receptor function. Cell 83: 111–119 [DOI] [PubMed] [Google Scholar]
- Mehrotra B, Myszka DG, Prestwich GD (2000) Binding kinetics and ligand specificity for the interactions of the C2B domain of synaptogmin II with inositol polyphosphates and phosphoinositides. Biochemistry 39: 9679–9686 [DOI] [PubMed] [Google Scholar]
- Morimoto T, Wang XH, Poo MM (1998) Overexpression of synaptotagmin modulates short-term synaptic plasticity at developing neuromuscular junctions. Neuroscience 82: 969–978 [DOI] [PubMed] [Google Scholar]
- Nagy G, Kim JH, Pang ZP, Matti U, Rettig J, Sudhof TC, Sorensen JB (2006) Different effects on fast exocytosis induced by synaptotagmin 1 and 2 isoforms and abundance, but not by phosphorylation. J Neurosci 26: 632–643 [DOI] [PMC free article] [PubMed] [Google Scholar]
- Nishiki T, Augustine GJ (2004) Synaptotagmin I synchronizes transmitter release in mouse hippocampal neurons. J Neurosci 24: 6127–6132 [DOI] [PMC free article] [PubMed] [Google Scholar]
- Nonet ML, Grundahl K, Meyer BJ, Rand JB (1993) Synaptic function is impaired but not eliminated in C. elegans mutants lacking synaptotagmin. Cell 73: 1291–1305 [DOI] [PubMed] [Google Scholar]
- Perin MS, Fried VA, Mignery GA, Jahn R, Sudhof TC (1990) Phospholipid binding by a synaptic vesicle protein homologous to the regulatory region of protein kinase C. Nature 345: 260–263 [DOI] [PubMed] [Google Scholar]
- Reim K, Mansour M, Varoqueaux F, McMahon HT, Sudhof TC, Brose N, Rosenmund C (2001) Complexins regulate a late step in Ca2+-dependent neurotransmitter release. Cell 104: 71–81 [DOI] [PubMed] [Google Scholar]
- Rickman C, Archer DA, Meunier FA, Craxton M, Fukuda M, Burgoyne RD, Davletov B (2004) Synaptotagmin interaction with the syntaxin/SNAP-25 dimer is mediated by an evolutionarily conserved motif and is sensitive to inositol hexakisphosphate. J Biol Chem 279: 12574–12579 [DOI] [PubMed] [Google Scholar]
- Rosenmund C, Stevens CF (1996) Definition of the readily releasable pool of vesicles at hippocampal synapses. Neuron 16: 1197–1207 [DOI] [PubMed] [Google Scholar]
- Russ A, Stumm G, Augustin M, Sedlmeier R, Wattler S, Nehls M (2002) Random mutagenesis in the mouse as a tool in drug discovery. Drug Discov Today 7: 1175–1183 [DOI] [PubMed] [Google Scholar]
- Sakaba T, Neher E (2001) Quantitative relationship between transmitter release and calcium current at the calyx of held synapse. J Neurosci 21: 462–476 [DOI] [PMC free article] [PubMed] [Google Scholar]
- Shin OH, Rhee JS, Tang J, Sugita S, Rosenmund C, Sudhof TC (2003) Sr2+ binding to the Ca2+ binding site of the synaptotagmin 1 C2B domain triggers fast exocytosis without stimulating SNARE interactions. Neuron 37: 99–108 [DOI] [PubMed] [Google Scholar]
- Shin OH, Rizo J, Sudhof TC (2002) Synaptotagmin function in dense core vesicle exocytosis studied in cracked PC12 cells. Nat Neurosci 5: 649–656 [DOI] [PubMed] [Google Scholar]
- Sommer I, Lingenhohl K, Friauf E (1993) Principal cells of the rat medial nucleus of the trapezoid body: an intracellular in vivo study of their physiology and morphology. Exp Brain Res 95: 223–239 [DOI] [PubMed] [Google Scholar]
- Sorensen JB, Fernandez-Chacon R, Sudhof TC, Neher E (2003) Examining synaptotagmin 1 function in dense core vesicle exocytosis under direct control of Ca2+. J Gen Physiol 122: 265–276 [DOI] [PMC free article] [PubMed] [Google Scholar]
- Stevens CF, Sullivan JM (2003) The synaptotagmin C2A domain is part of the calcium sensor controlling fast synaptic transmission. Neuron 39: 299–308 [DOI] [PubMed] [Google Scholar]
- Stumm G, Russ A, Nehls M (2002) Deductive genomics: a functional approach to identify innovative drug targets in the post-genome era. Am J Pharmacogenomics 2: 263–271 [DOI] [PubMed] [Google Scholar]
- Sugita S, Han W, Butz S, Liu X, Fernandez-Chacon R, Lao Y, Sudhof TC (2001) Synaptotagmin VII as a plasma membrane Ca2+ sensor in exocytosis. Neuron 30: 459–473 [DOI] [PubMed] [Google Scholar]
- Sugita S, Shin OH, Han W, Lao Y, Sudhof TC (2002) Synaptotagmins form a hierarchy of exocytotic Ca2+ sensors with distinct Ca2+ affinities. EMBO J 21: 270–280 [DOI] [PMC free article] [PubMed] [Google Scholar]
- Ubach J, Lao Y, Fernandez I, Arac D, Sudhof TC, Rizo J (2001) The C2B domain of synaptotagmin I is a Ca2+-binding module. Biochemistry 40: 5854–5860 [DOI] [PubMed] [Google Scholar]
- Ubach J, Zhang X, Shao X, Sudhof TC, Rizo J (1998) Ca2+ binding to synaptotagmin: how many Ca2+ ions bind to the tip of a C2-domain? EMBO J 17: 3921–3930 [DOI] [PMC free article] [PubMed] [Google Scholar]
- Ullrich B, Li C, Zhang JZ, McMahon H, Anderson RG, Geppert M, Sudhof TC (1994) Functional properties of multiple synaptotagmins in brain. Neuron 13: 1281–1291 [DOI] [PubMed] [Google Scholar]
- Wu LG, Borst JG (1999) The reduced release probability of releasable vesicles during recovery from short-term synaptic depression. Neuron 23: 821–832 [DOI] [PubMed] [Google Scholar]
- Yoshihara M, Littleton JT (2002) Synaptotagmin I functions as a calcium sensor to synchronize neurotransmitter release. Neuron 36: 897–908 [DOI] [PubMed] [Google Scholar]
- Zhang X, Rizo J, Sudhof TC (1998) Mechanism of phospholipid binding by the C2A-domain of synaptotagmin I. Biochemistry 37: 12395–12403 [DOI] [PubMed] [Google Scholar]
Associated Data
This section collects any data citations, data availability statements, or supplementary materials included in this article.
Supplementary Materials
Supplementary Information