Abstract
We have developed the technique of femtosecond stimulated Raman spectroscopy (FSRS), which allows the rapid collection of high-resolution vibrational spectra on the femtosecond time scale. FSRS combines a sub-50 fs actinic pump pulse with a two-pulse stimulated Raman probe to obtain vibrational spectra whose frequency resolution limits are uncoupled from the time resolution. This allows the acquisition of spectra with <100 fs time resolution and <30 cm−1 frequency resolution. Additionally, FSRS is unaffected by background fluorescence, provides rapid (100 ms) acquisition times, and exhibits traditional spontaneous Raman line shapes. FSRS is used here to study the relaxation dynamics of β-carotene. Following optical excitation to S2 (1Bu+) the molecule relaxes in 160 fs to S1 (2Ag−) and then undergoes two distinct stages of intramolecular vibrational energy redistribution (IVR) with 200 and 450 fs time constants. These processes are attributed to rapid (200 fs) distribution of the internal conversion energy from the S1 C=C modes into a restricted bath of anharmonically coupled modes followed by complete IVR in 450 fs. FSRS is a valuable new technique for studying the vibrational structure of chemical reaction intermediates and transition states.
Introduction
Vibrational spectroscopic techniques with femtosecond time resolution are needed to reveal the structural changes underlying ultrafast chemical and biological reaction processes. Time-resolved vibrational spectroscopy has advanced toward the femtosecond time domain, while struggling against two fundamental obstacles: (1) the difficulty of generating ultrafast laser pulses throughout the mid-infrared for direct IR absorption and (2) the pulse duration/bandwidth transform limit in Raman spectroscopy. Direct IR probing techniques have been generally limited to ∼200 fs time-resolution in a narrow (∼200 cm−1) spectral region.1-3 Alternatively, a full vibrational spectrum over a 3000 cm−1 window can be obtained by using Raman spectroscopy, but pulse durations >0.7 ps are necessary to achieve acceptable spectral resolution.4-6 Coherent anti-Stokes Raman spectroscopy (CARS) has the same bandwidth limitations as spontaneous Raman with the additional difficulties of phase matching and complex band shapes.7 We present here the alternative technique of femtosecond-stimulated Raman spectroscopy (FSRS), which provides <100 fs time resolution and can capture a broad high-resolution vibrational spectrum.
Stimulated Raman scattering (SRS) occurs any time two coherent optical fields, the pump beam at ωp and the Stokes beam at ωS, are incident on a sample that contains a molecular vibration whose frequency, ωv, is equal to ωp – ωS. The Stokes Raman transitions of the sample cause net attenuation of the pump beam and net gain in the probe beam. The evolution of the system can be described by coupled wave equations in which the pump and Stokes fields are coupled parametrically by the polarization response of the sample.8-10 The gain of the Stokes field is determined by the third-order Raman susceptibility, χ3R, which is directly proportional to the spontaneous Raman cross section, dσ/dΩ, and the derived polarizability tensor, dα/dQ.8,10 In an elegant and general treatment of nonlinear spectroscopies, Lee and Albrecht11 have presented derivations of the explicit expressions for χ3 and have shown that spontaneous and stimulated Raman spectroscopies probe the same molecular response, the imaginary part of χ3R. In the 1970s, stimulated Raman was championed as a high-resolution spectroscopic tool12 and as a vibrational pumping technique.13 Recently, several research groups have begun to investigate Stokes and anti-Stokes SRS as a femtosecond vibrational technique.14-17 However, these studies have been hindered by low signal-to-noise ratios and complex anti-Stokes line shapes that obscure the fundamental advantages of FSRS.
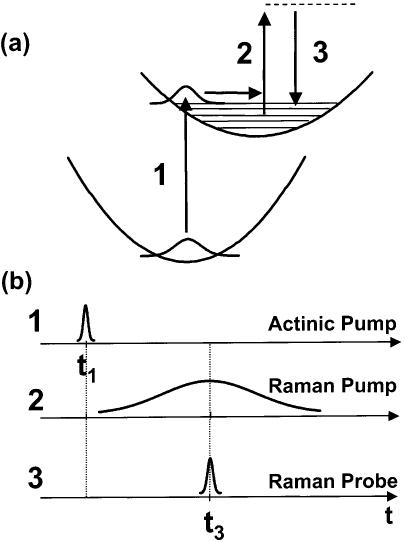
A schematic for femtosecond stimulated Raman spectroscopy is presented in Figure 1. A ∼50-fs actinic pump pulse (1) initiates the photochemistry, after which the Raman spectrum is collected with two pulses overlapped in time: the Raman pump (2), a narrow-bandwidth pulse ∼1 ps in duration that provides the SRS pump field, and the Raman probe (3), a broadband ∼50-fs pulse red-shifted from the Raman pump that provides the SRS Stokes field. The stimulated Raman effect produces amplification of the Raman probe at Raman frequencies shifted from the Raman pump. The FSRS spectrum is obtained by determining the gain of the Raman probe pulse throughout its spectrum. Since the Raman gain spectrum is generated only during the time that the Raman probe pulse is on the sample, <100 fs time-resolution can be obtained, determined only by the durations of the actinic pump and Raman probe. Because the dispersion and detection of the Raman probe intensity is not time-resolved, the FSRS frequency resolution is independent of the time-energy Fourier relationship of the femtosecond pulses. Instead, the frequency resolution is determined by the bandwidth of the Raman pump and the inherent resolution of the spectrographic system.
Figure 1.
Energy level diagram (a) and pulse timing schematic (b) for femtosecond stimulated Raman spectroscopy (FSRS). The actinic pump pulse 1 excites the sample and initiates the photochemical events. The narrow band Raman pump pulse 2 and the broadband Raman probe pulse 3 arrive simultaneously. The resolution of the stimulated Raman spectrum imprinted on the Raman probe pulse is determined by the bandwidth of the Raman pump (∼15 cm−1). The collected Raman spectrum extends from 600 to 2100 cm−1. The limiting time resolution is determined by the cross-correlation of the actinic pump and Raman probe pulses and is typically ∼80 fs.
β-Carotene is used here as a test system for FSRS because of its well-established excited-state relaxation dynamics and excited-state Raman spectrum. Albrecht and co-workers first established the time-scales for excited-state relaxation in β-carotene using femtosecond transient absorption.18 Excitation in the visible absorption band (∼460 nm) populates the second excited singlet state (1Bu+, S2) which relaxes in ∼200 fs to the first excited singlet state (2Ag−, S1) followed by internal conversion to the ground-state (1Ag−, S0) in ∼9 ps. Over the past decade several authors have improved the precision of these measurements19-21 and have recently identified the NIR Sm ← S2 absorption band.22 The vibrational spectrum of S1 has been observed in several picosecond resonance Raman studies and consists of three distinctive features: (1) the 1230 cm−1 band, assigned to C–C stretching modes, (2) the 1545 cm−1 peak, assigned to the terminal C=C stretch, and (3) the 1770–1800 cm−1 peak, assigned to the central C=C stretch.23-28 The unique frequency of this latter S1 mode allows it to be used as a definitive signature of the S1 population. Picosecond anti-Stokes Raman spectra of β-carotene from our group established that S1 is vibrationally relaxed in <2 ps,23 in agreement with transient absorption studies of other carotenoids, which reported spectral shifts of the S1 absorption band on the 400–700 fs time scale.21,29,30 However, the specific mechanism of this relaxation remains unknown.
Here we demonstrate that FSRS can be effectively implemented by using a standard femtosecond Ti:sapphire laser system and that the system produces broad-band vibrational spectra with <100 fs time resolution and < 30 cm−1 frequency resolution with data acquisition times of only ∼100 ms. By applying FSRS to β-carotene, we are able to observe the vibrational relaxation of S1 directly using the distinctive S1 C=C mode as a probe of both the internal conversion and the intramolecular vibrational energy redistribution (IVR) processes. It is found that the S2–S1 internal conversion occurs in 160 fs and that the vibrationally excited S1 state relaxes with 200 and 450 fs time constants in a two-step IVR process. This work demonstrates that FSRS is a powerful new vibrational technique for femtosecond time-resolved structural studies of chemical reaction dynamics.
Materials and Methods
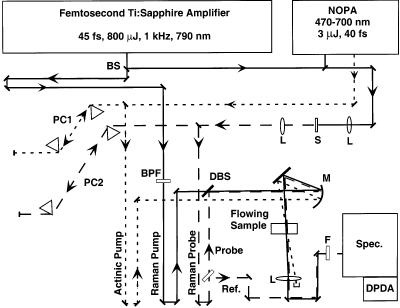
Instrumentation. The femtosecond stimulated Raman spectroscopy laser system (Figure 2) is based on a regeneratively amplified Ti:sapphire laser. A Kapteyn-Murnane Ti:sapphire oscillator31 seeds a regenerative amplifier (BMI Alpha 1000/US) pumped by an intracavity doubled Nd:YLF laser (BMI 621-D). The amplifier produces 45-fs, 800-μJ pulses at a 1-kHz repetition rate with a spectrum centered at 795 nm and a 23-nm fwhm. The actinic pump pulse is produced by passing 20% of the amplifier output to a noncollinear phase-matched optical parametric amplifier (NOPA).32-34 The NOPA is capable of producing pulses from 470 to 700 nm with 20 nm of spectral bandwidth and 3 μJ/pulse. For these experiments the center wavelength of the NOPA output was 492 nm with an 11-nm bandwidth. The pulses were compressed by an SF10 prism compressor35 to a 40-fs fwhm Gaussian pulse, measured by an SFG autocorrelator.36 The optimum separation of the prisms was found to be 11.4 cm, with the 3-mm diameter NOPA beam passing through the apex of each prism. The actinic pump beam was optically delayed relative to the Raman probe pulse with a computer-controlled translation stage, attenuated to 100 nJ/pulse and focused to a 40-μm diameter spot at the sample by a 150 mm fl concave mirror.
Figure 2.
Laser system for femtosecond stimulated Raman spectroscopy. Solid line = 795 nm Ti:sapphire amplifier fundamental and Raman pump; dotted line = visible actinic pump; dashed line = Raman probe continuum; BS= 20% R beam splitter; PC1 = SF10 actinic pump prism compressor; PC2 = SF10 Raman probe prism compressor; BPF = narrow band-pass filter, 1.5 nm at 795 nm; DBS = dichroic beam splitter, 790 nm T, 830–930 nm R; M = spherical focusing mirror, 15 cm fl; L = 10 cm lens; S = sapphire plate, 3 mm thick; F = colored glass filter, RG830; Spec. = single grating spectrograph; DPDA = dual diode array detector.
The Raman pump beam is produced by spectrally filtering the remaining output of the amplifier with two narrow bandpass interference filters (CVI). The sequential filtering produces an 800-fs Raman pump pulse centered at 793 nm with a Lorentzian spectral profile and a 1.1-nm (17 cm−1) fwhm.
The Raman probe beam is produced by focusing the residual 795 nm beam from the NOPA into a 3 mm thick sapphire plate, producing a continuum extending from 400 to 1100 nm. The continuum was compressed with an SF10 prism pair in which only the NIR portion of the spectrum was transmitted. The continuum was split after compression to produce probe and reference beams that allowed shot-by-shot normalization of the continuum intensity. The pulse duration and chirp of the Raman probe pulse was measured at the sample point by optical Kerr effect cross correlation (OKE-XC) with the actinic pump pulse.37 The frequency-resolved OKE-XC indicated that the pulse had an 80-fs Gaussian cross correlation, with <15 fs of chirp from 868 to 951 nm, corresponding to Raman shifts of 1090–2100 cm−1. The bluest portion of the continuum (830–860 nm, corresponding to Raman shifts of 600–980 cm−1) had an irregular cross-correlation shape approximately 200 fs in duration with a delay of up to 100 fs relative to the rest of the continuum.
The Raman pump and probe beams were made collinear at a dichroic beam splitter and focused onto the sample with a 150 mm fl concave mirror. The Raman pump pulse energy was 0.8 μJ/pulse with a 150-μm beam diameter at the sample point (∼6 GW/cm2 peak power), and the Raman probe beam was 30 nJ/pulse with a 60 μm beam diameter. The spatial and temporal overlap of these beams were adjusted to maximize Raman gain signal from cyclohexane. After the sample, the Raman probe was separated from the actinic and Raman pump pulses with an aperture and a colored glass filter (Schott, RG830). The Raman probe and reference pulses were focused onto the slit of the spectrograph (slit =150 μm or 11 cm−1; spectrograph = ISA HR320, 600 gr/mm, 1000-nm blaze) by two cylindrical lenses which separately controlled the vertical displacement and the horizontal width of the two beams at the slit. The two beams were dispersed by the spectrograph and imaged onto a dual-diode array detector (Roper Scientific, DPDA-1024). The time-resolved spectra presented here were obtained with all three beams polarized horizontally, corresponding to collection of the polarized or parallel spontaneous Raman spectrum. The depolarized or perpendicular component of the Raman signal was collected by rotating the polarization of the Raman pump 90° relative to the Raman probe.
Sample Preparation. all-trans-β-Carotene (Aldrich) was recrystallized from benzene and methanol. The 0.27 mM sample in cyclohexane was recirculated through a 0.5-mm path length flow cell (Harrick Scientific) with 0.15-mm glass windows at a rate sufficient to replenish the illuminated volume between shots. The OD at the actinic pump wavelength was 1.3 per 0.5 mm and there was negligible ground-state absorption at the Raman pump and probe wavelengths. The absorption spectrum of the sample did not exhibit any changes over the course of the experiment.
Data Collection. The detector exposure was controlled by an electronic shutter positioned at the entrance slit of the spectrograph. To prevent saturation of the detector, the exposure was limited to 40 ms (40 probe and reference pulses), after which the detector was read out while the shutter was closed for 10 ms. During the readout period, the Raman pump beam was toggled on or off so that sequential exposures corresponded to either Raman-pump-on or Raman-pump-off conditions. The stimulated Raman spectrum is obtained by calculating the Raman gain induced in the probe beam by the Raman pump. Initially, the dark background levels are subtracted from the probe and reference spectra, then the probe spectrum is normalized for intensity fluctuations in the continuum by dividing by the reference spectrum. Finally, division of the normalized Raman-pump-on probe continuum by the normalized Raman-pump-off continuum produces the gain spectrum:
| (1) |
Although a single spectrum could be collected in ∼100 ms, 200 such Raman gain spectra were collected and averaged to improve the signal-to-noise ratio. The residual systematic noise caused by the mismatch of the odd and even pixels in the DPDA was removed by smoothing the spectra with a Savitsky-Golay smoothing algorithm. The total time for data collection at each time delay was 20 s.
After the Raman gain spectra are obtained, a baseline is spline-fit and subtracted to remove artifacts in the baseline due to transient absorption of the sample and phase modulation of the probe spectrum by the Raman pump, which causes a slight blue shift in the Raman probe spectrum.38 At positive times, the fitted baseline deviates <6% from the expected gain baseline of 1.0, while at negative times within 1 ps of Δt = 0, an oscillatory baseline is observed.
The transient transmission spectrum of the sample can be obtained in a manner similar to eq 1, in which the normalized actinic-pump-on spectrum at time delay Δt is divided by the normalized actinic-pump-off spectrum. The transient absorption spectrum can then be directly calculated as A(Δt) =−log[T(Δt)]. Because our Raman probe spectrum lies within β-carotene's strong S2 absorption band,22 the dynamics of the S2 population can be obtained directly from the transient absorption kinetics. In fitting the S2 absorption kinetics, the zero-of-time was allowed to vary to provide a more accurate determination of the Δt = 0 point for each experiment.
Results
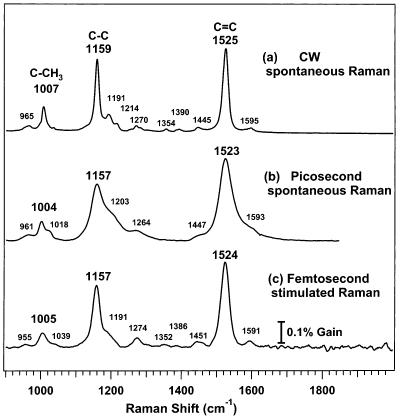
A comparison of the FSRS spectrum of β-carotene with both a CW Raman spectrum and a picosecond resonance Raman (ps RR) spectrum23 is presented in Figure 3. In each case, the solvent spectrum has been subtracted to reveal the ground-state β-carotene spectrum dominated by the methyl rock at ∼1007 cm−1 (C–CH3, ν3), the carbon single-bond stretch at ∼1159 cm−1 (C–C, ν2), and the carbon double-bond stretch at ∼1525 cm−1 (C=C, ν1). The picosecond RR spectrum has much lower spectral resolution than the CW spectrum due to both the increased bandwidth of the ps laser and the relatively large spectrograph slit width typically employed for efficient light collection in the picosecond experiment. In the FSRS spectrum much of the resolution of the CW spectrum is recovered, allowing observation of the small β-carotene peaks at 1352 and 1386 cm−1 and clear resolution of the peaks at 1451, 1524, and 1591 cm−1. The frequency resolution is quantified by the fwhm of the C=C peak in each spectrum: 17 cm−1 in the CW spectrum, 45 cm−1 in the picosecond RR spectrum, and 27 cm−1 in the FSRS spectrum. The width of the C=C peak in the FSRS spectrum is determined by a convolution of the Raman pump bandwidth (17 cm−1) with the CW peak profile, which includes the molecular line shape and the spectrographic slit width. The FSRS spectrum has a baseline noise level of ∼0.02%, an order of magnitude larger than the expected shot noise limit of ∼0.004%. This systematic noise, especially visible above 1600 cm−1, is due to an interference pattern formed as the probe and reference beams pass through an alignment window before the spectrograph. This pattern is not perfectly removed by the intensity ratioing of eq 1 because of fluctuations in the Raman probe intensity. Finally, it should be noted that the 20-s acquisition time for the FSRS spectrum is significantly shorter than for either spontaneous Raman technique.
Figure 3.
Comparison of Raman spectra of β-carotene obtained by three different methods: (a) CW spontaneous Raman (laser = 793 nm, 80 mW; sample = 240 μM β-carotene in toluene; spectrograph slit = 10 cm−1; 4-min acquisition). (b) Picosecond resonance Raman (laser = 531.5 nm, 16 cm−1 fwhm, 1.5 ps pulse; sample = 18 μM β-carotene in toluene; spectrograph slit = 26 cm−1; 5 min acquisition). The picosecond experiment was not optimized for spectral resolution, which could be improved with changes in the detection optical parameters. (c) FSRS (Raman pump = 793 nm, 17 cm−1 fwhm, 800 fs pulse; Raman probe = 830–960 nm, ∼70 fs; sample = 270 μM β-carotene in cyclohexane; spectrograph slit = 11 cm−1; 20-s acquisition). In each case, the solvent spectrum has been subtracted. Representative FSRS gain intensities were 3% at 801 cm−1 and 1% at 1444 cm−1 for cyclohexane and 0.3% at 1157 cm−1 and 0.4% at 1524 cm−1 for β-carotene.
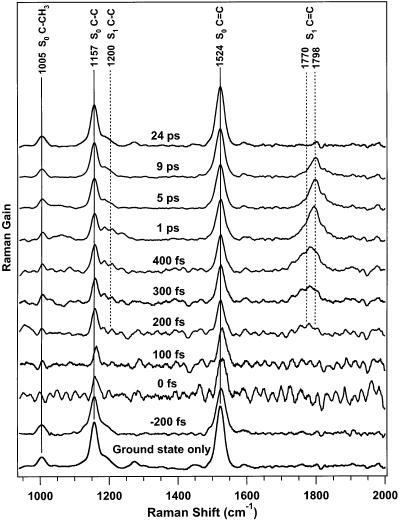
Time-resolved FSRS spectra of β-carotene are presented in Figure 4. At early time delays, the depletion of the ground state is visible as the decreased intensity of the S0 1005, 1157, and 1524 cm−1 peaks. The growth of the S1 C=C peak between 1770 and 1798 cm−1 over the first picosecond and its decay at longer times is also evident. Comparing the S1 C=C peaks at 300 fs and 1 ps, it is clear that the peak is blue-shifting and narrowing, signatures of vibrational cooling. No peaks attributable to S2 were observed perhaps because of the systematic baseline ripple at short time delays, which decreases over the S2 lifetime. This baseline ripple has the same general structure as the baseline noise seen in the ground state only spectrum, and we believe it is caused by the interference pattern discussed above. The resonance of the Raman pump with the S2–Sm transition causes a change in the transmission of the Raman probe when comparing the Raman-pump-on vs Raman-pump-off spectra thereby increasing the residual interference pattern in the gain spectrum.
Figure 4.
FSRS spectra of β-carotene's S0 and S1 electronic states. The intensity of the S0 peaks at 1157 and 1525 cm−1 decrease at 0 fs and the S1 peak at ∼1780 cm−1 grows from 200 fs to 1 ps. The large baseline ripple at early times is an interference artifact enhanced by the transient absorption of β-carotene's S2 state (see text). Each spectrum is vertically offset 0.2% and the nominal times noted have not been corrected for the offset in the Δt = 0 time determined by the transient absorption spectra.
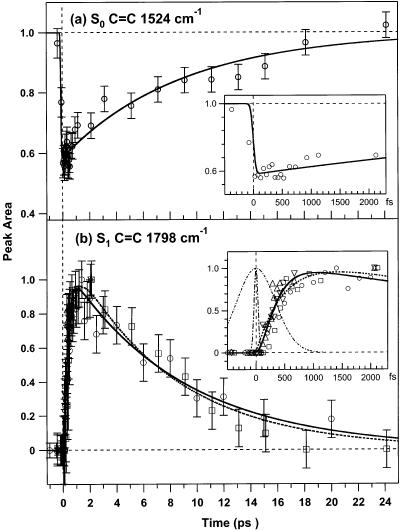
The dynamics of β-carotene's S0 and S1 populations can be determined by following the areas of the S0 and S1 peaks in Figure 4 over time. The kinetics of the 1524 cm−1 peak, shown in Figure 5a, are well fit by the convolution of our 80-fs instrument response to a molecular response incorporating an instantaneous bleach followed by a 9±1 (1σ) ps recovery. The amplitude of the depletion indicates that 42% of the sample is excited by the actinic pump pulse. In Figure 5b, the kinetics of the S1 C=C peak area are presented. The data were collected in four different experiments and normalized to the maximum observed area before fitting the entire data set using a weighted nonlinear least-squares algorithm. It is apparent that the S1 peak grows in until 1–2 ps and then decays with an 8–9-ps lifetime. The precise kinetics of the growth and decay of the S1 peak can be fit with several schemes. Using a simple three-state model of the excited-state relaxation, , the kinetics are fit by a 500 ± 50 fs S2–S1 internal conversion time (τ1) and a 7.6 ± 0.8 ps S1 lifetime (τ2). However, this kinetic model (dashed line, Figure 5b) overestimates the peak areas at early time delays (Δt < 300 fs), underestimates the peak intensity elbow at ∼700 fs, and is inconsistent with previous measurements of the S2 lifetime. A four-state relaxation scheme, incorporating a “dark” state before the formation of Raman active S1, fits the short time data better. Here, the S2 decay rate (τ1) is fixed at 163 fs, as determined by the transient absorption kinetics (vide infra), and τ2 and τ3 are varied to fit the data. The best fit parameters of the four-state model are τ2 = 200 ± 20 fs and τ3 = 8.7 ± 0.9 ps (solid line, Figure 5b).
Figure 5.
Kinetics of β-carotene's S0 C=C and S1 C=C FSRS peak areas. (a) The S0 C=C intensity at 1524 cm−1 bleaches within the 80-fs cross-correlation (see inset) and recovers in 9 ± 1 ps. (b) The S1 C=C integrated area at 1770 and 1798 cm−1 rises to a maximum at a ∼2-ps time delay and then decays with a ∼9-ps lifetime. The early time behavior (b, inset) of the S1 C=C peak is poorly fit by a simple three-state (dashed) kinetic model. The kinetics are better fit by a four-state model incorporating a 163 (±9) fs S2 lifetime determined by transient absorption, a 200 (±20) fs intermediate lifetime, and an 8.7 (±0.9) ps S1 lifetime (solid). Also shown in the inset is the actinic pump–Raman probe cross-correlation (80 fs, dot-dot-dashed) and the Raman pump envelope (800 fs, dot-dashed). The S1 C=C data were collected in four different experiments (Δ,▽,□,○), plotted versus the corrected time delay (see text) and fit using a weighted nonlinear least-squares algorithm.
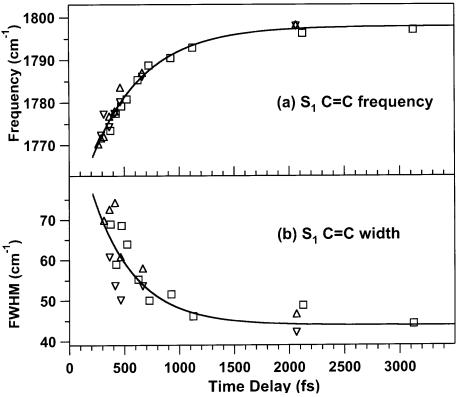
The vibrational relaxation in S1 can be quantified by examining the rate at which the S1 C=C peak blue shifts and narrows over the first several picoseconds (Figure 6). The center and width of this peak were determined by fitting to a Lorentzian line shape function. Fitting the dynamics to a single exponential reveals that the peak blue shifts from 1770 to 1798 cm−1 with a 470 ± 40 fs time constant and narrows from 70 to 45 cm−1 fwhm with a 400 ± 150 fs time constant.
Figure 6.
Vibrational cooling of the S1 state of β-carotene observed through the blue shift (a) and narrowing (b) of the S1 C=C peak. The peak position shifts from 1770 to 1798 cm−1 with a 470 (±40) fs time constant. The peak narrows from an initial fwhm of 70 cm−1 to a final value of 45 cm−1 with a 400 (±150) fs time-constant.
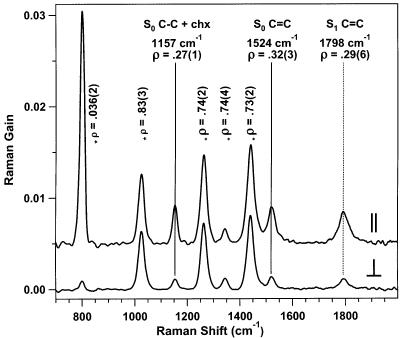
Parallel and perpendicular Raman spectra of β-carotene in cyclohexane 2 ps after excitation by the actinic pump pulse are presented in Figure 7. In general, the depolarization ratios of the solvent agree with the most accurate values in the literature.39 The 801-cm−1 cyclohexane mode is strongly polarized, ρ = 0.036 ± 0.002, while the three other largest cyclohexane modes at 1028, 1266, and 1444 cm−1 all have depolarization ratios within 10% of the predicted values of 0.75. The peak at 1157 cm−1 (ρ = 0.27 ± 0.01) is a superposition of the cyclohexane mode with ρ = 0.1639 and β-carotene's C–C stretch, with an expected depolarization ratio of 0.33.40 The depolarization ratio for β-carotene's C=C peak is 0.32 ± 0.03 in S0 (1524 cm−1), agreeing with previous CW values,40 and 0.29 ± 0.06 in S1 (1798 cm−1).
Figure 7.
Parallel and perpendicular stimulated Raman spectra of S0 and S1 β-carotene in cyclohexane (time delay of 2 ps). For the parallel spectrum, Raman pump and probe pulses are polarized horizontally. For the perpendicular spectrum, the Raman pump polarization is rotated 90°. Depolarization ratios, ρ = ⊥/∥, of cyclohexane are marked with an asterisk (*). The parallel spectrum is vertically offset 0.5% for clarity.
The transient absorption kinetics due to the S2−Sm NIR absorption (not shown) were fit to a convolution of our instrument response with an exponential lifetime. The average decay time for different wavelengths on different days was 163 ± 9 fs, which we assign to the S2 lifetime. This lifetime is consistent with other determinations of the S2 lifetime by visible transient absorption18,21 and fluorescence up-conversion.19,20 The decay time increased slightly as the wavelength increases: 156 ± 13 fs at 880 nm, 162 ± 16 fs at 903 nm, 179 ± 26 fs at 926 nm, and 197 ± 41 fs at 949 nm, consistent with previous NIR transient absorption studies.22 We did not observe any delay in the onset of the long wavelength (949 nm) absorption, which Zhang et al.22 observed at wavelengths beyond 1000 nm. The absorption kinetics were also used to determine the experimental zero-of-time, which was −130 fs for the FSRS spectra shown in Figure 4. The difference between the zero-of-time established by OKE-XC and that determined by the transient absorption kinetics may be attributed to the slight alignment adjustments necessary after collection of the OKE traces. The time-points in Figures 5 and 6 use the corrected time delays.
Discussion
We have developed a femtosecond time-resolved stimulated Raman apparatus which has the ability to obtain vibrational spectra with femtosecond time resolution and high vibrational resolution. The practicality of the FSRS technique has been demonstrated by collecting Raman spectra of β-carotene excited-state dynamics on the 100-fs time scale with 27 cm−1 frequency resolution. Since FSRS measures small changes in a coherent and intense output beam, the technique is naturally fluorescence background free and has a theoretical noise limit determined only by the shot noise of the detected beam. With a collection time of 100 ms, the ∼10−4 M β-carotene solution's C=C peak has a signal-to-noise level (S/N) of ∼20, while the cyclohexane peak at 1444 cm−1 has a S/N of ∼50. Elimination of the residual systematic interference pattern should increase these S/N levels by at least a factor of 10 and allow realization of the shot-noise limit. Independent of its inherently high time resolution, such performance would make FSRS a very useful tool for obtaining conventional ground-state Raman spectra of fluorescent systems. The current spectral resolution can be improved by a factor of 2–3 by decreasing the bandwidth of the Raman pump and improving the focusing at the spectrograph slit. These improvements should not significantly degrade either the time resolution or signal strength. Although here we have only shown Raman spectra from 700 to 2000 cm−1, the breadth of the Raman spectrum is limited only by the extent of the Raman probe and the detection limit of the diode array, allowing the collection of Raman spectra from 100 to 3200 cm−1 (800–1060 nm). Finally, the observation of the S0 bleach within the 80-fs cross-correlation and the 200–500-fs time constants established by the S1 C=C dynamics indicate that we are observing Raman spectra with time resolution limited only by the actinic pump and Raman probe pulse widths. With careful pulse compression, FSRS can attain a time resolution of < 40 fs, considering the spectral breadth of the Raman probe (2500 cm−1) and the ease of <20 fs actinic pulse generation in the visible.33,34 With this time resolution and the elimination of the systematic noise at short times, FSRS should be capable of recording vibrational spectra of transition states and reaction intermediates in the fastest photochemical and photobiological reactions.
The high time and frequency resolution vibrational spectra provided by FSRS has allowed the observation of new relaxation dynamics in β-carotene. At early times, the growth of the S1 C=C peak does not match the S2 lifetime established by transient absorption, indicating the presence of an intermediate dark state, X, between S2 and the Raman-active S1 state. The four-state relaxation scheme establishes the X lifetime as 200 fs. At longer times, the recovery of the S0 C=C intensity matches the S1 CdC decay time, 9 ± 1 ps, and can be assigned to the S1 lifetime. This lifetime agrees quite well with previous room-temperature observations by transient absorption18,41-43 and is consistent with the slightly longer lifetime at ∼10 °C established by our picosecond resonance Raman23 studies when the temperature dependence of the internal conversion rate is considered.44
The S2−S1 internal conversion occurs by curve-crossing through a conical intersection in S2 that is displaced along the C=C normal modes45,46 and produces S1 with several quanta of excitation in these modes. We believe that such highly vibrationally excited (nC=C ∼ 3) molecules provide the best explanation for the dark state, X, in the four-state relaxation scheme. This highly excited species will have negligible C=C Raman intensity because of the extremely short vibrational dephasing time. The 200-fs time constant established by the S1 C=C peak area kinetics describes the rapid intramolecular vibrational relaxation of this state to a subset of the normal modes of the molecule that are strongly anharmonically coupled to the central C=C stretch. We will refer to this collection of modes as the “anharmonic bath”. Relaxation to nC=C = 0 allows the growth of the S1 C=C Raman intensity. The anharmonic bath's strong coupling to the C=C stretch has two effects; (1) the coupling will allow rapid IVR between these modes47,48 and (2) the coupling will cause a downshift in the frequency of the C=C stretch to ∼1770 cm−1 when the anharmonic bath is excited.49-51
In a second stage of IVR, occurring with a constant, ∼450-fs time the anharmonic bath distributes the internal conversion energy throughout the entire set of normal modes of the molecule. The loss of excitation in the anharmonic bath will cause the observed upshift and narrowing in the C=C peak.50,51 The two time scales of S1 IVR are simply due to the variations of the magnitude of the anharmonic coupling constants, which will be largest for the totally symmetric backbone modes (the anharmonic bath) and weaker for the rest of the modes.49 Similar two-stage IVR has been observed in the ground states of bacteriorhodopsin,52,53 rhodopsin,54 β-carotene,23 and canthaxanthin.50 From these studies it appears that the second stage of IVR occurs on a slower ∼3 ps time scale in the ground state, most likely because of decreased anharmonicity in S0 relative to S1. Our 200 and 450 fs IVR time constants are consistent with the 400–700 fs time-constants assigned to S1 vibrational relaxation observed in several transient absorption studies of carotenoids.21,29,30
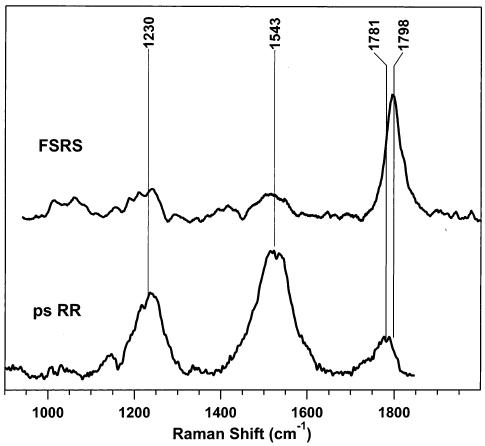
Figure 8 compares the picosecond resonance Raman (ps RR) spectrum of S1 β-carotene23 with the S1 FSRS spectrum obtained by subtracting a scaled ground-state spectrum from the time-resolved spectrum in Figure 4. The two strongest ps RR bands at 1230 and 1543 cm−1 have dramatically reduced relative intensity in the FSRS spectra. This is most likely due to strong resonance enhancement of the 1230 and 1543 cm−1 bands in the ps RR spectra. While the ps RR probe wavelength (532 nm) lies within the visible Sn ← S1 absorption,18 the FSRS Raman pump wavelength (793 nm) lies between the visible absorption band and the NIR S2 ← S1 transition.30 Analysis of the perpendicular FSRS spectrum indicated that there is no dramatic perpendicular intensity in the 1230 and 1543 cm−1 FSRS bands, nor is the S1 C=C depolarization ratio (0.29) exceptionally low, either of which might have accounted for the relative intensities in the unpolarized picosecond RR spectrum. Further analysis of the resonance enhancement and depolarization ratios of the S1 peaks may allow new insights into the assignment of the excited-state Raman spectrum and the nature of the resonant electronic states.
Figure 8.
Comparison of Raman spectra of β-carotene's S1 state obtained by using picosecond resonance Raman (ps RR) and femto-second stimulated Raman (FSRS) spectroscopies at time delays of 3 ps. The picosecond RR spectrum (⊥ + ∥) of β-carotene in toluene was obtained by using a 2.9 ps, 400 nm actinic pump pulse and a 1.5 ps, 532-nm probe pulse with a 90° scattering geometry. The upshift of the S1 C=C frequency from 1781 cm−1 in the picosecond RR spectra to 1798 cm−1 in the FSRS spectra is due to the change in solvent polarizability.24
Conclusions
The unique time resolution, frequency resolution, and data acquisition times of the FSRS technique have allowed a more complete examination of β-carotene's internal conversion and vibrational cooling dynamics. In agreement with Albrecht's seminal work,18 we find that the relaxation occurs via a 160-fs S2–S1 internal conversion and a 9-ps S1–S0 internal conversion. Additionally, by observing the evolution of the S1 vibrational spectrum on the 100-fs time scale, it is found that intramolecular vibrational relaxation in S1 occurs in a two-step process whereby excitation in the C=C mode is distributed to the strongly coupled vibrations in 200 fs and then equilibrated throughout the complete set of normal modes in ∼450 fs. Unlike observations made by transient absorption, the 200- and 450-fs vibrational relaxation times observed here can be assigned to specific vibrational cooling mechanisms. The future use of FSRS to examine structural changes that take place during the transcis isomerization of bacteriorhodopsin's chromophore and the primary cis–trans isomerization in vision should provide similarly valuable new insights into chemical reaction dynamics.
Acknowledgment.
We thank Michael Tauber and Judy Kim for many helpful discussions and assistance in the development of the FSRS apparatus. This work was supported by a grant from the National Science Foundation (CHE-9801651) and by the Mathies royalty fund. D.M. was supported by a National Science Foundation graduate research fellowship.
Footnotes
Part of the special issue “A. C. Albrecht Memorial Issue”.
References and Notes
- 1.Lian T, Bromberg SE, Asplund MC, Yang H, Harris CB. J. Phys. Chem. 1996;100:11 994–12 001. [Google Scholar]
- 2.Rubtsov IV, Zhang T, Nakajima H, Aono S, Rubtsov GI, Kumazaki S, Yoshihara K. J. Am. Chem. Soc. 2001;123:10 056–10 062. doi: 10.1021/ja011023w. [DOI] [PubMed] [Google Scholar]
- 3.Diller R, Maiti S, Walker GC, Cowen BR, Pippenger R, Bogomolni RA, Hochstrasser RM. Chem. Phys. Lett. 1995;241:109–115. [Google Scholar]
- 4.Kim JE, McCamant DW, Zhu L, Mathies RA. J. Phys. Chem. B. 2001;105:1240–1249. doi: 10.1021/jp001236s. [DOI] [PMC free article] [PubMed] [Google Scholar]
- 5.Hayes SC, Philpott MJ, Reid PJ. J. Chem. Phys. 1998;109:2596–2599. [Google Scholar]
- 6.Franzen S, Bohn B, Poyart C, Martin JL. Biochemistry. 1995;34:1224–1237. doi: 10.1021/bi00004a016. [DOI] [PubMed] [Google Scholar]
- 7.Ujj L, Volodin BL, Popp A, Delaney JK, Atkinson GH. Chem. Phys. 1994;182:291–311. [Google Scholar]
- 8.Levenson MD, Kano SS. Introduction to Nonlinear Laser Spectroscopy. Academic; San Diego: 1988. [Google Scholar]
- 9.Shen YR. The Principles of Nonlinear Optics. J. Wiley; New York: 1984. [Google Scholar]
- 10.Shen YR, Bloembergen N. Phys. Rev. 1965;137:A1787–A1805. [Google Scholar]
- 11.Lee D, Albrecht AC. In: Advances in Infrared and Raman Spectroscopy. Clark RJH, Hester RE, editors. Vol. 12. Wiley Heyden; 1985. pp. 179–213. [Google Scholar]
- 12.Owyoung A. IEEE J. Quantum Electron. 1978;QE-14:192–203. [Google Scholar]
- 13.Laubereau A, Kaiser W. Rev. Mod. Phys. 1978;50:607–665. [Google Scholar]
- 14.Yoshizawa M, Hattori Y, Kobayashi T. Phys. Rev. B. 1994;49:13 259–13 262. [Google Scholar]
- 15.Yoshizawa M, Kubo M, Kurosawa M. J. Lumin. 2000;87–89:739–741. [Google Scholar]
- 16.Yoshizawa M, Aoki H, Hashimoto H. Bull. Chem. Soc. Jpn. 2002;75:949–955. [Google Scholar]
- 17.Rondonuwu FS, Watanabe Y, Zhang JP, Furuichi K, Koyama Y. Chem. Phys. Lett. 2002;357:376–384. [Google Scholar]
- 18.Shreve AP, Trautman JK, Owens TG, Albrecht AC. Chem. Phys. Lett. 1991;178:89–96. [Google Scholar]
- 19.Kandori H, Sasabe H, Mimuro M. J. Am. Chem. Soc. 1994;116:2671–2672. [Google Scholar]
- 20.Macpherson AN, Gillbro T. J. Phys. Chem. A. 1998;102:5049–5058. [Google Scholar]
- 21.Cerullo G, Lanzani G, Zavelani-Rossi M, De Silvestri S. Phys. Rev. B. 2001;63:241104. [Google Scholar]
- 22.Zhang JP, Skibsted LH, Fujii R, Koyama Y. Photochem. Photobiol. 2001;73:219–222. doi: 10.1562/0031-8655(2001)073<0219:taftus>2.0.co;2. [DOI] [PubMed] [Google Scholar]
- 23.McCamant DW, Kim JE, Mathies RA. J. Phys. Chem. A. 2002;106:6030–6038. doi: 10.1021/jp0203595. [DOI] [PMC free article] [PubMed] [Google Scholar]
- 24.Noguchi T, Hayashi H, Tasumi M, Atkinson GH. J. Phys. Chem. 1991;95:3167–3172. [Google Scholar]
- 25.Hashimoto H, Koyama Y. Chem. Phys. Lett. 1989;163:251–256. [Google Scholar]
- 26.Noguchi T, Kolaczkowski S, Arbour C, Aramaki S, Atkinson GH, Hayashi H, Tasumi M. Photochem. Photobiol. 1989;50:603–609. [Google Scholar]
- 27.Hashimoto H, Koyama Y. Chem. Phys. Lett. 1989;154:321–325. [Google Scholar]
- 28.Negri F, Orlandi G, Zerbetto F, Zgierski MZ. J. Chem. Phys. 1989;91:6215–6224. [Google Scholar]
- 29.Andersson PO, Gillbro T. J. Chem. Phys. 1995;103:2509–2519. [Google Scholar]
- 30.Polivka T, Zigmantas D, Frank HA, Bautista JA, Herek JL, Koyama Y, Fujii R, Sundstrom V. J. Phys. Chem. B. 2001;105:1072–1080. [Google Scholar]
- 31.Huang C, Asaki MT, Backus S, Murnane MM, Kapteyn HC, Nathel H. Opt. Lett. 1992;17:1289–1291. doi: 10.1364/ol.17.001289. [DOI] [PubMed] [Google Scholar]
- 32.Wilhelm T, Piel J, Riedle E. Opt. Lett. 1997;22:1494–1496. doi: 10.1364/ol.22.001494. [DOI] [PubMed] [Google Scholar]
- 33.Shirakawa A, Kobayashi T. Appl. Phys. Lett. 1998;72:147–149. [Google Scholar]
- 34.Cerullo G, Nisoli M, Stagira S, De Silvestri S. Opt. Lett. 1998;23:1283–1285. doi: 10.1364/ol.23.001283. [DOI] [PubMed] [Google Scholar]
- 35.Fork RL, Martinez OE, Gordon JP. Opt. Lett. 1984;9:150–152. doi: 10.1364/ol.9.000150. [DOI] [PubMed] [Google Scholar]
- 36.Fleming GR. Chemical Applications of Ultrafast Spectroscopy. Oxford University; Clarendon: New York, Oxford: 1986. [Google Scholar]
- 37.Yamaguchi S, Hamaguchi H. Appl. Spectrosc. 1995;49:1513–1515. [Google Scholar]
- 38.Hirlimann C. In: Femtosecond Laser Pulses: Principles and Experiments. Rulliere C, editor. Springer-Verlag; Berlin Heidelberg: 1998. pp. 47–48. [Google Scholar]
- 39.Toleutaev BN, Tahara T, Hamaguchi H. Appl. Phys. B. 1994;59:369–375. [Google Scholar]
- 40.Saito S, Tasumi M, Eugster CH. J. Raman Spectrosc. 1983;14:299–309. [Google Scholar]
- 41.Wasielewski MR, Kispert LD. Chem. Phys. Lett. 1986;128:238–243. [Google Scholar]
- 42.Bondarev SL, Bachilo SM, Dvornikov SS, Tikhomirov SA. J. Photochem. Photobiol. A. 1989;46:315–322. [Google Scholar]
- 43.Nagae H, Kuki M, Zhang JP, Sashima T, Mukai Y, Koyama Y. J. Phys. Chem. A. 2000;104:4155–4166. [Google Scholar]
- 44.Wasielewski MR, Johnson DG, Bradford EG, Kispert LD. J. Chem. Phys. 1989;91:6691–6697. [Google Scholar]
- 45.Garavelli M, Bernardi F, Olivucci M, Vreven T, Klein S, Celani P, Robb MA. Faraday Discuss. 1998;110:51–70. [Google Scholar]
- 46.Fuss W, Haas Y, Zilberg S. Chem. Phys. 2000;259:273–295. [Google Scholar]
- 47.Kenkre VM, Tokmakoff A, Fayer MD. J. Chem. Phys. 1994;101:10 618–10 629. [Google Scholar]
- 48.Deak JC, Iwaki LK, Dlott DD. J. Phys. Chem. A. 1998;102:8193–8201. [Google Scholar]
- 49.Okamoto H, Sekimoto Y, Tasumi M. Spectrochim. Acta, Part A. 1994;50:1467–1473. [Google Scholar]
- 50.Nakabayashi T, Okamoto H, Tasumi M. J. Phys. Chem. A. 1997;101:3494–3500. [Google Scholar]
- 51.Hamm P, Ohline SM, Zinth W. J. Chem. Phys. 1997;106:519–529. [Google Scholar]
- 52.Doig SJ, Reid PJ, Mathies RA. J. Phys. Chem. 1991;95:6372–6379. [Google Scholar]
- 53.Shreve AP, Mathies RA. J. Phys. Chem. 1995;99:7285–7299. [Google Scholar]
- 54.Kim JE, Mathies RA. J. Phys. Chem. A. 2002;106:8508–8515. doi: 10.1021/jp021069r. [DOI] [PMC free article] [PubMed] [Google Scholar]


