

Abstract
We show here that the GTPase RhoG is involved in caveolar trafficking. Wild-type RhoG moves sequentially to the plasma membrane, intracellular vesicles, and the Golgi apparatus along markers of this endocytic pathway. Such translocation is associated with changes in RhoG GDP/GTP levels and is highly dependent on lipid raft integrity and on the function of the GTPase dynamin2. In addition, the constitutively active RhoGQ61L mutant is preferentially located in endocytic vesicles that can be decorated with markers of the caveola-derived endocytic pathway. RhoGQ61L, but not the analogous Rac1 mutant protein, affects caveola internalization and the subsequent delivery of endocytic vesicles to the Golgi apparatus. The expression of RhoG/Rac1 chimeric proteins and RhoGQ61L effector mutants in cells induces alterations in the internalization of caveolae and severe changes in vesicle structure, respectively. However, the knockdown of endogenous rhoG transcripts using small interfering RNAs does not affect significantly the trafficking of caveola-derived vesicles, suggesting that RhoG function is dispensable for this endocytic process or, alternatively, that its function is compensated by other molecules. Taken together, these observations assign a novel function to RhoG and suggest that caveolar trafficking, as previously shown for other endocytic routes, is modulated by GTPases of the Ras superfamily.
Keywords: RhoG, caveolin, endocytosis, cholera toxin, vesicle trafficking
Introduction
Endocytosis is required for the crosstalk of eucaryotic cells with the surrounding environment, facilitating extracellular cargo uptake, receptor turnover, signal transduction, cell polarity, and intercellular communications (Gruenberg, 2001; Conner and Schmid, 2003; Di Guglielmo et al., 2003; Felberbaum-Corti et al., 2003; Gonzalez-Gaitan, 2003). The best-known endocytic pathway is that composed of clathrin-coated vesicles (Zerial and McBride, 2001; Conner and Schmid, 2003). In this case, we have information regarding the internalization, sorting, recycling, fusion, and delivery events that participate in this type of endocytosis (Zerial and McBride, 2001; Conner and Schmid, 2003). This pathway has also been molecularly dissected, resulting in the characterization of a large number of regulatory molecules that participate in each of those trafficking events (Zerial and McBride, 2001; Conner and Schmid, 2003). More recently, the alternative endocytic pathway mediated by caveolae has attracted attention owing to its role in cholesterol homeostasis, lipid trafficking, receptor internalization, spatial segregation of signaling pathways, and the entry of viral and bacterial pathogens (Nichols and Lippincott-Schwartz, 2001; Pelkmans and Helenius, 2002; Conner and Schmid, 2003; Nichols, 2003; Parton and Richards, 2003). Although some interconnections have been observed between clathrin- and caveola-dependent vesicles (Nichols and Lippincott-Schwartz, 2001), the available experimental evidence indicates that the internalization mechanism and regulatory steps of these two endocytic routes are different (Nichols and Lippincott-Schwartz, 2001; Nichols, 2003). The recent use of small interfering RNA (siRNA) library screenings has led to the discovery of a complex array of protein kinases acting at different internalization/endocytic stages of this new trafficking route (Pelkmans et al., 2005; Pelkmans and Zerial, 2005). Despite these significant advances, the regulation of this pathway is only scarce at this moment.
An evolutionarily conserved step in the regulation of vesicle trafficking is the participation of GTPases of the Ras superfamily. The archetypical example of such implication is the Rab subfamily, a large group of GTPases that mediate all the trafficking steps of clathrin-coated vesicles, including vesicle budding, internalization, sorting, recycling, and delivery to organelles (Zerial and McBride, 2001). Another group of GTPases important for intracellular trafficking is the Rho/Rac subfamily (Ellis and Mellor, 2000). For example, RhoD, TCL, and RhoB act at different stages of the clathrin route (Ellis and Mellor, 2000). Cdc42 participates in the internalization of glycosylphosphatidylinositol (GPI)-anchored proteins in a clathrin- and dynamin-independent endocytic route recently characterized (Sabharanjak et al., 2002). This GTPase also regulates the transport of vesicles from the Golgi to the plasma membrane via an interaction with γ-COP (Wu et al., 2000). Finally, Cdc42 and Rac1 are important for different steps of phagocytosis (Cox et al., 1997; Massol et al., 1998; Greenberg, 1999; Hoppe and Swanson, 2004).
Another Rho/Rac family member that may be involved in vesicle trafficking is RhoG. Earlier reports have linked this GTPase to a number of disparate activities such as cytoskeletal regulation (Gauthier-Rouviere et al., 1998), abrogation of cell contact inhibition (Gauthier-Rouviere et al., 1998), neurite outgrowth (Katoh et al., 2000), axogenesis (May et al., 2002), and lysosomal dynamics (Vignal et al., 2001). More recently, we observed that the constitutively active version of RhoG (Q61L mutant) has a vesicular localization pattern in COS-1 cells (Prieto-Sanchez and Bustelo, 2003). These observations were somewhat unexpected, as RhoG is highly related to Rac1, a GTPase located preferentially in the plasma membrane when GTP-loaded (Prieto-Sanchez and Bustelo, 2003). Based on this evidence, we decided to study the possible implication of RhoG in endocytic pathways.
Results
Constitutively active RhoG colocalizes with caveolin-positive vesicles
To identify the exact subcellular localization of RhoGQ61L, we used dual fluorescence microscopy experiments to study its association with markers of different endocytic routes and intracellular compartments. RhoGQ61L-containing vesicles were not decorated by a number of well-established markers of the clathrin pathway (clathrin, Rab4, Rab5, Rab7, Rab11) or macropinocytosis (HA-Arf6Q67L, HA-Arf6T27N) (Figure 1; see also Supplementary Figure S1). Instead, RhoGQ61L-positive vesicles co-stained extensively with both the endogenous and ectopically expressed caveolin, a component of the caveola-derived endocytic pathway (Figure 1). This colocalization was rather heterogeneous, because we could find in the same cell vesicles staining for RhoG alone, caveolin alone, or these two proteins together (Figure 1). In addition, we also found some colocalization with a reduced subset of vesicles containing internalized EGF receptor (Supplementary Figure S1, upper panel on the right). In the same set of experiments, Rac1Q61L colocalized only with the F-actin found at membrane ruffles but not with the rest of subcellular markers (Figure 1, data not shown).
Figure 1.
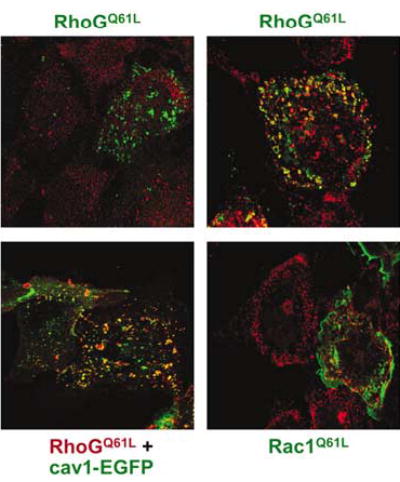
Staining of RhoGQ61L-positive vesicles with markers of the clathrin- and caveola-derived pathways. COS-1 cells were transfected with plasmids encoding the indicated proteins. After 30 h, cells were fixed and immunostained with AU5 antibodies (all panels) and, when appropriate, with either clathrin (upper panel on the left, red signal) or caveolin1 (right panels, red signals) antibodies. In the case of caveolin1-EGFP-transfected cells, this protein was visualized by direct fluorescence (lower panel on the left, green signal). The subcellular localization of the GTPases is shown in either red (lower panel on the left) or green (rest of panels). Areas of colocalization are shown in yellow. Cav1, caveolin1.
Wild-type RhoG undergoes intracellular changes during the trafficking of caveolin-positive vesicles
To confirm the possible relationship of RhoG with the endocytic pathway associated with caveolin-positive vesicles, we decided to follow the changes in the subcellular localization of wild-type RhoG during the internalization of caveola-derived vesicles. To this end, we transiently transfected COS-1 cells with the wild-type version of RhoG. After transfection, cells were incubated with fluorescein isothiocyanate (FITC)-labeled clostridium toxin subunit B (CTxB), a bacterial protein previously shown to internalize via caveolin-positive vesicles (Nichols, 2002, 2003). FITC-CTxB was initially allowed to bind to cell membranes at 4°C and, after washing out the unbound toxin, the caveolar trafficking was initiated by shifting the temperature of cultures to 37°C. At specific points, cells were fixed and the subcellular localization of FITC-CTxB and RhoG tracked down by two-color confocal immunofluorescence. In cells cultured at 37°C, wild-type RhoG showed a diffuse distribution throughout the cytoplasm in the absence of bacterial toxin (Figure 2A, panel c′). In a few cases, a small percentage of wild-type RhoG could also be observed in a perinuclear localization (data not shown). A fraction of RhoG moved from the cytosol to the plasma membrane after the addition of FITC-CTxB at 4°C (Figure 2A, compare panels b and c′). After the induction of internalization by the temperature shift to 37°C, RhoG stayed at the plasma membrane during early incubation times (Figure 2A, panels d–f). The colocalization of RhoG with CTxB at these time points suggests that RhoG is bound to membrane lipid rafts (Figure 2A, panels d–f, and Supplementary Figure S2), because CTxB is the binding partner of a glycosphingolipid (GM1) that is usually enriched in those membrane substructures (Nichols, 2003). RhoG moved subsequently to enlarged endocytic structures (Figure 2A, panels g–i) and, finally, toward discrete perinuclear structures between 30 and 60 min after the temperature shift (Figure 2A, panels j–r). RhoG colocalized with CTxB during all these endocytic steps, confirming that these two molecules transit through the same intracellular route (Figure 2A, panels c, f, i, l, o, and r; areas of yellow color). In contrast to RhoG, the cytosolic distribution of wild-type Rac1 remained unperturbed by the treatment of cells with CTxB (Figure 2A, panels s–u). In agreement with previous reports (Nichols, 2002, 2003), the perinuclear structure positive for RhoG and CTxB signals was identified as the Golgi apparatus, as determined by the extensive decoration of this structure with the Golgi-specific marker GM130 (Figure 2B, panel X).
Figure 2.
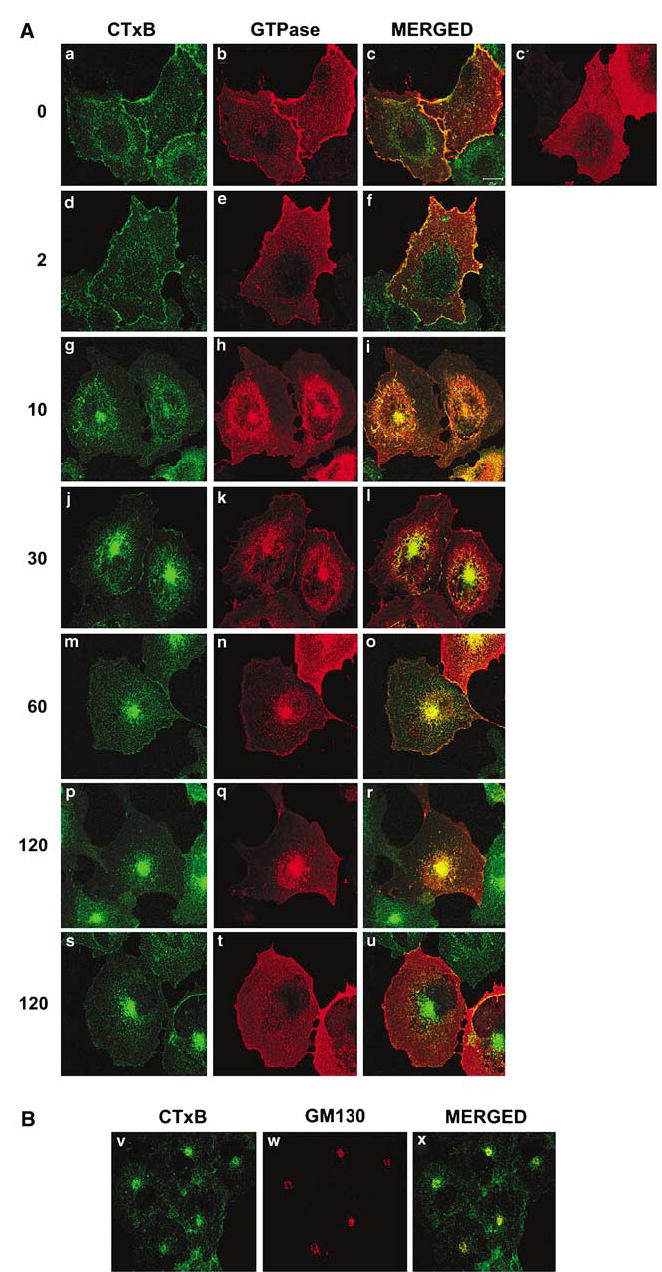
RhoG participates in the trafficking route of CTxB-positive endosomes. (A) COS-1 cells expressing either AU5-RhoG (panels a–r) or AU5-Rac1 (panels s–u) were subjected to FITC-CTxB internalization experiments as indicated in Materials and methods. After the indicated minutes of incubation with the toxin at 37°C (left), cells were stained with anti-AU5 and subjected to confocal microscope analysis. As control (panel c′), we used RhoG-transfected cells cultured at 37°C without the transfer to 4°C (see Materials and methods). The localization of RhoG (panels b, c′, e, h, k, n, and q) and Rac1 (panel t) is shown in red. The localization of FITC-CTxB is shown in green (left panels). The areas of colocalization of FITC-CTxB with RhoG and Rac1 are shown in yellow (third column of panels). Note that the cell slices shown in the panels correspond to different confocal positions of the microscope in order to make it possible the visualization of RhoG in all cases. (B) COS-1 cells were subjected to FITC-CTxB internalization experiments for 60 min as in (A). Cells were then fixed, stained with anti-GM130 antibodies, and subjected to confocal microscopy. The localization of CTxB (panel a) and GM130 (panel b) is shown in green and red, respectively. The areas of colocalization of FITC-CTxB with GM130 are shown in yellow (right panel).
We next performed pull-down experiments to determine the activation status of RhoG during the CTxB-dependent endocytic process. To this end, CTxB was added to exponentially growing cells at 37°C and, at the indicated time points, cell lysates were obtained and analysed by affinity chromatography using the GST-ELMO fusion protein. ELMO binds only to GTP-loaded RhoG (Katoh and Negishi, 2003), thus being an excellent bait to monitor the activation status of this GTPase during signaling events. As shown in Figure 3 (upper panel), CTxB induced a rapid and transient activation of wild-type RhoG in COS-1 cells, with maximal activation levels reproducibly found around 10 min of toxin stimulation (n = 5). As expected (Katoh and Negishi, 2003), GST-ELMO pulled down efficiently the constitutively active mutant of RhoG from cell lysates obtained in parallel transfections (Figure 3, upper panel, right lane). This result indicates that RhoG undergoes a complete activation/deactivation cycle during the early steps of the internalization of CTxB.
Figure 3.
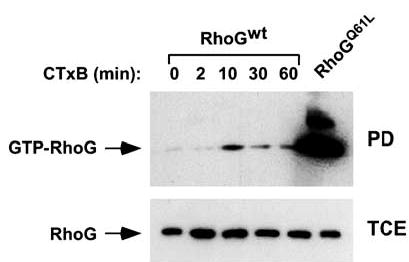
Activation of RhoG upon incubation of COS-1 cells with CTxB. Exponentially growing COS-1 cells expressing the indicated RhoG proteins (top) were stimulated with CTxB for the indicated periods of time. Cells were then lysed and RhoG GTP levels evaluated by pull-down experiments followed by immunoblot analysis with anti-AU5 antibodies (upper panel). As control (lower panel), cell lysates obtained from the same experiment were blotted with anti-AU5 antibodies to visualize the levels of expression of RhoG proteins in each experimental condition. wt, wild type; PD, pull-down; TCE, total cellular extracts.
The intracellular transit of RhoG depends on dynamin function
To confirm the nature of this endocytic route, we assessed the effect of caveolar trafficking inhibitors on the subcellular localization of both RhoG and CTxB. We first tested the effect of dynamin2K44A, a dominant-negative mutant protein that blocks the internalization of both clathrin- and caveolin-coated vesicles (Henley et al., 1998; Nichols et al., 2001; Torgersen et al., 2001; Conner and Schmid, 2003; Di Guglielmo et al., 2003; Nichols, 2003). Dynamin2K44A did not interfere with the translocation of wild-type RhoG from the cytosol to the plasma membrane upon FITC-CTxB treatment (Figure 4A, panels a–h). However, dynamin2K44A inhibited the subsequent internalization of both FITC-CTxB and RhoG to intracellular vesicles and, later on, to the Golgi apparatus (Figure 4A, panels e–h). As a consequence, RhoG and FITC-CTxB remained bound to the plasma membrane during all the incubation period (Figure 4A, panels a–h). This sequestration at the plasma membrane is better observed in top-to-bottom reconstructions of the transfected cells, in which both FITC-CTxB and RhoG are detected at the plasma membrane even after 30 min of temperature shift (Figure 4B). In contrast, cells lacking dynamin2K44A show a normal distribution of CTxB and RhoG inside the cell (Figure 4B). This effect is specific, because the overexpression of wild-type dynamin2 has no effect on the internalization of either RhoG or FITC-CTxB (Figure 4A, panels i–l; data not shown).
Figure 4.
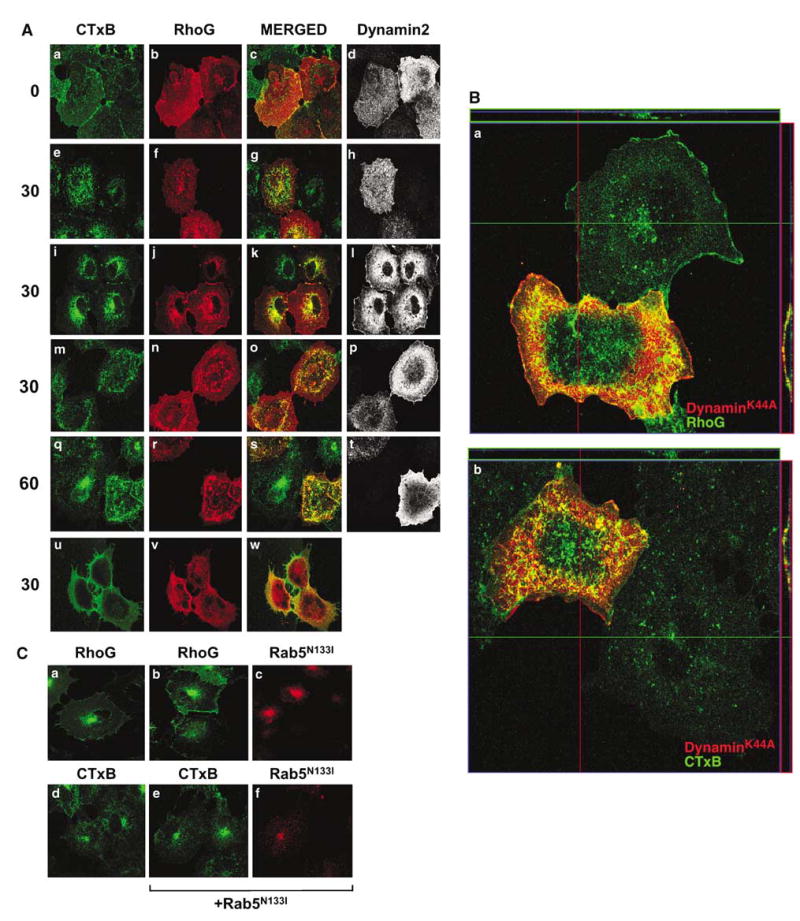
Effect of inhibitors of CTxB internalization on the subcellular localization of RhoG and RhoGQ61L. (A) Panels a–t: Effect of dynamin2K44A on RhoG trafficking. Cells were transfected with expression plasmids encoding either AU5-RhoG (a–l) or AU5- RhoGQ61L (m–t) in combination with wild-type (panels i–l) or dominant-negative versions (panels a–h and m–t) of dynamin2. Cells were then subjected to FITC-CTxB internalization experiments as indicated in Materials and methods. At the indicated minutes (left), cells were immunostained with both anti-AU5 and anti-dynamin2 antibodies and visualized by confocal microscopy. The subcellular localization of FITC-CTxB, RhoG proteins, and dynamin2 is shown in green (left panels), red (second column of panels), and white (right panels), respectively. The areas of colocalization between FITC-CTxB and AU5-RhoG GTPases are shown in yellow (panels c, g, k, o, and s). Note that the cell slices shown in the panels correspond to different confocal positions of the microscope in order to make it possible the visualization of RhoG in all cases. Panels u–w: Effect of methyl-β-cyclodextrin on RhoG internalization. Cells transiently expressing AU5-RhoG were incubated with methyl-β-cyclodextrin for 30 min at 37°C and then subjected to FITC-CTxB internalization experiments as indicated in Materials and methods. After 30 min of incubation with the toxin at 37°C, cells were immunostained with anti-AU5 antibodies and analysed by confocal microscopy as indicated above. (B) Confocal sections of COS-1 cells transiently expressing dynamin2K44A either alone (panels a and b) or with wild-type RhoG (panel a). These cells were treated with unmodified CTxB (panel a) or FITC-labeled CTxB (panel b) for 30 min as in (A) and processed for confocal microscopy as indicated in Materials and methods. Images show in red the localization of dynamin2K44A (panels a and b) and in green the localization of RhoG (panel a) and CTxB (panel b). Cells lacking red signals are cells that do not express the dynamin2 mutant and that have been used as negative controls in this assay. The green and red lanes across the image indicate the areas used for the serial confocal sections that were informatically stacked to build up the orthogonal cell views shown at the top and the right side of the panel, respectively. (C) COS-1 cells expressing wild-type RhoG either alone (panels a and c) or in the presence of Myc-tagged Rab5N133I (panels b, c, e, and f) were incubated with FITC-CTxB and subjected to internalization for 60 min as in (A). Green signals correspond to the subcellular localization of either wild-type RhoG (panels a and b) or FITC-CTxB (panels e and f). Red signals are those corresponding to the localization of the Rab5 dominant-negative mutant (panels c and g).
We also investigated the effect of the expression of dynaminK44A on the localization of RhoGQ61L. In the presence of dynamin2K44A, RhoGQ61L was observed at the plasma membrane, showing a general colocalization with the membrane-trapped FITC-CTxB (Figure 4A, panels m–t). Interestingly RhoGQ61L, as previously seen for wild-type RhoG and CTxB (see above; Figure 4A and B), was seen concentrated in large patches located at the dorsal side of the transfected cells rather than being dispersed homogeneously through all the cell surface (Figure 4A, panels m–t). This clustering phenotype is typically observed in GTPase-deficient mutants of dynamin2 (Henley et al., 1998; Pelkmans and Zerial, 2005).
Consistent with the lack of localization with markers of the clathrin pathway, the internalization of RhoG was not effected by the coexpression of Rab5N133I (Figure 4C, compare panels a and b), a dominant-negative mutant that blocks the internalization of clathrin-coated vesicles at the level of early endosomes (Li and Stahl, 1993). As expected, similar results were obtained when the internalization of CTxB was measured in the presence of this Rab5 mutant (Figure 4C, compare panels d and e).
Given the localization of RhoG in lipid rafts during the early steps of the treatment of cells with CTxB-treated cells, we finally examined the effect of methyl-β-cyclodextrin on the internalization of RhoG. This drug disrupts lipid rafts by removing cholesterol from the plasma membrane (Simons and Toomre, 2000). Treatment of cells with this drug blocked the translocation of wild-type RhoG to the plasma membrane and its subsequent accumulation in intracellular vesicles and the Golgi apparatus (Figure 4A, panel v; data not shown). As previously described (Orlandi and Fishman, 1998; Parton and Richards, 2003), methyl-β-cyclodextrin also inhibited the internalization of CTxB (Figure 4A, panel u). Altogether, these results demonstrate that RhoG requires lipid rafts for translocation to the plasma membrane and dynamin2 function for effective internalization.
Activated RhoG promotes internalization of CTxB-positive vesicles
The above results indicated that wild-type RhoG internalizes through caveola-derived vesicles to the Golgi apparatus. To test whether RhoG plays active roles in this process, we first used a cell ELISA to evaluate the effect of the constitutively active version of RhoG on CTxB internalization kinetics. We speculated that, if RhoG had roles in this process, its overexpression could induce alterations in the internalization rates of this bacterial toxin. To verify this hypothesis, biotin-labeled CTxB was bound to the plasma membrane of COS-1 cells by incubation at 4°C for 30 min. After this period, the internalization of CTxB was induced by transferring the cells to 37°C. At the indicated time points after the temperature shift, the percentage of membrane-bound biotin-CTxB was estimated using horseradish peroxidase (HRP)–streptavidin (see Materials and methods). Under these conditions, RhoGQ61L-expressing cells showed 10–20% more rapid kinetics of CTxB internalization than mock-transfected cells during the first 30 min of the assay (Figure 5A). We also observed that RhoGQ61L-expressing cells contained already 20% of lower levels of membrane-bound CTxB than the mock-transfected cells, indicating that some internalization occurred before the temperature shift (Figure 5B).
Figure 5.
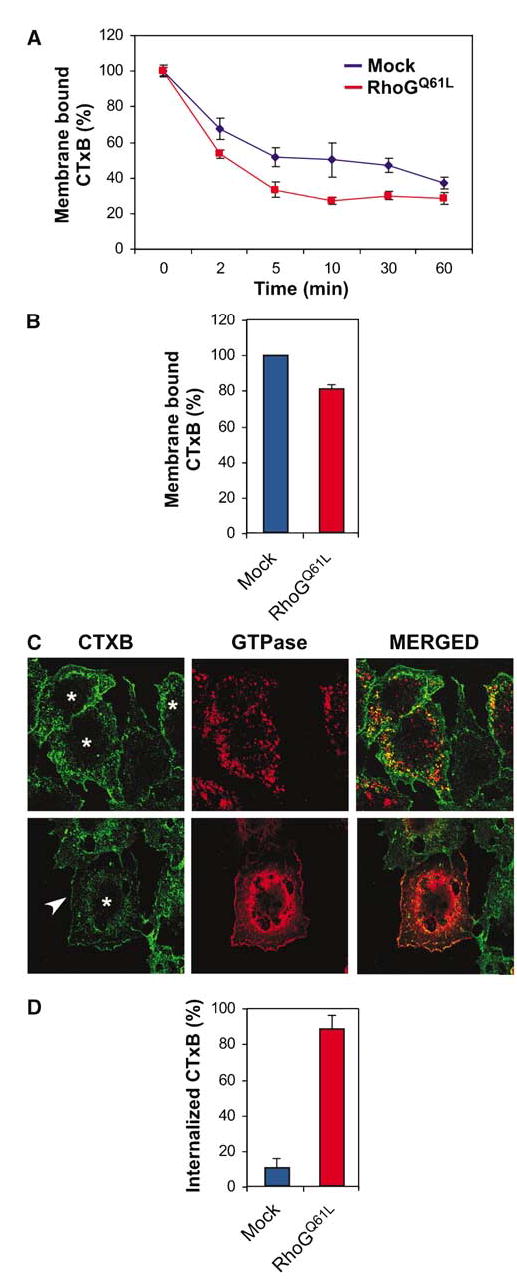
Effect of RhoGQ61L on CTxB internalization. (A, B) CTxB internalization rates using a cell ELISA technique. COS-1 cells expressing the indicated proteins were subjected to internalization experiments as indicated in Materials and methods. Values represent the mean and standard deviation of a representative experiment performed in triplicate taken after the indicated periods of internalization (A) or before the temperature shift to 37°C (B). Similar results were obtained in five independent experiments. (C) COS-1 cells expressing either RhoGQ61L (upper panels) or the RhoGQ61L/Rac1 chimera G (lower panels) were incubated with FITC-CTxB for 30 min at 4°C and then shifted to 37°C for 2 min. After this time, cells were stained with anti-AU5 antibodies and subjected to confocal microscopy analysis to detect FITC-CTxB (green signals, left panels), RhoG proteins (red signals, middle panels), and the colocalization of CTxB with each RhoG protein (yellow signal, right panels). Asterisks mark cells expressing RhoGQ61L (upper panel) or the RhoGQ61L/Rac1 chimera. The arrow marks the FITC-CTxB present in the plasma membrane. (D) Quantitation of FITC-CTxB internalization rates from the experiments described in (C). Values represent the mean and standard deviation of three independent experiments, each involving a total count of 100 cells.
As the ELISA assay cannot distinguish the CTxB internalized in transfected and non-transfected cells, we resorted to single-cell assays to bypass the underestimation of the effects of RhoG on CTxB internalization that is concomitant to cell ELISA studies. To this end, transfected cells were incubated with FITC-CTxB at 4°C and then shifted to 37°C for 2 min to allow the internalization of the toxin. After this time, cells were analysed by dual confocal microscopy to visualize FITC-CTxB and RhoGQ61L. The rate of internalization was then measured by looking at the presence of FITC fluorescence signals in either the plasma membrane or intracellular vesicles of single cells. Under these experimental conditions, the percentage of cells with internalized FITC-CTxB was nine times higher in RhoGQ61L-expressing cells than in untransfected cells of the same culture (Figure 5C, upper panels, cells labeled with asterisks; Figure 5D). As expected, the internalized, FITC-CTxB-positive vesicles colocalized with RhoGQ61L under these conditions (Figure 5C, top right panel, yellow areas). To test whether the effects of RhoGQ61L on CTxB internalization required the ability of RhoGQ61L to internalize from membranes, we performed similar experiments swapping RhoGQ61L by another mutant form of RhoGQ61L in which the C-terminus was replaced by the Rac1 tail (RhoGQ61L/Rac1 chimera G). As previously shown (Prieto-Sanchez and Bustelo, 2003), this chimeric protein is permanently bound to the plasma membrane and not present in vesicles (Figure 5C, lower panel in the middle). The RhoGQ61L/Rac1 chimera G, unlike RhoGQ61L, did not induce any detectable internalization of the bacterial toxin (Figure 5C, lower panel, cell labeled with asterisk). Likewise, Rac1Q61L did not induce the internalization of membrane-bound FITC-CTxB (data not shown; see also Figure 7), further supporting that the effect induced by RhoG cannot be generalized to structurally related GTPases.
Figure 7.
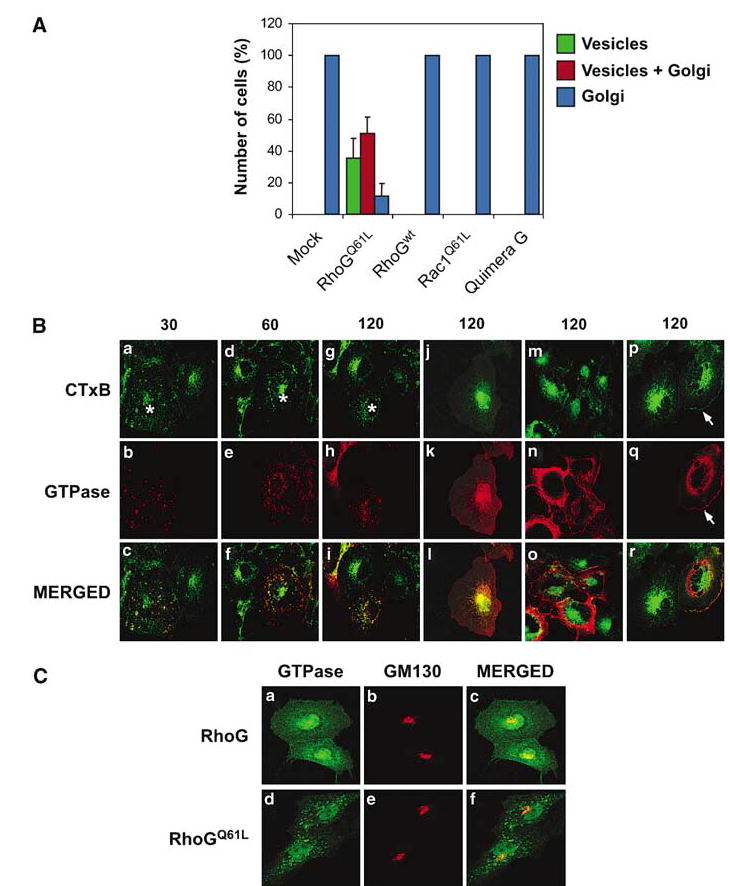
Effect of RhoGQ61L on the intracellular trafficking of CTxB vesicles. (A) COS-1 cells were transfected with plasmids encoding the indicated proteins. After 30 h, cells were incubated with FITC-CTxB for 30 min, washed, fixed, immunostained with anti-AU5 antibodies, and subjected to confocal microscopy to quantify the number of cells showing the subcellular localization of FITC-CTxB in vesicles (green bars), Golgi apparatus (blue bars), or in both locations (red bars). The histogram represents the mean and standard deviation of three independent experiments, each involving at least 100 cells. (B) Examples of localization of FITC-CTxB in COS-1 cells expressing different RhoG mutants and GTPases. COS-1 cells were transfected with plasmids encoding AU5-RhoGQ61L (panels a–i, read from top to bottom), wild-type AU5-RhoG (panels j–l), AU5-Rac1Q61L (panels m–o), or AU5-RhoGQ61L/Rac1 chimera G (panels p–r). After 30 h, cells were incubated with FITC-CTxB for the indicated periods of time (top, in min), immunostained with anti-AU5 antibodies, and subjected to confocal microscopy. The subcellular localization of CTxB and GTPases is shown in green (upper panels) and red (middle panels), respectively. The areas of colocalization between CTxB and the GTPases are shown in yellow (lower panels). The asterisks mark cells expressing RhoGQ61L. The arrows in panels p and q mark the fractions of CTxB and Rac1/RhoG chimeric protein G present at the plasma membrane after 120 min of toxin internalization. (C) Effect of RhoG on the structure of the Golgi apparatus. COS-1 cells expressing the indicated versions of RhoG (left) were fixed, stained with anti-AU5 and anti-GM130 antibodies, and analysed by confocal microscopy. The localization of the GTPases (panels a, c, d, and f) and the Golgi apparatus (panels b, c, e, and f) is shown in green and red, respectively.
Alterations in the structure of RhoG-positive vesicles by the expression of RhoGQ61L effector region mutants
The mutation of single amino acids present in GTPase effector regions leads to the elimination of binding of specific downstream elements and, consequently, to the inactivation of specific cellular responses (Joneson et al., 1996). Based on these observations, we decided to test the effect of two effector mutants of RhoGQ61L (F37A and Y40C) on the structure of RhoG-positive vesicles. These experiments indicated that RhoGY40C+Q61L showed a RhoGQ61L-like intracellular localization (Figure 6, compare left panels). In contrast, RhoGF37L+Q61L displayed a heterogeneous pattern of intracellular distribution in small vesicles and highly enlarged vesicles (Figure 6, upper middle and right panels). These giant vesicles showed heterogeneous sizes that could reach diameters even larger than 10 μm. They also showed a highly convoluted structure, with multiple invaginations into the lumen (Figure 6, upper panel on the right). In contrast, the smaller vesicles showed sizes similar to RhoGQ61L (≈1.8 μm). As expected, the analogous effector mutants of Rac1 were not observed in any type of vesicles (Figure 6, lower middle and right panels), further confirming the differential behavior of these two GTPases. These results indicate that the unbalanced interaction of RhoGQ61L with specific effectors triggers changes in the structure of RhoG-positive vesicles.
Figure 6.
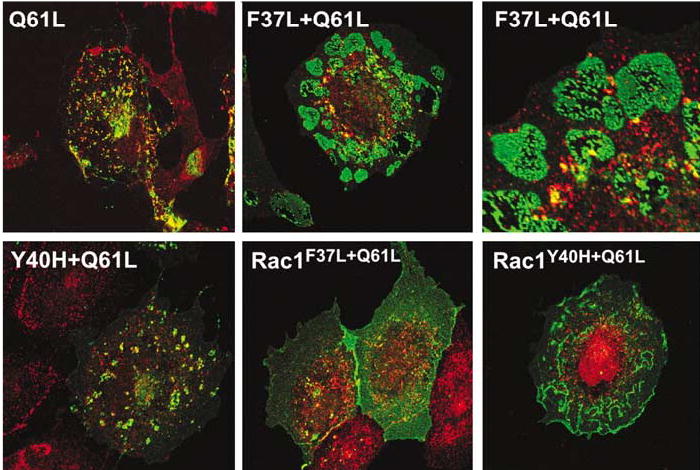
Vesicle structure induced by RhoGQ61L effector mutants. COS-1 cells transfected with the indicated mutants of RhoG (upper panels and lower panel on the left) and Rac1 (rest of panels) were fixed and stained with anti-AU5 (green) and anti-caveolin1 (red) antibodies. The areas of colocalization between the GTPases and caveolin1 are shown in yellow. The upper right panel is an enlargement of a section of the cell shown in the upper middle panel.
Nucleotide cycling in RhoG is required for the transit of CTxB-positive vesicles to the Golgi apparatus
Several indications suggested to us that RhoG could also affect the trafficking of CTxB vesicles to the Golgi apparatus. Thus, the GTP levels of wild-type RhoG decrease sharply after 10 min of CTxB treatment (Figure 3), suggesting that RhoG is probably in the inactive state when reaching the Golgi apparatus. Moreover, RhoGQ61L and its mutants, unlike their wild-type counterpart, are not seen at the Golgi apparatus in exponentially growing and CTxB-treated cells (Figures 1 and 6, and Supplementary Figure S1). These results suggested that the inactivation of RhoG could be required for allowing the final transit of the RhoG-coated vesicles to the Golgi apparatus. To evaluate this possibility, we used two-color immunofluorescence analysis to track down the trafficking of FITC-CTxB toward the Golgi apparatus in the presence or absence of RhoGQ61L. These experiments indicated that the mock-transfected cells displayed the toxin in the Golgi in 100% of cases (Figure 7A). In contrast, cells expressing RhoGQ61L displayed a more heterogeneous distribution of FITC-CTxB, as this toxin was found in vesicles (35%), Golgi apparatus (12%), or vesicles plus Golgi apparatus (52%) (Figure 7A). Such delays are observed even after 2 h of incubation with the toxin (data not shown), approximately 1.5 h after all the CTxB reaches the Golgi apparatus in normal cells. The percentage of FITC-CTxB located in the Golgi in RhoGQ61L-transfected cells did not change upon coexpression of the dominant-negative Rab5 (data not shown), indicating that CTxB does not get there through the use of the clathrin-dependent pathway but, rather, by escaping the blockage imposed by RhoGQ61L. Examples of cells with CTxB distributed in vesicles and vesicles plus Golgi apparatus can be found in Figure 7B (panels h and a, d; respectively). In these images is also apparent the homogeneous distribution of CTxB in the Golgi apparatus in the non-transfected cells (Figure 7B, panels a, d, and g). We have seen no alterations in the transit of CTxB vesicles to the Golgi apparatus upon expression of either wild-type RhoG (Figure 7A and B, panels j–l) or Rac1Q61L (Figure 7A and B, panels m–o), indicating that this phenotype reflects a functional role of RhoG in this endocytic step. Likewise, the RhoGQ61L/Rac1 chimera G, although blocking the internalization of a small fraction of FITC-CTxB at the plasma membrane in 80% of the transfected cells (Figure 7B, panels p–r, arrow, data not shown), did not affect the transit of the internalized bacterial toxin to the Golgi apparatus (Figure 7A and B, panels p–r), suggesting that RhoGQ61L requires the physical localization on vesicles to inhibit their transit to this cellular organelle. The Golgi apparatus shows a normal structure in RhoGQ61L-expressing cells (Figure 7C, compare panels b and e), ruling out that the effect of this GTPase on CTxB trafficking is due to indirect effects on Golgi structure and/or dynamics.
The endogenous activity of RhoG is not essential for the internalization of CTxB-positive vesicles
We finally used siRNA technology to test whether the activity of RhoG was essential for the endocytosis of CTXB-positive vesicles (see Materials and methods). Using a pool of four different siRNAs, we reduced the expression of the endogenous rhoG mRNA by more than 90% between 24 and 72 h after transfection (Figure 8A). The reduction of rhoG transcripts led to the concomitant inhibition of RhoG protein expression in all transfected cells, as determined by immunofluorescence techniques with an anti-RhoG polyclonal antibody (Figure 8C). By contrast, the pool of rhoG siRNAs had no effects on the endogenous levels of Rac1 protein (Figure 8B, middle panel), confirming its specificity toward the rhoG transcript. These siRNAs were then used to evaluate the role of RhoG inhibition on CTxB internalization, using both ELISA- and single-cell assays (see Materials and methods). We could not observe any differential behavior in the internalization of CTxB between the untransfected and rhoG-siRNA-transfected cells regardless of the time point analysed or the experimental strategy used (Figure 8D and E). These results suggest that RhoG activity is important, but not essential, for the uptake of molecules via the caveola-dependent pathway.
Figure 8.
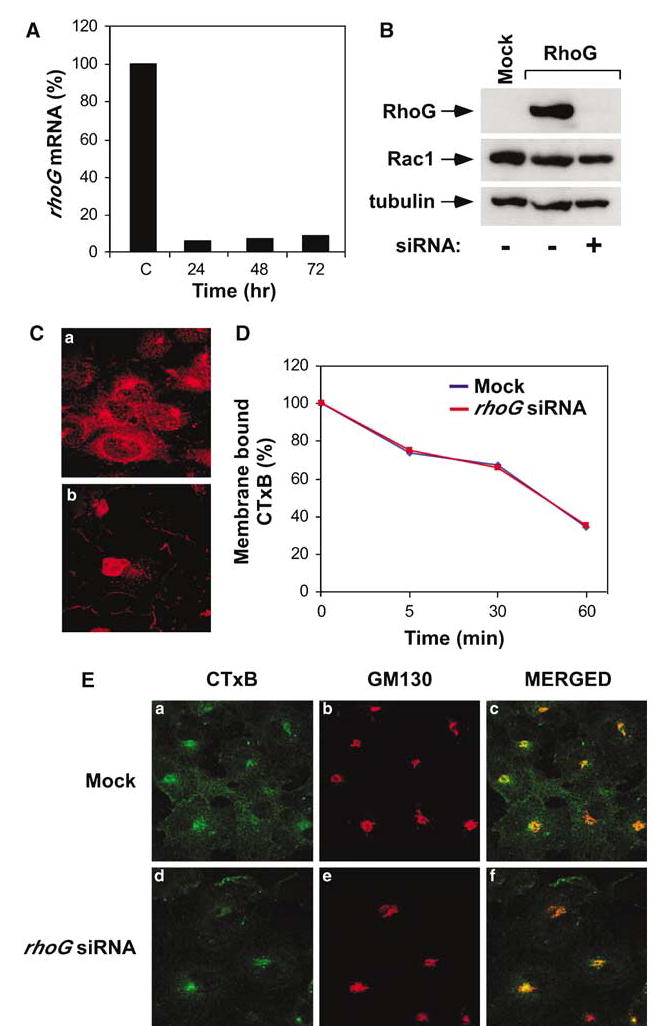
Endogenous RhoG activity is not essential for the internalization and delivery of caveola-derived vesicles to the Golgi apparatus. (A) Effect of rhoG siRNA on the levels of endogenous rhoG mRNA. COS-1 cells were transfected with rhoG siRNA as indicated in Materials and methods and, at the indicated times, lysed and their rhoG transcript levels determined by quantitative RT–PCR. C, control sample from untransfected COS-1 cells. (B) Effect of the rhoG siRNA pool on the levels of ectopically expressed RhoG and endogenous Rac1. COS-1 cells were transfected with RhoG either in the absence (−) or presence (+) of the rhoG siRNA pool, as indicated in Materials and methods. At 48 h after transfection, total cellular lysates were obtained and analysed by immunoblot analysis with anti-AU5 (upper panel), anti-Rac1 (middle panel), and anti-tubulin (lower panel) antibodies. (C) Effect of the rhoG siRNA pool on the levels of endogenous RhoG protein. Mock- (panel a) or rhoG siRNA-transfected (panel b) COS-1 cells were fixed 48 h post-transfection, stained with anti-RhoG antibodies, and analyzed by confocal immunofluorescence analysis. The nuclear fluorescence that is not affected by the rhoG siRNA (panel b) is due to a non-specific cross-reactivity of the antibody used in these studies (data not shown). (D) CTxB internalization rates using a cell ELISA technique. COS-1 cells were either mock-transfected (blue) or transfected with the rhoG siRNA pool (red) and, after 48 h, subjected to internalization experiments as indicated in Materials and methods. Similar results were obtained in two independent experiments. (E) COS-1 cells were transfected under the indicated conditions (left) for 48 h and then subjected to FITC-CTxB internalization experiments as indicated in Materials and methods. After 60 min, cells were fixed, stained with GM130 antibodies, and visualized by direct confocal fluorescence microscopy. The subcellular localization of CTxB (panels a and d) and GM130 (panels b and e) is shown in green and red, respectively. Colocalization of both proteins is shown in yellow (right panels).
Discussion
In this work, we report the association of the Rho/Rac family member RhoG with the internalization route of caveolae. Using immunofluorescence techniques, we have observed that RhoGQ61L is located preferentially in endocytic structures that are extensively decorated with markers of the caveola-derived pathway, such as caveolin and internalized CTxB. In contrast, RhoGQ61L-positive vesicles do not stain for typical markers of the clathrin-dependent pathway. We have also observed that the induction of the internalization of caveola/lipid rafts via incubation of cells with CTxB leads to a time-dependent activation of wild-type RhoG and, in parallel, to the serial transfer of the GTPase from the cytosol to the plasma membrane, vesicles and, at later stages, the Golgi apparatus. Wild-type RhoG colocalizes during all these trafficking events with CTxB, further confirming that it follows the caveola/lipid raft-dependent endocytic route. Reinforcing these observations, we have observed that the internalization of RhoG, as previously shown for CTxB (Nichols, 2002), is blocked by dynamin2K44A but not by a Rab5 dominant-negative mutant.
To study the specific role of RhoG in this process, we have resorted to both gain- and loss-of-function approaches. In the former experimental avenue, we could demonstrate that RhoGQ61L has two different functions during the endocytic process of cholera toxin. On the one hand, it promotes the internalization of membrane-bound CTxB, as determined by both population- and single-cell-based assays. On the other hand, RhoGQ61L influences negatively the final transfer of CTxB-coated vesicles to the Golgi apparatus. In agreement with this, it has been observed that the proportion of cells that normally deliver the internalized CTxB to the Golgi apparatus is significantly smaller in RhoGQ61L-expressing cells than in either non-transfected or Rac1Q61L-expressing cells. This second property is probably non-physiological, because wild-type RhoG must be in the GDP-bound form at those stages (see above; Figure 3). Accordingly, we believe that this inhibitory activity is probably a reflection of the inability of RhoGQ61L to cycle back to the GDP-bound state during the latest stages of the internalization of CTxB vesicles. Finally, we have observed dramatic changes in the overall vesicle structures of the transfected cells when an effector mutant (F37L) of RhoG is utilized, suggesting that the overall homeostasis of at least a subset of those vesicles depends on adequate signal propagation from RhoGQ61L.
In contrast to these results, our loss-of-function studies using rhoG-directed siRNAs indicate that the overall process of CTxB internalization is RhoG-independent. Three notes of caution must be discussed in relation to these negative results. Firstly, it has been shown that the blockage of the caveola-derived pathway leads to the internalization of CTxB by the clathrin-dependent pathway (Nichols and Lippincott-Schwartz, 2001). Accordingly, it can be argued that any potential effect of RhoG in the early internalization steps of CTxB could be masked by this alternative pathway. We believe that this problem can be ruled out, because it has been shown before that the CTxB internalizing through clathrin vesicles gets recycled back to the plasma membrane, never reaching the Golgi apparatus (Nichols and Lippincott-Schwartz, 2001). Secondly, it has also been shown that GPI-anchored proteins can internalize constitutively via a clathrin- and caveola-independent route (Nichols and Lippincott-Schwartz, 2001). We believe that this is not the case, because we have shown that dynamin2K44A, a mutant the blocks clathrin- and caveola-dependent traffic but not other types of endocytosis, aborts all the internalization of CTxB in COS-1 cells. Finally, it must be indicated that our experiments do not admit a fine quantification of minor defects in the internalization of CTxB. This is clearly observed in our experiments with the RhoGQ61L/Rac1 chimera G protein, because this mutant can retain a fraction of CTxB at the plasma membrane without affecting the amount of CTxB visualized in the Golgi apparatus by immunofluorescence. Based on these observations, we cannot rule out at present that RhoG could affect somehow the efficiency of the overall process of internalization. In any case, it is clear that RhoG, unlike dynamin2, is not important for the overall endocytic process per se. In this regard, it is possible that the missing function regulated by RhoG could be either replaced or bypassed by other regulatory proteins. The observation that the RhoGQ61L/Rac1 chimera G retains a significant fraction of CTxB in the plasma membrane supports this second possibility.
The involvement of RhoG in the caveola/lipid raft route seems highly specific. Thus, we have not observed the localization of other Rho/Rac family proteins (Rac1, RhoA, RhoB, RhoC) in caveolin-positive vesicles (this work and data not shown). Moreover, we could not find any detectable translocation of wild-type Rac1 during the endocytosis of CTxB or any effect of constitutively active Rac1 in this biological process. Experimental evidence derived from the use of the membrane-localized RhoGQ61L/Rac1 mutant (chimera G) indicates that the specific implication of RhoG in this process is due to both its different subcellular localization and the engagement of effector molecules not shared with Rac1. Thus, the demonstration that chimera G cannot reproduce some of the RhoGQ61L effects on vesicle trafficking establishes a clear correlation between the vesicle-related functions of RhoG and its subcellular localization. A similar link has been established recently to explain the differential effects of Rac1 and Rac2 in neutrophil responses (Filippi et al., 2004). On the other hand, the participation of distinct effector proteins is supported by the observation that Rac1Q61L, unlike the chimeric mutant, does not affect negatively the internalization of a fraction of the membrane-bound CTxB despite displaying a subcellular localization similar to that shown by the RhoGQ61L/Rac1 chimera. Consistent with this view, we and others have shown before that RhoG and Rac1 share only a small number of effector molecules and biological properties despite the high similarity of their switch regions (Wennerberg et al., 2002; Katoh and Negishi, 2003; Prieto-Sanchez and Bustelo, 2003). This differential signaling is due to amino-acid divergences in other areas of the GTPases, including the switch I, β2/β3 hairpin, α5 helix, and the C-terminal polybasic region (Prieto-Sanchez and Bustelo, 2003). We are currently searching for specific RhoG binding proteins using both two-hybrid and proteomic approaches to shed light on the signaling machinery involved in this biological process. Moreover, a recent study using an siRNA library made against human kinases has revealed a plethora of regulatory molecules involved in different stages of caveola trafficking (Pelkmans et al., 2005; Pelkmans and Zerial, 2005). It will be interesting to see whether some of those kinases are direct or indirect effector molecules of the RhoG pathway. Continuing efforts in this area will allow us to characterize in detail the precise signaling role of RhoG and its effectors in this important trafficking route.
Materials and methods
GST-ELMO pull-down experiments
GST-ELMO fusion protein was expressed in Escherichia coli and purified by affinity chromatography onto glutathione-coated beads (Amersham Biosciences AG). COS-1 cells growing in 10 cm dishes were transfected with 4 μg of the indicated constructs using the DEAE-dextran method. At 48 h after transfection, cells were incubated with HRP-labeled CTxB (0.5 μg/ml; Calbiochem-Novabiochem) in DMEM plus 10% calf serum. After the indicated periods of time, cells were washed twice with chilled PBS solution and disrupted in a lysis buffer containing 20 mm Tris-HCl (pH 7.5), 150 mm NaCl, 5 mm MgCl2, 0.5% Triton X-100, 5 mm β-glycerophosphate (Sigma-Aldrich), 1 mm DTT (Sigma-Aldrich), and a protease-inhibitor mixture (Cφmplete, Roche Molecular Biochemicals). Lysates were incubated on ice for 10 min and precleared by centrifugation at 14 000 r.p.m. at 4°C for 10 min. A 10 μg portion of GST-ELMO fusion protein coupled to glutathione-Sepharose beads was then added to the cleared lysates and incubated for 60 min at 4°C. After washes, associated proteins were separated by electrophoresis, transferred to nitrocellulose filters (Schleicher and Shuell Bioscience), and subjected to immunoblot analysis using anti-AU5 antibodies. Immunoreacting bands were developed using a standard chemoluminescent method (ECL, Amersham Biosciences AG).
Measurements for cholera toxin B subunit internalization
For immunofluorescence detection of CTxB internalization, COS-1 cells were incubated 30 h after transfection with FITC-CTxB (0.5 μg/ml; Sigma-Aldrich) in DMEM supplemented with 10% calf serum at 4°C for 30 min. Cells were washed with media, shifted to 37°C for the indicated periods of time, and fixed with 3.7% formaldehyde/PBS for immunofluorescence detection. In the case of cell ELISA determinations, COS-1 cells were plated in 24-well dishes (30 000 cells/well) and transfected. After 48 h, cells were cooled to 4°C for 15 min and incubated with biotin-labeled CTxB (0.5 μg/ml; Sigma-Aldrich) in DMEM plus 10% calf serum at 4°C for 30 min. Cells were washed three times with medium without toxin at 4°C, incubated at 37°C/5% CO2 for the indicated periods of time, and fixed as above. Cells were then washed with PBS and incubated with HRP–streptavidin (1:100 dilution in PBS plus 5% bovine serum albumin; Amersham Biosciences AG) for 30 min at room temperature to label the toxin remaining on the cell surface. After extensive washes with PBS, the colorimetric reaction was performed with the Immunopure TMB Substrate kit (Pierce Biotechnology) according to the manufacturer’s instructions. Experiments were carried out in triplicate and data presented as a percentage of the initial surface-bound toxin.
Quantification of CTxB internalization and trafficking to the Golgi apparatus
COS-1 cells were plated on coverslips placed into six-well plates at a concentration of 75 000 cells/well. At 30 h after transfection (1 μg of plasmid/well), cells were incubated at 37°C in DMEM with 10% calf serum and FITC-CTxB (0.5 μg/ml), fixed with 3.7% formaldehyde in PBS, and subjected to immunofluorescence analysis as described above. Quantification of the internalization and subcellular localization of CTxB was performed by analysing 100 cells from each transfection that had been captured previously with an Axioplan 2 microscope (Zeiss) using the Openlab software (version 3.1.5, Hamamatsu Photonics).
RhoG knockdown using siRNAs
A pool of four siRNA duplexes against human rhoG mRNA was obtained from the Dharmacon siRNA collection (M-008995-00-0010; see www.dharmacon.com). COS-1 cells were plated onto poly-l-lysine-coated coverslips at a density of 40 000 cells/well and transfected with the rhoG siRNA pool (150 pmol) using Lipofectamine 2000 (Invitrogen). At 24 h after transfection, CTxB internalization experiments were performed as indicated above.
Quantitative reverse transcription polynucleotide chain reactions
COS-1 cells in 10 cm plates were transfected with 600 pmol of the rhoG siRNA pool as above. At 24, 48, and 72 h after transfection, cells were lysed and total RNA extracted using the RNAeasy kit (Qiagen). Total RNA was quantified loading aliquots of the purified RNAs in an RNA 6000 Nano Chip (Agilent Technologies). Quantitative PCR was performed using the QuantiTect SYBR Green RT–PCR kit (Qiagen). Primers used for rhoG mRNA amplification were 5′-GTTTCTCCATTGCCAGTCCG-3′ (sense strand) and 5′-CACCGTCGGTCTCCACACG-3′ (antisense strand). Amplifications were performed using an iCycler machine (Bio-Rad Laboratories). 18S rRNA primers were used as controls for quantitation.
Supplementary Material
Acknowledgments
We thank M Blázquez and Dr P Fort for excellent technical assistance and the supply of anti-RhoG antibodies, respectively. We also thank Dr H Lee for the cloning of human rab cDNAs and the generation of rab point mutants. This work was supported by grants from both the US National Cancer Institute (5-R01-CA73735-08) and the Spanish Ministry of Education and Science (SAF2003-00028). RMP-S and IMB are students of the Molecular and Cellular Cancer Biology graduate program of the CIC and the University of Salamanca and are supported by FPU fellowships (AP2000-3829 and FP2000-6489; Spanish Ministry of Education and Science).
Footnotes
Supplementary Information accompanies the paper on Oncogene website (http://www.nature.com/onc)
References
- Conner SD, Schmid SL. Nature. 2003;422:37–44. doi: 10.1038/nature01451. [DOI] [PubMed] [Google Scholar]
- Cox D, Chang P, Zhang Q, Reddy PG, Bokoch GM, Greenberg S. J Exp Med. 1997;186:1487–1494. doi: 10.1084/jem.186.9.1487. [DOI] [PMC free article] [PubMed] [Google Scholar]
- Di Guglielmo GM, Le Roy C, Goodfellow AF, Wrana JL. Nat Cell Biol. 2003;5:410–421. doi: 10.1038/ncb975. [DOI] [PubMed] [Google Scholar]
- Ellis S, Mellor H. Trends Cell Biol. 2000;10:85–88. doi: 10.1016/s0962-8924(99)01710-9. [DOI] [PubMed] [Google Scholar]
- Felberbaum-Corti M, Van Der Goot FG, Gruenberg J. Nat Cell Biol. 2003;5:382–384. doi: 10.1038/ncb0503-382. [DOI] [PubMed] [Google Scholar]
- Filippi MD, Harris CE, Meller J, Gu Y, Zheng Y, Williams DA. Nat Immunol. 2004;5:744–751. doi: 10.1038/ni1081. [DOI] [PubMed] [Google Scholar]
- Gauthier-Rouviere C, Vignal E, Meriane M, Roux P, Montcourier P, Fort P. Mol Biol Cell. 1998;9:1379–1394. doi: 10.1091/mbc.9.6.1379. [DOI] [PMC free article] [PubMed] [Google Scholar]
- Gonzalez-Gaitan M. Nat Rev Mol Cell Biol. 2003;4:213–224. doi: 10.1038/nrm1053. [DOI] [PubMed] [Google Scholar]
- Greenberg S. J Leukoc Biol. 1999;66:712–717. doi: 10.1002/jlb.66.5.712. [DOI] [PubMed] [Google Scholar]
- Gruenberg J. Nat Rev Mol Cell Biol. 2001;2:721–730. doi: 10.1038/35096054. [DOI] [PubMed] [Google Scholar]
- Henley JR, Krueger EW, Oswald BJ, McNiven MA. J Cell Biol. 1998;141:85–99. doi: 10.1083/jcb.141.1.85. [DOI] [PMC free article] [PubMed] [Google Scholar]
- Hoppe AD, Swanson JA. Mol Biol Cell. 2004;15:3509–3519. doi: 10.1091/mbc.E03-11-0847. [DOI] [PMC free article] [PubMed] [Google Scholar]
- Joneson T, McDonough M, Bar-Sagi D, Van Aelst L. Science. 1996;274:1374–1376. doi: 10.1126/science.274.5291.1374. [DOI] [PubMed] [Google Scholar]
- Katoh H, Negishi M. Nature. 2003;424:461–464. doi: 10.1038/nature01817. [DOI] [PubMed] [Google Scholar]
- Katoh H, Yasui H, Yamaguchi Y, Aoki J, Fujita H, Mori K, et al. Mol Cell Biol. 2000;20:7378–7387. doi: 10.1128/mcb.20.19.7378-7387.2000. [DOI] [PMC free article] [PubMed] [Google Scholar]
- Li G, Stahl PD. J Biol Chem. 1993;268:24475–24480. [PubMed] [Google Scholar]
- Massol P, Montcourrier P, Guillemot JC, Chavrier P. EMBO J. 1998;17:6219–6229. doi: 10.1093/emboj/17.21.6219. [DOI] [PMC free article] [PubMed] [Google Scholar]
- May V, Schiller MR, Eipper BA, Mains RE. J Neurosci. 2002;22:6980–6990. doi: 10.1523/JNEUROSCI.22-16-06980.2002. [DOI] [PMC free article] [PubMed] [Google Scholar]
- Nichols B. J Cell Sci. 2003;116:4707–4714. doi: 10.1242/jcs.00840. [DOI] [PubMed] [Google Scholar]
- Nichols BJ. Nat Cell Biol. 2002;4:374–378. doi: 10.1038/ncb787. [DOI] [PubMed] [Google Scholar]
- Nichols BJ, Kenworthy AK, Polishchuk RS, Lodge R, Roberts TH, Hirschberg K, et al. J Cell Biol. 2001;153:529–541. doi: 10.1083/jcb.153.3.529. [DOI] [PMC free article] [PubMed] [Google Scholar]
- Nichols BJ, Lippincott-Schwartz J. Trends Cell Biol. 2001;11:406–412. doi: 10.1016/s0962-8924(01)02107-9. [DOI] [PubMed] [Google Scholar]
- Orlandi PA, Fishman PH. J Cell Biol. 1998;141:905–915. doi: 10.1083/jcb.141.4.905. [DOI] [PMC free article] [PubMed] [Google Scholar]
- Parton RG, Richards AA. Traffic. 2003;4:724–738. doi: 10.1034/j.1600-0854.2003.00128.x. [DOI] [PubMed] [Google Scholar]
- Pelkmans L, Fava E, Grabner H, Hannus M, Habermann B, Krausz E, et al. Nature. 2005;436:78–86. doi: 10.1038/nature03571. [DOI] [PubMed] [Google Scholar]
- Pelkmans L, Helenius A. Traffic. 2002;3:311–320. doi: 10.1034/j.1600-0854.2002.30501.x. [DOI] [PubMed] [Google Scholar]
- Pelkmans L, Zerial M. Nature. 2005;436:128–133. doi: 10.1038/nature03866. [DOI] [PubMed] [Google Scholar]
- Prieto-Sanchez RM, Bustelo XR. J Biol Chem. 2003;278:37916–37925. doi: 10.1074/jbc.M301437200. [DOI] [PubMed] [Google Scholar]
- Sabharanjak S, Sharma P, Parton RG, Mayor S. Dev Cell. 2002;2:411–423. doi: 10.1016/s1534-5807(02)00145-4. [DOI] [PubMed] [Google Scholar]
- Simons K, Toomre D. Nat Rev Mol Cell Biol. 2000;1:31–39. doi: 10.1038/35036052. [DOI] [PubMed] [Google Scholar]
- Torgersen ML, Skretting G, van Deurs B, Sandvig K. J Cell Sci. 2001;114:3737–3747. doi: 10.1242/jcs.114.20.3737. [DOI] [PubMed] [Google Scholar]
- Vignal E, Blangy A, Martin M, Gauthier-Rouviere C, Fort P. Mol Cell Biol. 2001;21:8022–8034. doi: 10.1128/MCB.21.23.8022-8034.2001. [DOI] [PMC free article] [PubMed] [Google Scholar]
- Wennerberg K, Ellerbroek SM, Liu RY, Karnoub AE, Burridge K, Der CJ. J Biol Chem. 2002;277:47810–47817. doi: 10.1074/jbc.M203816200. [DOI] [PubMed] [Google Scholar]
- Wu WJ, Erickson JW, Lin R, Cerione RA. Nature. 2000;405:800–804. doi: 10.1038/35015585. [DOI] [PubMed] [Google Scholar]
- Zerial M, McBride H. Nat Rev Mol Cell Biol. 2001;2:107–117. doi: 10.1038/35052055. [DOI] [PubMed] [Google Scholar]
Associated Data
This section collects any data citations, data availability statements, or supplementary materials included in this article.