

Abstract
Objective
To better understand factors associated with Medicaid enrollment among low-income, community-dwelling elderly persons and to examine the effect of Medicaid enrollment on the use of health care services by elderly persons, taking into account selection in program participation.
Data Sources
1996 Medicare Current Beneficiary Survey (MCBS) Access to Care and Cost and Use files.
Methods
Individual-level predictions of the probability of dual enrollment are obtained from equations that estimate jointly the residential status of Medicare beneficiaries (community versus institution) and the probability of Medicaid enrollment among community-dwelling eligible beneficiaries. Predicted values are then substituted into the service use equations, which are estimated via two-part models.
Principal Findings
Less than half of all community-dwelling elderly persons with incomes at or below 100 percent of the Federal Poverty Level (FPL) were enrolled in Medicaid in 1996. Once selective enrollment was accounted for, there was limited evidence of a dual enrollment effect on service use. Although there were no effects of state Medicaid policy variables on the probability that beneficiaries lived in the community (as opposed to nursing homes), the effects of state's Medicaid generosity in home and community-based services had a sizeable and statistically significant effect on influencing the likelihood that eligible elderly persons enrolled in Medicaid.
Conclusions
Our results provide compelling evidence that Medicaid participation can be influenced by state policy. The observation that “policy matters” provides new insights into how existing programs might reach a larger proportion of potentially eligible beneficiaries.
Keywords: Dual enrollment, elderly, service use, policy effects, self-selection
Medicaid has traditionally been an important third-party payer for impoverished and disabled elderly persons. For low-income elderly persons who meet financial criteria,1 the Medicaid program assumes the out-of-pocket expenses associated with Medicare coinsurance and entitles beneficiaries to a comprehensive set of acute and long-term care benefits.
Despite its potential for improving access to health care among low-income elderly persons, relatively little is known about take-up rates for Medicaid or its impact on service use among those enrolled. Existing literature has focused primarily on contrasting the characteristics and patterns of service use of dually enrolled persons (frequently referred to as “dual eligibles”) with those of other Medicare beneficiaries using bivariate associations (O'Brien and Feder 1999; Lamphere et al. 1998; Health Care Financing Administration 1997; Feder 1997; Merrell et al. 1997; Rowland 1996; Laschober and Olin 1996). Such studies consistently report relatively lower health status and higher service use among dual enrollees. Although more recent research has used multivariate models to control for potential confounders when estimating the effect of Medicaid enrollment on service use and costs (Hurd and McGarry 1997; Ettner 1998; Liu et al. 1998; Harber and Mitchell 1997; Kenney et al. 1995), the analyses have generally failed to address the bias that would result from the likely endogeneity of the dual enrollment indicator. Endogeneity would occur, for example, if unobserved or unmeasured need for Medicaid-covered services leads to both program enrollment and high service use. It may also arise if past service use results in Medicaid eligibility and subsequent enrollment. To the extent that differences between Medicaid eligible persons enrolled and not enrolled in the program are not completely explained by demographic and health-status variables, endogeneity due to selective enrollment is an important concern which may lead to overestimation of the effects of dual enrollment on service use if not explicitly addressed.
Evidence beginning to accrue suggests that Medicaid participation rates among eligible community-dwelling elderly persons are well below 100 percent. Underenrollment is believed to occur among those eligible for full Medicaid benefits as well as those eligible for more restricted benefits under newer programs, such as the Qualified Medicare Beneficiary (QMB) and Specified Low-Income Medicare Beneficiary (SLMB). The Congressional Research Service estimated that only one third of elderly persons with incomes below the FPL were enrolled in Medicaid in 1987 (Congressional Research Service 1988). Using data from the Survey of Income and Program Participation and the National Medical Expenditure Surveys, Ettner (1997) reported similar participation rates. Recent research explicitly addressing enrollment by elderly persons in state Medicaid QMB and SLMB programs suggests that 45 percent of those eligible for benefits in the lowest income category (up to 100 percent of the poverty level) are not participating. Participation among those with incomes between 100 percent and 120 percent of poverty is believed to be even lower (Barents Group 1999).
Several reasons have been offered for these relatively low participation rates. Lack of information about program and eligibility criteria (Public Policy Institute 1992) may play a role. The welfare stigma associated with government assistance may also keep some eligible beneficiaries from enrolling (Moffitt 1983 and 1987). Large state variation in take-up rates, however, suggests that institutional barriers to program participation, including lack of effective outreach efforts and cumbersome enrollment processes, may be important factors underlying low participation rates. Findings reported in Families USA (1998), Nemore (1999), and Lamphere and Rosenbach (2000) lend support to this hypothesis.
The purpose of this study is to gain a better understanding of the factors associated with Medicaid enrollment among low-income, community-dwelling elderly persons and to examine the effect of Medicaid enrollment on elderly persons’ use of health care services, taking into account selective program participation. Of particular interest in the enrollment analysis is whether state allocation of resources for Medicaid home- and community-based services (HCBS) influences Medicaid enrollment by eligible, community-dwelling beneficiaries. A key feature of our analysis is to estimate simultaneously the residential status of Medicare beneficiaries (community versus institution) and the probability of Medicaid enrollment among community-dwelling eligible beneficiaries, and to use these estimates to form individual-level predictions of the probability of Medicaid enrollment. These predicted values are then substituted into the service use equations yielding estimates of the effect of dual enrollment on acute and long-term care use among community-living elderly Medicare beneficiaries that are free of (residence setting and program participation) selection biases.
Data and Methods
Data Sources
Data for this analysis are drawn from the 1996 Medicare Current Beneficiary Survey (MCBS) Access to Care and Cost and Use files. The MCBS is a longitudinal, multipurpose survey of a nationally representative sample of Medicare beneficiaries sponsored by the Health Care Financing Administration (HCFA).
Our analytical sample consists of elderly Medicare beneficiaries included in the Access to Care file, that is, the set of beneficiaries aged 65 or older who were enrolled in one or both parts of the Medicare program in January 1, 1996, and who were alive and enrolled at the time of the 1996 MCBS fall round interview (September–December). The final unweighted sample contained 8,848 “continuously enrolled” elderly Medicare beneficiaries, 8,160 residing in the community and 688 residing in institutions.
Data from the Access to Care file provided detailed information on the health and sociodemographic characteristics of beneficiaries. Data on service use were taken from the Cost and Use file. Information in these files is available on a broad array of health care services, including physician and hospital services, prescription drugs, and various long-term care services.
Dependent Variables
The dependent variables examined in this study were: (i) residential setting, in particular community residence, among all Medicare beneficiaries; (ii) Medicaid enrollment among low-income, Medicaid eligible beneficiaries; and (iii) health service use. Community residence was a binary variable taking the value of one if the respondent lived in a community-setting household; 0 otherwise. Beneficiaries were coded as “dually enrolled” if participation in the Medicaid program, at any point during the year, was indicated by HCFA administrative records. Measures of annual health service utilization included both the probability of use and the number of visits/events conditional on any use. The services examined were: inpatient stays, outpatient department visits, physicians’ office visits, prescription medicines, and formal (or paid) home health visits.2
State Policy Variables
One objective of our analysis was to determine whether state strategies for allocating long-term care (LTC) resources influence the probability that elderly persons remain living in the community or the likelihood that eligible low-income elderly persons will enroll in the Medicaid program.3 Our conjecture was that beneficiaries living in states that devote higher shares of their LTC resources to home- and community-based care (HCBS) or that offer more generous Medicaid HCBS benefits would be more likely to both live in the community and to enroll in the Medicaid program, if eligible. To test these hypotheses, state-specific information was obtained from published sources on the percent of the state's Medicaid long-term care expenditures allocated to HCBS and Medicaid per capita (i.e., per elderly enrollee) expenditures on HCBS waivers (Harrington et al. 2000; Public Policy Institute 1996). On each indicator, states were assigned a value of high, medium, or low depending on their ranking in the top twenty-fifth percentile (high), twenty-sixth to seventy-fourth percentile (medium), or bottom twenty-fifth percentile (low). Individuals were then assigned values based on their state of residence on each of the two variables created: “HCBS priority” and Medicaid “HCBS generosity.”
Other Control Variables
Demographic and economic characteristics of the beneficiary included age, gender, race, Hispanic ethnicity, marital status, education, household income (including a quadratic term to allow for possible nonlinear effects), number of living children, and living arrangement. Health status and disability were captured by a count of chronic conditions (ranging from 0 to 15); an indicator of walking difficulty (yes/no); an indicator of urinary incontinence (yes/no); and a set of four hierarchical variables capturing severity of disability, as measured by no difficulties, difficulty with instrumental activities of daily living (IADL) only, difficulty with 1–2 basic activities of daily living (ADLs), or difficulty with 3–5 ADLs. The five ADLs included were: bathing or showering, dressing, using the toilet, getting in or out of a bed or chair, and eating. The IADLs were meal preparation, grocery shopping, light housework, financial management, and telephoning. Finally, we capture geographic variation by including indicators of residence in the nine Census divisions.
Estimation Procedure
Two features of our empirical analysis merit comment. The first concerns our determination of “Medicaid eligibility.” In practice, determination of Medicaid eligibility is a highly complex, state-specific process that entails assessments of income, assets, and, in some instances, medical expenditures (Kassner and Shirley 2000). We used a simple yet conservative approach to designate those Medicare beneficiaries eligible for some Medicaid benefits. Using individual (or household, if married) annual income, beneficiaries with incomes at or below 100 percent of the poverty level were considered eligible for assistance through state Medicaid programs.4
The second concerns our estimation strategy. Two econometric issues precluded estimating our models using standard techniques. The first was the potentially biasing effects of focusing on Medicaid enrollment and service use solely among community-dwelling Medicare beneficiaries. Persons who remain living in the community despite frailty and disability are likely to be systematically different from those who become institutionalized. The inclusion of controls for health status, functional limitations, and availability of informal support networks (number of living children) minimizes the problem but may not eliminate it if institutionalized and noninstitutionalized beneficiaries differ in ways that are unmeasured or unobservable. The second, and more fundamental, issue concerns the endogeneity of the Medicaid enrollment variable. To the extent that unmeasured factors affect both service use and enrollment among eligible beneficiaries, then the indicator for Medicaid participation—the key variable of interest in the service use equations—does not reflect the effects of coverage alone and cannot legitimately be taken as an exogenous variable.
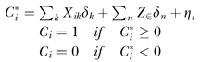
In order to account for both of these problems, we used an estimation procedure based on instrumental variable techniques. Specifically, we estimated reduced-form representations of the probability of Medicaid participation among eligible community beneficiaries jointly with the probability of community living among all beneficiaries. The parameter estimates obtained from this procedure were then used to obtain (selection- and eligibility-corrected) predictions of the probability of Medicaid dual enrollment for all eligible beneficiaries. This predicted enrollment variable was then used as a regressor in the probability and intensity of service use equations. Formally, we estimated:
 |
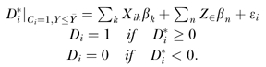 |
where
is the latent variable representing the probability that beneficiary i lived in the community and
is the latent variable representing the probability that an eligible beneficiary was enrolled in the Medicaid program. Xi and Zi are vectors of explanatory variables representing the set of factors assumed to affect the likelihood of community living among all beneficiaries and Medicaid enrollment among eligible low-income beneficiaries. The vector X contained measures of beneficiaries’ regional, demographic, and economic characteristics as well as health status measures, while the variables in Z captured the effect of state Medicaid HCBS allocation policies. The vectors of parameters δ and β were estimated via a bivariate probit with selection model in which the disturbance terms [η, ɛ] were assumed to follow a joint normal distribution.
Predictions of the probability of dual enrollment for all eligible beneficiaries in our sample were based on the model described above (noneligible beneficiaries were assigned the value zero in the probability of dual enrollment). The predicted dual enrollment indicator, D, was then used as a regressor in the equations describing probability and intensity of service use, that were defined as follows:
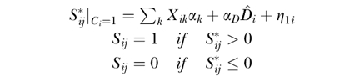 |
where
is the latent variable capturing the beneficiary's propensity to use service j and lnUSEij is the logarithm of the number of visits or events of service j experienced by individual i during the study period.5
Estimates of the probability of use of a given service j (conditional on community living) were obtained using a bivariate probit specification similar to that described above. In the absence of plausible exclusion restrictions that identify the probability of service use from the conditional intensity of use, estimates of the parameter estimates in the ln USE equations were obtained using the two-part model described in Duan et al. (1983). All analyses used weighted data.
Empirical Results
There were about 2.59 million (8.8 percent) community-dwelling Medicare beneficiaries who were enrolled in Medicaid at some point during 1996 according to HCFA's administrative records. Another 2.60 million (8.9 percent) beneficiaries had adjusted incomes at or below 100 percent of the 1996 Federal Poverty Level but were not enrolled in the program. Taken together, these figures suggest a Medicaid enrollment of 49.8 percent among elderly Medicare beneficiaries with incomes at or below poverty in 1996.
Table 1 presents the estimates for the joint model of community living (among all beneficiaries) and Medicaid enrollment (among eligible community beneficiaries). We find no evidence that states’ decisions regarding allocation of resources to HCBS influences the probability that beneficiaries live in the community relative to institutional settings. The results, however, suggest that states’ generosity with HCBS benefits does influence the likelihood that community-dwelling, low-income, eligible beneficiaries enroll in the Medicaid program. Relative to eligible persons living in high generosity states (the reference category), those living in states characterized by low or medium levels of Medicaid HCBS generosity were less likely to be enrolled. The effect of these policy variables persisted when all other individual characteristics, including health status and sociodemographic indicators, were included in the model. By contrast, the effect of the state's share of Medicaid LTC expenditures devoted to HCBS was not statistically significant.
Table 1.
Maximum Likelihood Estimates of the Probability of Community-Living among all Beneficiaries and Medicaid Enrollment among Eligible Low Income Persons
| Variable | Pr (Community Living) among All Beneficiaries | Pr (Medicaid Enrollment) among “Eligible” Community Beneficiariesa |
|---|---|---|
| Long-term care Medicaid policy in state of residence | ||
| HCBS generosity: low | 0.076 (0.158) | −0.409** (0.167) |
| HCBS generosity: medium | 0.176 (0.132) | −0.326* (0.186) |
| HCBS priority: low | 0.042 (0.186) | −0.184 (0.195) |
| HCBS priority: medium | 0.096 (0.139) | 0.118 (0.142) |
| Demographic characteristics | ||
| Age | −0.021** (0.005) | −0.243** (0.006) |
| Male | −0.002 (0.093) | 0.036 (0.160) |
| Hispanic | 0.476** (0.229) | 0.891** (0.382) |
| Black | 0.284* (0.148) | 0.292 (0.316) |
| Divorced/separated | −0.615** (0.173) | 0.824** (0.409) |
| Widowed | −0.468** (0.105) | 0.542** (0.256) |
| Never married | −0.683** (0.149) | 1.201** (0.400) |
| Number of living children | 0.254** (0.023) | 0.057** (0.023) |
| High school graduate | 0.362** (0.098) | −0.672** (0.259) |
| Some college | 0.526** (0.108) | −0.456** (0.430) |
| Functional status and disability | ||
| Difficulty with IADLs only | −0.470** (0.154) | 0.221 (0.158) |
| Difficulty with 1–2 ADLs | −1.521** (0.124) | 0.517** (0.159) |
| Difficulty with 3–5 ADLs | −2.449** (0.141) | 0.353* (0.209) |
| Difficulty with mobility | −0.038 (0.100) | 0.045 (0.175) |
| Incontinent | −0.388** (0.088) | −0.084 (0.106) |
| Number of chronic conditions | −0.054** (0.019) | 0.055** (0.022) |
| Living arrangement | ||
| With child(ren) | — | 0.210* (0.114) |
| With other relatives or nonrelatives | — | −0.013 (0.104) |
| Economic status | ||
| Income ([div] 10,000) | — | 3.667** (0.742) |
| Income squared ([div]) 100,000) | — | −2.756** (0.718) |
| Region of residence | ||
| New England | −0.121 (0.226) | −0.037 (0.287) |
| North Atlantic | 0.144 (0.181) | −0.096 (0.212) |
| South Atlantic | 0.085 (0.150) | −0.322* (0.181) |
| East North Central | −0.070 (0.170) | 0.069 (0.270) |
| West North Central | −0.505** (0.182) | −0.386 (0.246) |
| East South Central | 0.245 (0.230) | 0.069 (0.271) |
| West South Central | 0.055 (0.169) | −0.413** (0.192) |
| Mountain | 0.127 (0.242) | −0.423 (0.267) |
| Correlation coefficient | 0.045 (0.647) | |
| Chi-squared | 1988.4** | |
| Unweighted sample size | 8,848 | |
Notes: Numbers in parentheses are standard errors. Significance at the p <0.05 and 0.05≤p <0.10 are indicated by a ** and *, respectively. All models include a constant term.
The Medicaid “eligible” group consists of continuously enrolled Medicare beneficiaries with incomes up to 100% of the federal poverty level in 1996 (that is, unmarried persons with reported annual income below $7,740 and married persons with reported annual income below $10,360 in 1996). Medicaid enrollment was determined based on HCFA's administrative records.
In view of these results and to provide a better sense of the magnitude of the effects on the probability of Medicaid enrollment, we calculated the predicted probability of enrollment that would result from varying levels of Medicaid HCBS generosity and LTC expenditures devoted to HCBS. Predicted probabilities were calculated (using the bivariate probit parameter estimates) by first assuming that all eligible beneficiaries lived in a state with a given policy characteristic (e.g., low Medicaid HCBS generosity) and then assuming that all eligible beneficiaries lived in states with the reference category (e.g., high generosity), while holding other factors constant. These predictions were calculated for each individual and then averaged over all eligible beneficiaries.
The results of these calculations, shown in Table 2, reveal that the effect of state's Medicaid HCBS generosity on Medicaid enrollment by eligible beneficiaries is substantial. About 53 percent of eligible persons would enroll in the program had they lived in a high generosity state—a 5.8 percentage point increase in the proportion of eligible persons who would have enrolled had they lived in a low generosity state. Persons living in states characterized by medium generosity were 3 percentage points less likely to enroll than those living in the most generous states. The difference in the probability of Medicaid participation among persons living in states with the lowest and highest percent of LTC expenditures allocated to HCBS was even larger—7.5 percentage points—although statistically nonsignificant. Although these effects fall far short of achieving full enrollment of eligible beneficiaries, they represent a 12 percent increase over the levels observed in low generosity states and an 18 percent increase over levels observed in low HCBS priority states.
Table 2.
Predicted Probabilities of Dual Enrollment among Eligible Beneficiaries by Key State Policy Variables
| Assuming All Eligible Community Beneficiaries Live in a State with: | ||||
|---|---|---|---|---|
| Assuming All Eligible Community Beneficiaries Live in a State with: | ||||
| State LTC Medicaid Policy Characteristic | Low | Median | High | Difference |
| HCBS generosity | 0.469 | — | 0.527 | −0.058** |
| HCBS generosity | — | 0.497 | 0.527 | −0.030* |
| HCBS priority | 0.407 | — | 0.482 | −0.075 |
| HCBS priority | — | 0.514 | 0.482 | 0.032 |
Note: Predicted probabilities are based on parameter estimates shown in Table 1. Calculations are performed for all community resident Medicaid eligible beneficiaries, that is, those beneficiaries whose adjusted household income was at or below 100% of the 1996 Federal Poverty Level. Each row presents predicted probabilities associated with assuming all Medicaid eligible beneficiaries live in a state with the respective policy dimension (e.g., low Medicaid HCBS generosity), holding other factors constant. Reference category for both policy dimension is “high.”
Significance at the p <0.05 and 0.05 ≤p <0.10 are indicated by a ** and *, respectively.
The results shown in Table 1 indicate that other factors also have important effects on the probability of community living and of dual enrollment (among poor elderly persons). Consistent with findings from prior studies, older persons, those who were unmarried, and those with ADL and IADL limitations or higher numbers of chronic conditions were less likely to live in the community. Relative to persons of other races/ethnicity, blacks and Hispanics were less likely to be institutionalized and more likely to live in the community.
The determinants of Medicaid enrollment among community-dwelling eligible beneficiaries were also consistent with expectations. Persons with the greatest health care needs, who potentially would benefit the most from Medicaid coverage, were more likely to participate: The presence of IADL or ADL disability, as well the number of chronic conditions, significantly increased the likelihood of Medicaid enrollment. Demographic characteristics also had a marked effect on the probability of dual enrollment: Hispanic and black beneficiaries were significantly more likely to participate in Medicaid than were white beneficiaries, as were unmarried persons—those widowed, divorced/separated, or never married. Those with higher education, on the other hand, were less likely to participate. Finally, the significant negative effect of the quadratic income term combined with the positive effect on the income level variable suggests those with higher incomes (that is, those with incomes closer to the 100 percent FPL “eligibility” threshold) were less likely to enroll.
Dual Enrollment and Service Use
Table 3 displays the coefficient estimates for all covariates in the service use models while Table 4 presents unadjusted and adjusted differences in service use between dually enrolled and other Medicare beneficiaries. Unadjusted figures in Table 4 correspond to differences in weighted means between the two groups; adjusted differences represent the estimated marginal effect for the (predicted) dual enrollment variables, using coefficients shown in Table 3 and holding all other factors constant at their original levels.6
Table 3.
Effect of Dual Enrollment and Other Factors on Beneficiaries’ Use of Services
| Inpatient Care | Outpatient Care | Physician's Office | Prescription Medicine | Home Health | ||||||
|---|---|---|---|---|---|---|---|---|---|---|
| Variable | Any Use | Conditional Amount | Any Use | Conditional Amount | Any Use | Conditional Amount | Any Use | Conditional Amount | Any Use | Conditional Amount |
| Medicaid Enrollment Status | ||||||||||
| Dually Enrolled | −0.180 (0.110) | −0.078 (0.053) | 0.169* (0.097) | 0.176** (0.060) | 0.276** (0.100) | 0.097* (0.054) | 0.038 (0.130) | 0.121** (0.048) | 0.085 (0.117) | 0.056 (0.091) |
| Demographic characteristics | ||||||||||
| Age | 0.081** (0.027) | −0.035** (0.012) | −0.001 (0.025) | −0.054** (0.015) | 0.211** (0.026) | 0.005 (0.014) | 0.007 (0.003) | −0.007** (0.002) | 0.030** (0.003) | 0.008** (0.005) |
| Male | 0.121** (0.038) | 0.044** (0.018) | −0.142** (0.032) | 0.003 (0.021) | −0.267** (0.034) | −0.060** (0.018) | −0.282** (0.042) | −0.167** (0.023) | 0.031 (0.046) | −0.124 (0.086) |
| Hispanic | −0.011 (0.091) | 0.017 (0.043) | 0.036 (0.075) | −0.061 (0.050) | −0.124* (0.077) | 0.023 (0.038) | 0.133 (0.096) | −0.048 (0.053) | −0.046 (0.115) | 0.020 (0.195) |
| Black | −0.014 (0.070) | 0.085** (0.032) | 0.022 (0.058) | 0.061 (0.038) | −0.440** (0.059) | −0.018 (0.021) | −0.042 (0.074) | 0.084** (0.041) | 0.051 (0.077) | 0.391** (0.134) |
| Divorced/separated | −0.061 (0.075) | −0.037 (0.037) | −0.203 (0.061) | 0.036 (0.040) | −0.318** (0.062) | 0.023 (0.038) | −0.206** (0.078) | 0.040 (0.045) | 0.224** (0.086) | 0.329** (0.163) |
| Widowed | 0.120* (0.045) | 0.046** (0.021) | 0.007 (0.038) | 0.063** (0.024) | −0.050 (0.041) | −0.018 (0.022) | −0.046 (0.054) | 0.065** (0.027) | 0.284** (0.052) | 0.187** (0.095) |
| Never married | −0.206* (0.105) | 0.068 (0.053) | 0.017 (0.080) | −0.009 (0.053) | 0.056 (0.086) | −0.075* (0.046) | 0.050 (0.104) | −0.016 (0.057) | 0.404** (0.104) | 0.292* (0.176) |
| Number of children | 0.002 (0.008) | 0.001 (0.004) | 0.009 (0.007) | 0.008* (0.004) | 0.002 (0.008) | −0.007* (0.004) | 0.026** (0.010) | 0.001 (0.005) | −0.003 (0.010) | −0.028* (0.016) |
| High school | −0.027 (0.043) | −0.094 (0.019) | 0.013 (0.036) | −0.035 (0.023) | −0.032 (0.039) | −0.004 (0.020) | 0.037 (0.048) | −0.065** (0.026) | −0.092* (0.050) | 0.007 (0.091) |
| Some college | −0.050 (0.048) | −0.033 (0.022) | 0.078** (0.039) | −0.093** (0.023) | 0.249 (0.043) | 0.014 (0.022) | 0.029 (0.054) | −0.077** (0.028) | −0.024 (0.056) | −0.182* (0.098) |
| Functional status and disability | ||||||||||
| IADLs only | 0.300** (0.056) | 0.046* (0.024) | 0.035 (0.053) | 0.123** (0.034) | 0.008 (0.058) | 0.017 (0.298) | 0.162* (0.086) | 0.164** (0.036) | 0.693** (0.058) | 0.686** (0.102) |
| 1–2 ADLs | 0.615** (0.079) | 0.099** (0.028) | 0.302** (0.083) | 0.161** (0.043) | 0.331** (0.087) | 0.002 (0.385) | 0.430** (0.134) | 0.316** (0.050) | 1.306** (0.082) | 1.190** (0.105) |
| 3–5 ADLs | 0.838** (0.144) | 0.105** (0.040) | 0.455** (0.141) | 0.225** (0.064) | 0.089 (0.156) | −0.194** (0.058) | 0.440* (0.235) | 0.059 (0.072) | 1.692** (0.157) | 1.758** (0.145) |
| Mobility | 0.121 (0.083) | 0.037 (0.024) | 0.083 (0.088) | 0.106** (0.052) | 0.020 (0.096) | 0.042 (0.465) | −0.049 (0.161) | 0.066 (0.057) | 0.033 (0.080) | 0.211* (0.117) |
| Incontinent | 0.068 (0.045) | −0.026 (0.020) | 0.129** (0.042) | 0.015 (0.025) | 0.044 (0.046) | 0.024 (0.225) | 0.288** (0.065) | 0.130** (0.028) | 0.196** (0.051) | −0.057 (0.082) |
| Chronic conditions | 0.133** (0.009) | 0.029** (0.004) | 0.143** (0.009) | 0.060** (0.005) | 0.138** (0.010) | 0.093** (0.005) | 0.292** (0.012) | 0.183** (0.006) | 0.115** (0.011) | 0.009 (0.017) |
| Living arrangement | ||||||||||
| With child(ren) | −0.005 (0.064) | 0.042 (0.028) | −0.231** (0.056) | −0.083* (0.038) | −0.100* (0.060) | −0.083** (0.032) | −0.135* (0.078) | −0.058 (0.040) | – | – |
| With others | 0.097 (0.050) | 0.010 (0.023) | −0.053 (0.044) | −0.020 (0.029) | −0.175** (0.045) | −0.021 (0.026) | −0.107* (0.057) | −0.004 (0.031) | – | – |
| Economic status | ||||||||||
| Income (÷ 10,000) | −0.007 (0.009) | −0.003 (0.006) | −0.001 (0.006) | −0.006 (0.004) | 0.013 (0.008) | −0.565* (0.348) | 0.554 (1.592) | −0.045 (0.426) | −0.049** (0.010) | −0.310 (0.212) |
| Income squared | −0.001 (0.001) | 0.001 (0.001) | −0.007 (0.005) | 0.005* (0.003) | −0.003 (0.099) | 0.047* (0.025) | 0.094 (0.644) | 0.002 (0.003) | 0.027** (0.005) | 0.015 (0.012) |
| Region | ||||||||||
| New England | 0.189* (0.106) | 0.091** (0.046) | 0.474** (0.095) | 0.487** (0.057) | 0.441** (0.091) | −0.137** (0.055) | 0.009 (0.114) | 0.144** (0.064) | 0.633** (0.111) | 0.304* (0.182) |
| North Atlantic | 0.127** (0.062) | 0.023 (0.029) | 0.221** (0.052) | 0.134** (0.035) | 0.726** (0.054) | 0.027 (0.033) | 0.002 (0.069) | 0.183** (0.037) | 0.099 (0.075) | 0.100 (0.135) |
| South Atlantic | 0.010 (0.061) | 0.014 (0.029) | 0.208** (0.051) | 0.059* (0.034) | 0.811** (0.054) | −0.050 (0.033) | 0.101 (0.070) | 0.230** (0.037) | 0.010 (0.073) | 0.376** (0.133) |
| East North Central | 0.007 (0.063) | 0.015 (0.030) | 0.278** (0.053) | 0.140** (0.035) | 0.823** (0.055) | −0.137** (0.033) | 0.027 (0.069) | 0.187** (0.037) | −0.019 (0.076) | 0.237* (0.140) |
| West North Central | 0.160** (0.080) | 0.007 (0.037) | 0.409** (0.069) | 0.273** (0.044) | 0.694** (0.071) | −0.125** (0.041) | 0.111 (0.092) | 0.244** (0.048) | 0.112 (0.093) | 0.219 (0.180) |
| East South Central | 0.132 (0.086) | 0.027 (0.040) | 0.130* (0.075) | 0.063 (0.050) | 0.949** (0.088) | −0.185** (0.044) | 0.144 (0.107) | 0.404** (0.053) | 0.021 (0.104) | 0.681** (0.192) |
| West South Central | −0.074 (0.071) | −0.013 (0.033) | 0.029 (0.059) | −0.011 (0.040) | 0.659** (0.061) | −0.239** (0.037) | −0.022 (0.078) | 0.103** (0.042) | 0.001 (0.085) | 0.710** (0.152) |
| Mountain | 0.003 (0.086) | 0.048 (0.040) | 0.184** (0.070) | 0.069 (0.047) | 0.285** (0.069) | −0.177** (0.045) | 0.051 (0.093) | 0.158** (0.050) | −0.151 (0.104) | 0.181 (0.194) |
| Correlation | −0.266 (0.172) | −0.338* (0.199) | −0.389* (0.227) | −0.512 (0.493) | −0.139 (0.218) | |||||
| Chi-square | 1109** | 392** | 393** | 759** | 2154** | |||||
| R-square | 0.20 | 0.17 | 0.19 | 0.18 | 0.24 | |||||
| Sample size | 8,848 | 1,511 | 8,848 | 5,418 | 8,848 | 6,072 | 8,848 | 7,225 | 8,848 | 1,359 |
Notes: Numbers in parentheses are standard errors. Predicted value for the community-dwelling “dually enrolled” variable is based on the bivariate probit coefficient estimates shown in Table 1. The probability of service use is estimated jointly with the community-living equation via a bivariate probit model; the correlation coefficients measure the correlation between the error terms across equations. Significance at the p <0.05 and 0.05 ≤p <0.10 are indicated by a ** and *, respectively. All models include a constant term. Variables capturing living arrangements are omitted from the formal care equations because of potential endogeneity.
Table 4.
Service Use among Community-Dwelling Medicare Beneficiaries by Medicaid Enrollment Status
| Dually Enrolled | Other Medicare Beneficiaries | Unadjusted Difference | Regression-Adjusted Difference | |
|---|---|---|---|---|
| Number of Beneficiaries (000s) | 2,589 | 26,725 | ||
| Service use | ||||
| Inpatient care | ||||
| Any use | 21.8% | 16.6% | 5.2** | −4.1 |
| Number of staysb | 1.9 | 1.6 | 0.3 | 0.2 |
| Outpatient department care | ||||
| Any use | 70.9% | 65.3% | 5.6** | 5.6* |
| Number of visitsb | 6.0 | 4.6 | 1.4* | 1.1** |
| Physician office visits | ||||
| Any use | 82.4% | 71.9% | 10.5** | 7.1** |
| Number of visitsb | 7.7 | 6.6 | 1.1* | 1.2* |
| Prescription medicine | ||||
| Any use | 90.9% | 87.2% | 3.7** | 0.6 |
| Number of prescriptionsb | 31.2 | 20.9 | 10.3** | 10.6** |
| Home health care | ||||
| Any use | 28.7% | 12.2% | 16.5** | 1.6 |
| Number of visitsb | 125.2 | 76.6 | 48.6** | 21.4 |
Notes: The dually enrolled group consists of continuously enrolled Medicare beneficiaries who are also enrolled in Medicaid according to HCFA's administrative records. Unadjusted differences represent differences in means between dually enrolled and other Medicare beneficiaries. Regression-adjusted differences correspond to marginal effects for the (predicted) “dually enrolled” parameter estimates, using coefficients shown in Table 3 and holding all other factors constant at their original levels. Statistically significant differences between dually enrolled and other Medicare beneficiaries at the p <0.05 and 0.05 ≤p <0.10 are indicated by a ** and *, respectively.
Average yearly number of visits among beneficiaries who had at least one visit during the year.
Overall, there is limited evidence that Medicaid enrollment increases the use of health care services, once self-selection and other factors are controlled for. Eight of the ten “dually enrolled” coefficients were positive, as expected, but only five were statistically significant (Table 3): Medicaid enrollment was significantly associated with greater use of ambulatory care services, both at outpatient departments and physicians’ offices. Conditional on use, dually enrolled persons also used more prescription drugs than other Medicare beneficiaries.
Results shown in Table 4 suggest that in addition to statistical significance, there are striking contrasts in the direction and magnitude of the dual enrollment effect between adjusted and unadjusted estimates. Controlling for other characteristics, dually enrolled persons were estimated to be 4.1 percentage points less likely than other beneficiaries to have a hospital stay (not significant). The probability of making at least one visit to a physician's office and of using prescription medicine also was greatly reduced when health status and self-selectivity into the Medicaid program was accounted for. The effect of correcting for self-selection in enrollment was, however, most notable in the home health care equations: Predicted probabilities indicate that the likelihood of having at least one home health care visit was only 1.6 percent (nonsignificant) higher among dual enrollees when compared to other beneficiaries, with the difference in adjusted number of annual home health visits among users being less than half that given by unadjusted means (21 versus 48, respectively).
The effects of other control variables shown in Table 3 were generally consistent with expectations. For the most part, the demand for acute care services was driven by measures capturing variations in health and disability status of elderly beneficiaries. The number of chronic conditions was, by far, the most consistently significant predictor of both the probability and intensity of medical service use. With the exception of visits to physician's offices, which were significantly fewer among severely disabled persons, and a nonsignificant effect on the probability of a doctor's visit, difficulties with one or more basic activities of daily living increased both the probability and the intensity of acute care service use. The effects of having a mobility difficulty or being incontinent were less consistent across acute care service types.
Males were less likely to use ambulatory services but were more likely to experience a hospital stay. Conditional on use, men also had a higher frequency of hospital stays than women. Widowed persons also experienced higher rates of inpatient hospitalization, outpatient care use, and prescription medicines than their married counterparts. Although there were no systematic differences in probability of service use by ethnicity, among those using services, blacks had more hospitalizations, used more prescription medicines, and had more visits to outpatient departments than nonblack beneficiaries. Blacks, however, were significantly less likely than whites to have physician office visits. Finally, once coverage was taken into account, income was not a significant factor influencing the intensity of acute care or prescription drug use.
The results concerning the effects of health status and sociodemographic characteristics on the use of formal care are also in accordance with findings from other studies (McGarry and Schoeni 1995). Difficulties with IADL and ADL activities, mobility impairments, and worsened health status, as measured by the number of chronic conditions, all increased the likelihood and intensity of home health care use. Younger beneficiaries, those with fewer living children, and unmarried elderly persons also were generally more likely to rely on formal care.
Conclusion
Public supplemental insurance to fill in the coverage and benefit gaps of Medicare is likely to become even more important in the future in view of recent discussions about further cuts in the Medicare program. Understanding the dynamics of Medicaid participation and service use among elderly persons, therefore, remains an important social and policy concern and represents a crucial component in the evaluation of whether the program adequately meets its goal of providing coverage to at-risk elderly persons.
In this study, we used a nationally representative sample of elderly Medicare beneficiaries to estimate the determinants of dual enrollment among community-dwelling, low-income beneficiaries and the effect of dual enrollment on the demand and intensity of use of health care services. We found strong evidence of self-selection in eligible beneficiaries’ decisions to enroll in the Medicaid program. In fact, less than half of all Medicare beneficiaries with annual incomes at or below 100 percent of the FPL were enrolled in Medicaid during the study year. Medicaid participation was driven primarily by poor health and disability although demographic characteristics, including race/ethnicity and educational attainment, also had an effect on enrollment.
Once the differential likelihood of Medicaid enrollment by eligible persons with certain (observed and unobserved) characteristics was accounted for, we found modest evidence of a dual enrollment effect on service use. Although dually enrolled persons were more likely to make at least one visit to an outpatient department or physician's office and also used more of these services than other beneficiaries, the large differences in all types of service use observed in unadjusted differences were less evident, once selection in enrollment was considered. These results are consistent with recent empirical evidence suggesting that differences in Medicare costs between elderly Medicare beneficiaries who are dually enrolled and other beneficiaries are largely accounted for by differences in beneficiaries’ health status (Liu et al. 1998). Our finding of a generally reduced, and often statistically insignificant, effect of dual enrollment on service use is also consistent with results reported by Wolfe and Godderis (1991). In a longitudinal study of supplemental private insurance purchases among retired persons, these authors noted that elderly persons with large medical expenditures were more likely to purchase supplemental insurance in subsequent years. The estimated effect in medical expenditures was greatly reduced once these selection effects were controlled for. One implication of our finding is that, given existing patterns of self-selection, efforts to further expand Medicaid eligibility for poor elderly persons through raised income limits is likely to improve access to those who need public benefits without systematically increasing service use that is solely related to lower out-of-pocket expenditures afforded by Medicaid coverage.
Perhaps the most striking finding of this study, however, was the sizeable and statistically significant effect of state policy variables in influencing Medicaid enrollment among low-income, community-dwelling elderly persons. Concerns about low participation by eligible persons, which have focused primarily on the experience of the newer QMB and SLMB programs, have drawn attention to states’ outreach and application procedures (Nemore 1999; Families USA 1993). Our analysis suggests that how states allocate HCBS resources—an important component of Medicaid policy over which states have considerable discretion—also affects individual enrollment decisions.
Our results provide compelling evidence that program participation can be influenced by state policy. The study, however, is not without its limitations. National datasets, such as the MCBS, do not provide information that would permit a more precise characterization of individuals’ Medicaid eligibility, particularly in view of substantial variation in states’ eligibility criteria and standards. Although imprecise, our proxy based on household income at or below 100 percent of the FPL does provide a “common denominator” that identifies, with a high degree of certainty, those persons who would be eligible for benefits in most states. Increasingly, states are including “medically needy” provisions into their eligibility criteria or using higher income limits for eligibility to certain benefits (e.g., 300 percent of the federal SSI benefit for home and community-based benefits) (Bruen et al. 1999; National Association of Medicaid Directors 1999; Lutzky et al. 2000; LeBlanc et al. 2000; Kassner and Shirley 2000). Results from our sensitivity analyses using alternative income thresholds as proxies for Medicaid eligibility (120 percent, 200 percent, and 300 percent of FPL) indicate that the effects of state HCBS policies on Medicaid enrollment are more marked—both generosity and HCBS priority reach statistical significance and their impact is larger in magnitude—when eligibility is expanded to higher income beneficiaries.7
In this study, we focus on one specific aspect of state policy: state's strategies for allocating Medicaid HCBS resources. State behavior with regard to HCBS benefits may be indicative of an overall approach to caring for at-risk elders; alternatively, benefit decisions and other aspects of Medicaid policy, such as application procedures, may exert independent effects on enrollment of eligible persons. A better understanding of how “policy matters” is essential to formulating programs that meet the goal of providing access to services for vulnerable beneficiaries.The results presented here afford new insights into why existing state Medicaid programs succeed or fail in reaching potentially eligible elderly beneficiaries.
Notes
In addition to income tests, the program imposes ceilings on assets and countable resources owned by the beneficiary.
We also examined use of two additional long-term care services, skilled nursing facilities and hospice. Because of the small proportion of beneficiaries using either of these services, they were excluded.
Ideally, we would also like to include other measures of states’ practices that might attract low-income beneficiaries into their programs, such as whether the state offers personal care services under Medicaid or HCBS targeted to the elderly. Although such data are slowly becoming available, information is somewhat spotty and restricted to more recent years (Le Blanc et al. 2000; Lutzky et al. 2000; Bruen et al. 1999; Nemore 1999).
Data limitations precluded further classification of Medicaid eligible beneficiaries based on asset tests. Because survey-obtained asset information is notorious for its poor quality and because studies suggest that income is highly correlated withthe types of assets that are “countable” according to Medicaid eligibility rules (Kotlikoff and Morris 1990), we do not believe this omission is of major concern.
Note that the set of state policy variables Zi do not enter the conditional expectation of Si or lnUSEi. Because these variables measure state's HCBS allocation strategies, they are assumed to have a direct influence on the probability that a beneficiary stays in the community and enrolls in Medicaid conditional on eligibility but not toaffect service use conditional on dual enrollment, community living, and other factors.
Marginal effects for the anti-log scale of the number of prescribed medicines were obtained by applying the appropriate non-parametric “smearing” re-transformation described in Duan (1983).
Results available from the authors upon request.
References
- Barents Group. A Profile of QMB-Eligible and SLMB-Eligible Medicare Beneficiaries Prepared for the Health Care Financing Administration. Washington, DC: 1999. [Google Scholar]
- Bruen BK, Wiener JM, Kim J, Miazad O. “State Usage of Mediacid Coverage Options for Aged, Blind, and Disabled People”. Washington, DC: The Urban Institute; 1999. Working paper 99-09. [Google Scholar]
- Congressional Research Service. Medicaid Source Book: Background Data and Analysis. Washington, DC: U.S. Government Printing Office; 1988. [Google Scholar]
- Duan N. “Smearing Estimate: A Nonparametric Retransformation Method”. Journal of the American Statistical Association. 1983;78:605–10. [Google Scholar]
- Ettner S. “Inpatient Psychiatric Care of Medicare Beneficiaries with State Buy-in Coverage”. Health Care Financing Review. 1998;20(2):55–69. [PMC free article] [PubMed] [Google Scholar]
- Ettner S. “Medicaid Participation Among the Eligible Elderly”. Journal of Policy Analysis and Management. 1997;16(2):237–55. doi: 10.1002/(SICI)1520-6688(199721)16:2<237::AID-PAM3>3.0.CO;2-J. [DOI] [PubMed] [Google Scholar]
- Families USA. The Medicare Buy-In: A Promise Unfulfilled. Washington, DC: Families USA; 1993. [Google Scholar]
- Families USA. Shortchanged: Billions Withheld from Medicare Benefits. Washington, DC: Families USA; 1998. [Google Scholar]
- Feder J. “Medicare/Medicaid Dual Eligibles: Fiscal and Social Responsibility for Vulnerable Populations”. Washington, DC: Kaiser Commission on the Future of Medicaid; 1997. [Google Scholar]
- Harrington C, Carrillo H, Welling V, LeBlanc AJ, Tonner MC. 1915(c) Medicaid Home and Community-Based Waiver Participants, Services, and Expenditures, 1992–1997. San Francisco: University of California; [Google Scholar]
- Health Care Financing Administration. “A Profile of Dually Eligible Beneficiaries”. Baltimore, MD: Prepared for the National Association of State Medicaid Directors; 1997. [Google Scholar]
- Hurd M, McGarry K. “Medical Insurance and Use of Health Care Services by the Elderly”. Journal of Health Economics. 1997;16:129–54. doi: 10.1016/s0167-6296(96)00515-2. [DOI] [PubMed] [Google Scholar]
- Kassner E, Shirley L. “Medicaid Financial Eligibility for Older People: State Variations in Access to Home and Community-Based Waiver and Nursing Home Services”. Washington, DC: AARP Public Policy Institute; 2000. [Google Scholar]
- Kenney G, Coughlin T, Rimes C. “The Use of Medicare and Medicaid Home Health Services Among Dual Eligibles”. Paper presented at the 1995 annual meeting of the Association for Health Services Research; Washington, DC. 1995. [Google Scholar]
- Kotlikoff L, Morris J. “How Much Care Do the Aged Receive from Their Children? A Bimodal Picture of Contact and Assistance”. In: Wise David., editor. Economics of Aging. Chicago: University of Chicago Press; 1989. pp. 151–75. [Google Scholar]
- Lamphere J, Rosenbach M. “Promises Unfulfilled: Implementation ofExpanded Coverage for the Elderly Poor”. Health Services Research. 2000;35(1):207–17. [PMC free article] [PubMed] [Google Scholar]
- Laschober M, Olin G. Health and Health Care of the Medicare Population: Data from the 1992 Medicare Current Beneficiary Survey. Rockville, MD: Westat, Inc; 1996. [Google Scholar]
- LeBlanc AJ, Tonner C, Harrington C. “Medicaid 1915(c) Home and Community-Based Services Waivers Across the States”. Health Care Financing Review. 2000;22(2):159–74. [PMC free article] [PubMed] [Google Scholar]
- Liu K, Long S, Aragon C. “Does Health Status Explain Higher Medicare Costs among Medicaid Enrollees?”. Health Care Financing Review. 1998;20(2):39–54. [PMC free article] [PubMed] [Google Scholar]
- Lutzky S, Alecxih LM, Duffy J, Neill C. “Review of the Medicaid 1915(c) Home and Community-Based Services Waiver Program Literature and Program Data”. Washington, DC: The Lewin Group; 2000. Final report to the Health Care Financing Administration. [Google Scholar]
- McGarry K, Schoeni R. “Transfer Behavior in the Family: Results from the Assets and Health Dynamics Study”. The Journal of Gerontology: Psychological and Social Sciences. 1997;52B(special issue):82–92. [PubMed] [Google Scholar]
- Merrell K, Colby DC, Hogan C. “Medicare Beneficiaries Covered by Medicaid Buy-In Agreements”. Health Affairs. 1997;16(1):175–84. doi: 10.1377/hlthaff.16.1.175. [DOI] [PubMed] [Google Scholar]
- Moffitt R. “An Economic Model of Welfare Stigma”. American Economic Review. 1983;73(5):1023–35. [Google Scholar]
- Moffitt R. “Historical Growth in Participation in Aid to Families with Dependent Children: Was There a Structural Shift?”. Journal of Post Keynesian Economics. 1987;9(3):347–63. [Google Scholar]
- National Association of State Medicaid Directors. [Jan. 2001];“Medicaid Home and Community-Based Waivers: A Look at the States in 1998”. 1999 Avaliable at: http://medicaid.aphsa.org/waivers/1915ctext.htm.
- Nemore P. Variations in State Medicaid Buy-In Practices for Low-Income Medicare Beneficiaries: An Update. Washington, DC: The Henry Kaiser Family Foundation; 1999. [Google Scholar]
- O'Brien E, Feder J. “Medicare and Medicaid for the Elderly and Disabled Poor”. Washington, DC: Kaiser Commission on the Future of Medicaid; 1999. [Google Scholar]
- Public Policy Institute. Falling through the Safety Net: Missed Opportunities for America's Elderly Poor. Washington, DC: American Association of Retired Persons; 1992. [Google Scholar]
- Public Policy Institute. Across the States: Profiles of Long-term Care Systems. Washington, DC: American Association of Retired Persons; 1996. [Google Scholar]
- Rowland D, Lyons B. “Medicare Medicaid and the Elderly Poor”. Health Care Financing Review. 1996;18(2):61–86. [PMC free article] [PubMed] [Google Scholar]
- Wolfe J, Goddeeris J. “Adverse Selection Moral Hazard and Wealth Effects in the Medigap Insurance Market”. Journal of Health Economics. 1991;10:433–59. doi: 10.1016/0167-6296(91)90024-h. [DOI] [PubMed] [Google Scholar]