

Abstract
Objective
To evaluate the amount of variation in diabetes practice patterns at the primary care provider (PCP), provider group, and facility level, and to examine the reliability of diabetes care profiles constructed using electronic databases.
Data Sources/Study Setting
Clinical and administrative data obtained from the electronic information systems at all facilities in a Department of Veterans Affairs' (VA) integrated service network for a study period of October 1997 through September 1998.
Study Design
This is a cohort study. The key variables of interest are different types of diabetes quality indicators, including measures of technical process, intermediate outcomes, and resource use.
Data Collection/Extraction Methods
A coordinated registry of patients with diabetes was constructed by integrating laboratory, pharmacy, utilization, and primary care provider data extracted from the local clinical information system used at all VA medical centers. The study sample consisted of 12,110 patients with diabetes, 258 PCPs, 42 provider groups, and 13 facilities.
Principal Findings
There were large differences in the amount of practice variation across levels of care and for different types of diabetes care indicators. The greatest amount of variance tended to be attributable to the facility level. For process measures, such as whether a hemoglobin A1c was measured, the facility and PCP effects were generally comparable. However, for three resource use measures the facility effect was at least six times the size of the PCP effect, and for intermediate outcome indicators, such as hyperlipidemia, facility effects ranged from two to sixty times the size of the PCP level effect. A somewhat larger PCP effect was found (5 percent of the variation) when we examined a “linked” process–outcome measure (linking hyperlipidemia and treatment with statins). When the PCP effect is small (i.e., 2 percent), a panel of two hundred diabetes patients is needed to construct profiles with 80 percent reliability.
Conclusions
Little of the variation in many currently measured diabetes care practices is attributable to PCPs and, unless panel sizes are large, PCP profiling will be inaccurate. If profiling is to improve quality, it may be best to focus on examining facility-level performance variations and on developing indicators that promote specific, high-priority clinical actions.
Keywords: Diabetes mellitus, practice profiling
Most sectors of the health care industry are engaged in a massive campaign to profile individual health care providers (Green and Wintfeld 1995; Garnick et al. 1994; Welch, Miller, and Welch 1994; Jencks and Wilensky 1992). Profiling is viewed as a way to contain costs and control practice variation in hopes of improving the quality of care. Inevitably, the focus on practice variation moved from the geographic level to the hospital and health plan level and then to the individual provider in an attempt to understand the reasons for variation and to assign accountability (Wennberg 1998; Ashton et al. 1999; Gatsonis et al. 1995; Casparie 1996; Kassirer 1994; Corrigan and Nielsen 1993; Hanchak and Schlackman 1995; Evans, Hwang, and Nagarajan 1995; Eddy 1998).
While appropriately placed accountability may be good for quality improvement, to date the effect of profiling on changing the practice patterns of individual providers has been mixed (Balas et al. 1996; Mainous et al. 2000; Weiss and Wagner 2000; Marshall et al. 2000; Evans, Hwang, and Nagarajan 1995). For example, while some studies demonstrated a positive effect of profiling on reducing hospital length of stay (Evans, Hwang, and Nagarajan 1995; Ross, Johnson, and Castronova 2000), others found that profiling had no apparent effect on physician prescribing behavior (Schectman et al. 1995; Mainous et al. 2000). Likewise, a meta-analysis of randomized clinical trials suggested that profiles had a statistically significant but minimal effect on the use of various clinical procedures, primarily medication prescribing and lab-test ordering (Balas et al. 1996). In addition to being of unclear value in achieving certain outcomes, profiling at the individual provider level is an expensive undertaking (Anonymous 1997; Eddy 1998; Hofer et al. 1999) and could adversely affect the professional careers of some providers (Blum 1996; Kassirer 1994). Moreover, if done in an uninformed way, profiling can produce meaningless rankings that will eventually undermine any possible positive effect on quality (Christiansen and Morris 1997; Goldstein and Spiegelhalter 1996; Normand, Glickman, and Gatsonis 1997), and provide an incentive for providers to act in ways that could actually worsen quality and access to care (Hofer et al. 1999; Hofer and Hayward 1996).
The delivery of health care services depends not only on individual providers but also on the system in which the provider works (e.g., practitioners organized within a provider group or practice setting that cares for individuals with specific types of insurance coverage and/or social conditions), and all levels within this system could affect both care processes and outcomes (Westert and Groenewegen 1999; Herman 2000; Landon, Wilson, and Cleary 1998; McNeil, Pedersen, and Gatsonis 1992). Nonetheless, most studies of and applications that draw on practice variation, such as provider profiling, tend to focus on a single level (e.g., individual practitioners) without taking into account the amount of variation potentially attributable to other levels within the care system. The few studies that have assessed the amount of attributable variation at different levels of care have found strikingly little variation at the physician level (Orav et al. 1996; Sixma, Spreeuwenberg, and van der Pasch 1998; Hofer et al. 1999; Katon et al. 2000). However, these studies have not rigorously examined variation at levels above the physician and usually focus on outcomes and costs of care. It has been argued that process measures might show larger amounts of variation at the physician level than do outcome measures (Sandy 2000; Shojania and Wachter 2000), but little work has been done to systematically address this issue.
Therefore, we examined the amount of practitioner level variation relative to other system effects for a broad selection of resource use, outcome, and process indicators for diabetes care. The Department of Veterans Affairs (VA) health care system, with its large number of facilities and single computerized information system, is one of the few places where it is possible to examine variation attributable to multiple levels within a health care system. The objectives of this study were: (1) to evaluate whether the greatest amount of variation in diabetes practice patterns occurs at the primary care provider (PCP), provider group, or facility level and whether provider level variation is more pronounced for measures based on processes of care; and, (2) to examine the reliability of performance profiles of high priority diabetes care quality and resource use indicators constructed using computerized hospital databases. This study is intended to help us better understand how to efficiently allocate resources for quality improvement and ensure that we focus on areas that are most likely to produce improvements in patient care.
Methods
Data Sources
We constructed a registry of patients with diabetes by integrating medical information system data from multiple sources. Pharmacy, laboratory, and primary care provider data were extracted from the Veterans Health Information Systems and Technology Architecture (VistA), which is a local clinical information system used at all medical centers operated by the Veterans Health Administration, for Fiscal Year 1998 (October 1, 1997–September 30, 1998). The pharmacy extract included the number of prescriptions and medication costs (based on the VA purchase price per dispense unit) for oral hypoglycemic agents, insulin, home glucose-monitoring supplies, cardiovascular medications (e.g., calcium channel blockers), and cholesterol lowering agents (e.g., statins [HMG-CoA reductase inhibitors]). Laboratory values were obtained for the following tests: hemoglobin A1c (HbA1c), low-density lipoprotein cholesterol (LDL-C), high-density lipoprotein cholesterol (HDL-C), and total cholesterol.
Provider data were obtained from the Primary Care Management Module (PCMM), which is also part of VistA. These data allowed us to determine patient-PCP assignments and identify provider groups. Although some of the facilities in the study sample are affiliated with academic medical centers, only 2 of the 13 study sites had residents assigned as PCPs for more than 10 percent of the patients. Provider group assignments were defined at the facility level and vary from groups consisting of one physician and a registered nurse, to groups with four to five general internists, residents, and one to two nurse practitioners or physician assistants, to groups with a firm structure that are composed of several physicians from various specialty areas.
We obtained encounter data with diagnosis codes from a single centralized source for the entire VA known as the National Patient Care Database. This database is a repository of primarily utilization and diagnostic data collected from the VistA systems at all VA facilities. Information extracted from this database included number of outpatient visits and the number of visits to an ophthalmology or optometry clinic. Patient age and comorbid conditions, as identified by the International Classification of Disease, Ninth Revision, Clinical Modification (ICD-9-CM) codes, also were obtained.
Sites and Patient Sample
The study dataset consisted of patients, providers, and facilities representing one regional integrated service network within the VA that serves parts of four states in the East North Central section of the country. The first step in constructing the study sample was to identify individuals with diabetes, which was done using pharmacy data only. Specifically, diabetes patients were defined as anyone who had at least one prescription for diabetes medications (oral agents or insulin) or home glucose-monitoring supplies during the year. Although some diabetes patients who are being managed through diet and exercise alone are missed with this strategy, we elected to use pharmacy data only because it appears to be the most specific method for identifying individuals who truly have diabetes.1
After identifying patients with diabetes, the study sample was limited to those who had at least one outpatient visit in 1998 and a designated PCP during the study period. The resulting dataset included 12,110 unique patients, 258 PCPs, 42 provider groups, and 13 facilities or sites of care (8 medical centers and 5 outpatient clinics). The median number of diabetes patients per provider was 24.
Variables
The selection of diabetes care indicators for the analysis (shown in Table 1) was based on a set of measures (both technical process and intermediate outcome) that have been proposed for diabetes care monitoring and quality improvement through the Diabetes Quality Improvement Project (DQIP) (Diabetes Quality Improvement Project 1998). This indicator set includes the percentage of patients who had at least one HbA1c obtained in the past year, and the percentage of patients with a high-risk HbA1c level (i.e., HbA1c ≥9.5 percent) based on the last value obtained.
Table 1.
Diabetes Care Indicators and Mean Values
| Diabetes Care Indicator | Average across All Facilities | Range of Mean Values across Facilities (N=13)† |
|---|---|---|
| Process Measures* | ||
| Hemoglobin A1c (HbA1c) obtained (%) | 83 | 68–91 |
| Low density lipoprotein cholesterol (LDL-C) successfully measured (%) | 38‡ | 33–56 |
| Lipid profile obtained (%) | 57‡ | 41–84 |
| Intermediate Outcomes | ||
| Last HbA1c value (mean [SD]) | 7.8% [1.9] | 7.1%–8.8% |
| Last HbA1c value ≥9.5% (%) | 15 | 5–32 |
| Last LDL-C value (mean [SD]) | 3.2 mmol/L [.85] | 2.9–3.5 mmol/L |
| 124 mg/dL [33] | 112–134 mg/dL | |
| Last LDL-C value ≥3.6 mmol/L (140 mg/dL) (%) | 27 | 18–34 |
| Last LDL-C value <3.6 mmol/L (140 mg/dL) or on a statin (%) | 85 | 79–91 |
| Resource Use# | ||
| Cost of hypoglycemic medications (mean [SD]) | $138 [189] | $106–$170 |
| Cost of home glucose monitoring for patients not on insulin (mean [SD]) | $66 [93] | $6–$122 |
| Cost of home glucose monitoring for patients on insulin (mean [SD]) | $152 [162] | $78–$224 |
| Cost of calcium channel blockers (mean [SD]) | $75 [136] | $46–$96 |
Percent of patients with test obtained in past 12 months.
LDL related measures are based on nine facilities due to incomplete lab data from four facilities, while HbA1c measures and the lipid profile measure are based on 12 facilities due to incomplete reporting from one facility.
LDL-C values are converted to conventional units by dividing mmol/L by .0259.
An LDL-C value could not be calculated for approximately one-third of those who had a lipid profile obtained due to elevated triglyceride values.
Average annual cost per patient.
The indicators used to assess lipid testing deviate slightly from those included in the DQIP measure set. In particular, we focused on the percentage of patients who had an LDL-C successfully measured (i.e., a value could be calculated) in the past year, rather than the past two years, since we had only one year of data. In addition, we examined whether a lipid profile was obtained, independent of whether an LDL-C value was successfully measured, since an LDL-C could not be calculated for many patients due to elevated triglyceride values. We also identified the percentage of patients with high-risk LDL-C values using a cutoff of 3.6 mmol/L (140 mg/dL) compared with the 3.4 mmol/L (130 mg/dL) used in DQIP. This decision reflects the lack of solid evidence for a clear cutoff value, accounting for variability in cholesterol measurement (Hofer and Weissfeld 1994), and a philosophical approach that recommends higher cutoff values than those identified in practice guidelines to help focus attention on patients at highest risk (Krein et al. 2000).
Another measure that was added specifically for this study is the percentage of patients with a measured LDL-C who either have an LDL-C value <3.6 mmol/L (140 mg/dL) or are on a statin. This hybrid measure links information on an intermediate outcome with a specific care process, demonstrating that action has been initiated in response to a clinical situation. This sort of combination indicator is especially interesting in that it incorporates information on the provider's response to a risk factor, in this case prescribing medication for an elevated LDL-C, and may therefore exhibit more variability at the provider level and be more appropriate for profiling purposes (Kerr et al. 2001).
We attempted to construct an eye exam indicator by measuring the percentage of patients with at least one visit to a VA ophthalmology or optometry clinic in the past year. However, a visit to one of these clinics only identifies care provided within the VA, and since it is well documented that many patients are receiving eye care services outside the VA system (Jones et al. 2000) this may not be an accurate depiction of the eye screening received by patients at some facilities and the results are not reported.
The other group of indicators included in the study represent resource and efficiency issues. This group contains the cost per patient for hypo-glycemic medications (oral agents or insulin) and the cost per patient for home glucose monitoring alone, which is a relatively high-cost item. Monitoring costs were examined separately for patients on and not on insulin because there is little evidence that regular monitoring is useful for most patients who are not using insulin (Faas, Schellevis, and van Eijk 1997). The last utilization indicator is the cost per patient for calcium channel blockers, which are more expensive than many other medications often used to treat hypertension and may not be the ideal first or second line option for patients with diabetes (Estacio et al. 1998; Tatti et al. 1998). It is important to note that because the costs for medications dispensed through the VA are generally negotiated on a national basis, the reported dollar values are intended as a measure of differences in the utilization of these medications and not differences in costs per se.
Finally, several studies have demonstrated the effect of case-mix adjustment on some of the measures included in practice profiles (Salem-Schatz et al. 1994; Fiscella and Franks 2001; Zaslavsky et al. 2000; Weiner et al. 1996; Zhang et al. 2000). Patient age and several comorbid conditions (conditions that occurred any time during the year and were coded as part of an inpatient or outpatient encounter) were used to assess the effect of adjusting for potential differences in case-mix. The comorbidity variables were constructed using the clinical classifications software obtained from the Agency for Healthcare Research and Quality (AHRQ), (Agency for Health Care Policy and Research, 2000) which aggregates ICD-9-CM diagnosis and procedure codes into several condition specific categories. The 12 conditions used as covariates, based on the diagnosis clustering method described by Schneeweiss et al. (1983), were acute upper and lower respiratory infection, hypertension, ischemic heart disease, malignant neoplasm, cerebrovascular disease, cardiac arrhythmia, chronic obstructive pulmonary disease, congestive heart failure, generalized arteriosclerosis, chest pain, mental health disorder (affective disorders, schizophrenia, anxiety), and substance related mental health disorder.
Statistical Analysis
The data were analyzed by estimating variance components models with multilevel (hierarchical) analysis techniques using MlwiN (MLwiN 2000). A multilevel approach takes into account the complex structure of the data, which consists of multiple patients receiving care from the same primary care provider, providers who are clustered together as groups, and groups that are clustered or nested within facilities. The principal model used for this study is a random intercept model with no explanatory variables included, also known as an empty model (Snijders and Bosker 1999). An empty model is invaluable for understanding the basic partitioning of the variability in the data between different levels (e.g., providers, groups, and facilities) (Snijders and Bosker 1999). A description of a basic two-level random intercept model is provided in the appendix.
The estimated variance components obtained from the multilevel modeling procedure were then used to calculate the intraclass correlation coefficient, which for this study is interpreted as the fraction of total variability attributable to a particular level of care (Snijders and Bosker 1999). The reported results are based on estimates obtained through simulation procedures (Markov Chain Monte Carlo methods), although maximum likelihood and quasi–likelihood-based estimates were generally comparable to the simulation-based estimates.
Indicators with continuous responses were analyzed using hierarchical linear models. For the cost indicators, the natural log transformation of costs was used as the dependent variable since the untransformed cost variables were quite skewed and a visual inspection of the residuals showed a significant departure from normality. While the transformation did result in some changes in the magnitude of the percentage of total variation attributable to different levels, in most cases it did not change the relative amount of attributable variation across the different levels. Indicators with binary outcomes or proportional responses were analyzed using generalized hierarchical linear models assuming a binomial error distribution with a logit link function.
All of the results are reported as percentages. For dichotomous indicators, the percentages are calculated based on a threshold model in which, for example, the outcome of whether a laboratory test was obtained is considered as an underlying continuous variable representing the propensity of the provider to obtain the test (Snijders and Bosker 1999). If this propensity is above a certain threshold the test is obtained. In general, the estimates from the empty models are considered maximum effects, as some variability is likely to be explained through the inclusion of explanatory variables.
The panel sizes needed to achieve a reliability of .8 for a given amount of attributable variance were determined through the use of the Spearman-Brown prophecy formula, as previously described by Hofer et al. (1999).
Results
The study sample consisted of individuals who were on average 65 years of age and had 2.4 comorbid conditions (out of a total of 12 as described above). The sample was predominantly male (98 percent) and 42 percent were on insulin. The range of mean values across facilities for all of the diabetes care quality indicators used in the analysis are displayed in Table 1. On the whole, the facilities included in this study are doing quite well in providing care for their patients with diabetes but there is a fair amount of variability across facilities. More than 80 percent of patients had an HbA1c obtained within the past year, 57 percent had a lipid panel obtained, and almost 40 percent had an LDL-C successfully measured in the past year.
The mean HbA1c value in the study sample was 7.8 percent (median=7.4 percent), which is below the ADA action point of 8 percent, and the mean (and median) LDL-C value was 3.2 mmol/L (124 mg/dL), which is below both the VA and DQIP standard of 3.4 mmol/L (130 mg/dL) for persons without coronary artery disease. Still, 15 percent of patients were above the high-risk threshold for HbA1c (≥9.5 percent) and 27 percent for LDL-C (3.6 mmol/L or 140 mg/dL), and almost one-third of patients at some facilities were in these high-risk subsets. Among patients with a measured LDL-C, 85 percent had a value <3.6 mmol/L (140 mg/dL) or were receiving statin therapy. As with the other indicators, the resource use measures show there is a wide range in values across the facilities. For example, the average cost of home glucose monitoring for individuals not on insulin ranged from $6 per patient per year at one facility to $122 per patient per year at the highest cost facility.
Table 2 shows the percentage of total variance explained by the different levels of care (facility, provider group, and PCP). The pattern of variation is fairly consistent. In almost every instance, the greatest amount of variation potentially attributable to practice pattern was at the facility level. There were some indicators, primarily process measures, with a moderate PCP effect (8 percent–10 percent) but this was usually accompanied by a comparable facility effect. The only exception was LDL-C obtained where the provider effect was clearly dominant. There was a second group of indicators with a small PCP effect (2 percent–7 percent) and generally a more substantial facility effect. This group consists mostly of resource use measures. Finally, the third group contained indicators with basically no detectable effect at the individual provider level. Indicators with a negligible PCP effect tend to be intermediate outcome measures, such as the percent of patients with HbA1c values above the high-risk threshold of 9.5 percent. However, there was a considerably larger PCP effect for the LDL-C/statin measure, which combines an intermediate outcome with a process measure. The overall pattern of maximum PCP effect for the different types of indicators is summarized in Table 3. For all of the indicators, there was a substantial patient/random error component that accounted for at least 70–75 percent of the total variation in the measure and often accounted for more than 90 percent of the variation.
Table 2.
Percent of Total Variance* Attributable to Facility, Provider Group, or Primary Care Provider
| Level of Care | |||
|---|---|---|---|
| Diabetes Care Indicator | Facility | Provider Group | PCP |
| Process Measures† | |||
| Hemoglobin A1c (HbA1c) obtained | 9% | 1% | 8% |
| Low density lipoprotein cholesterol (LDL-C) obtained‡ | – | 2% | 8% |
| Lipid profile obtained | 7% | 2% | 9% |
| Intermediate Outcomes | |||
| Last HbA1c value | 12% | 0 | 1% |
| Last HbA1c value ≥9.5% | 16% | 0 | 0 |
| Last LDL-C value‡ | 7% | – | 1% |
| Last LDL-C value ≥3.6 mmol/L (140 mg/dL)‡ | 2% | 1% | 1% |
| Last LDL-C value <3.6 mmol/L (140 mg/dL) or on a statin (%)‡ | 2% | 2% | 5% |
| Resource Use# | |||
| Cost of hypoglycemic medications | 1% | 0 | 2% |
| Cost of home glucose monitoring for patients not on insulin | 18% | 3% | 3% |
| Cost of home glucose monitoring for patients on insulin | 8% | 2% | 1% |
| Cost of calcium channel blockers | 1% | 0 | 0 |
The reported percentages (i.e., intraclass correlations) were calculated using Markov Chain Monte Carlo estimates. A dash (–) indicates being dropped from model for technical reasons and there is no detectable effect.
Percent of patients with test obtained or visit made in past 12 months
LDL related measures are based on 9 facilities due to incomplete lab data from some facilities, while HbA1c measures and the combined cholesterol measure are based on 12 facilities due to incomplete reporting from one facility.
Average cost per patient. Estimates generated using the natural log of costs for all cost related indicators.
Table 3.
Summary of Primary Care Provider (PCP) Effect
| Moderate PCP Effect (8%–10%) | Small PCP Effect (2%–7%) | No PCP Effect (<2%) |
|---|---|---|
| Obtaining lab tests | Pharmacy costs | Intermediate outcomes |
| • HbA1c* | • Hypoglycemic medications | • Mean last HbA1c value |
| • LDL-C | • Home glucose monitoring for patients not on insulin | • Percent with last HbA1c value ≥9.5% |
| • Lipid profile | • Mean Last LDL-C value | |
| • Percent with last LDL-C value ≥3.6 mmol/L (140 mg/dL) | ||
| Percent with last LDL-C <3.6 mmol/L (140 mg/dL) or on statin | ||
| Pharmacy costs | ||
| • Home glucose monitoring for patients on insulin | ||
| • Calcium channel blockers |
HbA1c=hemoglobin A1c.
Next, we examined the reliability of provider level performance profiles for the various types of diabetes indicators. For different amounts of variation, Figure 1 shows the required panel size (i.e., number of diabetes patients assigned to a PCP) for constructing profiles with 80 percent reliability. Profiles of indicators with a small PCP effect of 2 percent (e.g., cost of home glucose monitoring for patients not on insulin) would require panel sizes of nearly two hundred patients per provider to achieve a reliability of .8, while profiling indicators where 4 percent of the variation is attributable to the PCP would be 80 percent reliable with a panel size of one hundred patients per provider. The required panel size for profiling indicators with a moderate PCP effect of 8 percent (e.g., HbA1c obtained) is about fifty patients.
Figure 1.

Panel Size Required for 80% Reliability
Finally, to adjust for potential differences in case mix, we estimated models controlling for patient age and 12 co-morbid conditions. The inclusion of these patient-level covariates produced small changes in the estimated variance components for some of the indicators but did not have a substantial influence on the relative amount of attributable variation across levels. For example, for the intermediate outcome measure last-HbA1c value, the case-mix variables explained approximately 4 percent of the variance, the facility level estimate decreased from 12 percent to 11 percent and the PCP effect remained at 1 percent. Overall, the results obtained from the case-mix adjusted models were not substantially different from those found in Table 2.
Discussion
The goal of most practice profiling efforts is to improve quality or efficiency by decreasing variation and providing incentives to move providers toward more optimal care practices. However, for such a system to be effective, it requires a basic understanding of the sources of and reasons for this variation so that interventions can be appropriately targeted and resources expended wisely. This analysis demonstrates that there are sizeable differences in the amount of practice variation in diabetes care both across levels of care (PCP, provider group, and facility) and by type of indicator (resource use, processes, and intermediate outcome). The greatest amount of practice variation, for basically all of the indicators examined, tended to be attributable to the facility level. For process measures, such as whether an HbA1c was measured, the estimated facility and PCP effects were generally comparable (9 percent attributable to facility, 8 percent attributable to PCP). However, for three resource use measures, the facility effect was at least six times the size of the PCP effect; and, for the intermediate outcomes, the facility effects ranged from two to sixty times the size of the PCP level effect. The provider-group-level effects were negligible for most of the indicators.
Indicators with the largest PCP effects tended to be process measures, such as whether a lab test was obtained. Having an LDL-C value successfully measured in the past year was the only indicator in which the PCP effect was substantially greater than the facility effect. The reason for this result is not entirely clear, especially when the provider effect for whether a lipid profile was obtained is about the same as for LDL measured, but with the lipid profile measure there is also a facility effect that is comparable to the PCP effect. One key difference between the two measures is that not having an LDL-C value obtained can result from the inability to calculate an LDL-C for patients with elevated triglycerides, which in turn can be related to not fasting prior to sample collection. Therefore, providers who see more patients in the afternoons could have a more difficult time obtaining a fasting sample from their afternoon patients. However, it is often the case in practice that patients seen in the morning have also not been fasting and this result could be related to other factors.
Furthermore, an issue of greater importance is whether patients of practitioners who obtain lipid or HbA1c tests more frequently than their peers actually achieve better levels of control. If not, can we legitimately consider them “quality” measures? Ordering a lab test is just the first step, but can only improve the quality of care if it results in better treatment and, ultimately, better health outcomes. Therefore, while process measures (like HbA1c obtained in the past year) may be more feasible to profile, such an effort could also be counterproductive, as well as a waste of time and money, if it allows providers to “game the system” without truly improving meaningful aspects of patient care.
It is somewhat disappointing that the greatest amount of PCP practice variation was observed for processes of care that have a relatively weak association with clinical outcomes (e.g., frequency of HbA1c testing) and there was almost no PCP level variation in indicators for which there is stronger evidence that improvements should result in better patient outcomes (e.g., lipid and glycemic control). While it is conceivable that even for indicators where there is a small PCP effect, changes in practice affecting only 2 percent of the variation could have an effect on outcomes (either clinical or economic) that is considered important on an absolute scale, this does not negate the fact that a sufficient sample size and some detectable variability are necessary to generate accurate profiles. Otherwise, resources and attention may be spent on trying to address illusory differences in practice or result in some practitioners being unfairly penalized.
On the other hand, we feel that a particularly provocative finding is that a considerably larger PCP effect was detected for the combined LDL-C (intermediate outcome) and statin use (process) measure, when compared with the standard intermediate outcome indicators. There are several very attractive features of such “linked” process-intermediate outcome measures. First, they are more clinically meaningful than either process measures or intermediate outcomes in isolation (Lasker, Shapiro, and Tucker 1992). Second, this type of indicator reflects an activity that is more controllable by the clinician and therefore may be more reliably profiled at the PCP level. Third, the clinician could receive immediate credit for his/her actions (such as starting and titrating proven medical therapies) rather than being penalized for caring for sicker patients. Consequently, the use of “linked” measures may help avoid one of the potentially perverse incentives associated with profiling, whereby providers can more easily improve their intermediate outcome profiles by avoiding or deselecting patients than by improving their care (Hofer et al. 1999).
Generally, these results suggest that differences observed with many currently used performance indicators may be related more to facility level factors, be it organizational characteristics or attributes of the patient population, rather than to the practice patterns of individual providers or provider groups. Moreover, profiling of PCPs using these indicators is apt to be less accurate, and perhaps less effective, than facility profiling due to the smaller amount of systematic detectable variation at the PCP level. For the process measures with the largest PCP effects (around 8 percent), generating a reliable profile would still require a panel size of close to 50 patients per provider. While some PCPs have a panel containing 50 or more patients with diabetes, oftentimes the number of patients that belong to a particular health plan is much smaller, thereby decreasing the effective panel size if profiling is done by a single insurer. In addition, for several of the most important indicators (e.g., lipid control), panel sizes of at least 200 patients would be needed to produce reliable profiles. Two-thirds of the PCPs in this study had a panel of fewer than 50 patients with diabetes and the median panel size was 24 patients. Similarly, the reported median panel size for a group of 250 PCPs at one HMO was 29 (Hofer et al. 1999). Most facilities, on the other hand, have several hundred to several thousand patients with diabetes.
The literature on variations in practice patterns is extensive. However, few studies explicitly identify the amount of variation attributable to individual practitioners and yet even fewer consider the relative amount of variability attributable to other levels of care. Our findings on variation in individual provider practices are consistent with other published estimates. These estimates range from 2 percent of the variability in resource use at a teaching hospital (Hayward et al. 1994), 3 percent of the variability in the prescribing rates of general practitioners (Davis and Gribben 1995), 4 percent of the variability in outpatient visits for patients with diabetes (Hofer et al. 1999), and 10 percent or less of the variance in three measures of patient satisfaction (Sixma, Spreeuwenberg, and van der Pasch 1998). The largest effects to date have been found by Orav et al. (1996) who estimated that practitioner effects accounted for 22 percent of the variability in follow up of high serum glucose and 23 percent in the monitoring of patients on digoxin. However, the practitioner level effects for other indicators assessed within the same study were much smaller (e.g., 9 percent of the variance for hematocrit screening, 3 percent for cancer screening, and from 4 percent to 15 percent for different pediatric care measures including gastroenteritis, otitis media, urinary tract infection, and well child care) (Orav et al. 1996).
Case-mix adjustment resulted in minimal changes in the observed pattern of attributable variation across levels. However, case-mix adjustment is not a simple matter. The approach we used might be reasonable for adjusting outcomes such as mortality or resource use since individuals who have more illnesses or certain types of illnesses are often more likely to die or use more resources (Weiner et al. 1996; Shwartz et al. 1994). In contrast, simply because someone has other comorbidities (or certain sociodemographic characteristics) does not, for example, mean that we should not continue to monitor their level of glycemic control by obtaining an HbA1c or that they will necessarily have poorer glycemic control. Therefore, without convincing biological, physiological, or epidemiological evidence, it may not be appropriate to adjust for these factors when looking at process measures or intermediate outcomes as this would obscure what might be true differences in care quality (Hanchak and Schlackman 1995). Additionally, incorporating case-mix information tended to decrease the amount of attributable variance at certain levels for some of the indicators, and the use of a more rigorous adjustment process could make the PCP and facility effects even smaller (Salem-Schatz et al. 1994). Nonetheless, more work is needed to identify how patient-specific factors influence variability, particularly at the facility level, across a broad range of quality indicators.
There are limitations associated with this analysis. First, there were patients at each facility who were not assigned to a specific PCP and thus not included in our analysis. These patients were less likely to have specified tests completed, had slightly poorer values for intermediate outcome measures, and used fewer resources. However, this pattern was true at all facilities and even though the proportion of unassigned patients varied by facility we could not identify any other systematic site-specific reasons for whether a patient did or did not have an assigned PCP. Additionally, while the results reported are based on models that excluded these unassigned patients, models including this group produced the same patterns and conclusions. Second, the lack of variation attributable to the provider group level may be due to the lack of consistency in group definitions across study sites, although several sites now report they are actively promoting the development of more functional provider groups. Third, these analyses are based on data from one large regional health care system operated by the VA and may not be representative of other care systems. On the other hand, there are currently very few places outside the VA that have the type of data required for conducting such analysis and, as discussed above, analyses using data from other health systems suggest the results may be similar (e.g., Orav et al. 1996; Hofer et al. 1999). Nonetheless, further studies are needed to examine these issues both inside and outside the VA. Finally, this analysis focuses on diabetes-related measures only and it is possible that different results could be found with other condition-specific or generic indicators (or other aspects of care such as satisfaction and patient–provider communication) used in performance monitoring and profiling systems. Nevertheless, the diabetes indicators are among the most well-developed and widely used measures and this analysis includes some of the most common types of indicators that one is likely to encounter in any sort of profiling system.
In conclusion, this study suggests that a considerable amount of time and resources may be wasted in trying to develop and implement practice profiles of individual primary care providers using many of the currently popular quality indicators. Instead, efforts might be better spent on developing and evaluating indicators that are not designed just to grade providers but to support and promote specific, high-priority clinical actions. Likewise, in-creased emphasis on constructing and examining facility/clinic level profiles may be more productive. This includes the advancement of information systems for obtaining detailed clinical data; continued support for the creation and use of a consistent measurement set (e.g., HEDIS) that focuses on aspects of care that are truly important for improving patient outcomes; and finally, identifying what factors contribute to performance differences at the facility or clinic level, including characteristics of the patient population and the facility (e.g., academic affiliation, practitioner mix, implementation of special programs or clinics, and referral procedures). These steps will, in turn, help with initiating more targeted and prudent approaches to promoting improvements both in patient care and patient health outcomes.
Acknowledgments
Thank you to Jennifer Davis and the VA Healthcare Analysis and Information Group for their invaluable assistance with data collection and in preparing the dataset used in this project. Thank you also to Len Pogach for his comments and suggestions on early drafts of this manuscript.
Appendix
Below is an example of a two-level random intercept model. Models with more than two levels are a straightforward extension of this basic model.
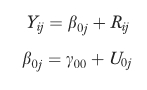 |
In the example, j is the index for the group (j=1, …, N) and i is the index for the individuals within a group (i=1, …, nj); Yij is the dependent variable; β0j is the random intercept; and, Rij the residual or individual-level random effect. β0j can be decomposed into γ00, the group-level mean, which is a constant reflecting the average intercept at the group level and U0j is the group-level random effect (group residuals), which describes how the groups (e.g., facilities, groups) vary around the group-level mean thus allowing β0j to vary randomly from one group to the next.
The groups are considered a random sample from a population of groups and the random coefficient U0j, which represents the amount of “unexplained variability” associated with that group, is regarded as a latent variable that is normally distributed with mean 0 and variance τ02. Likewise the residual Rij is assumed to be normally distributed with mean 0 and variance σ2.
Notes
Through a pilot project examining different strategies for identifying patients with diabetes, we found that the use of diabetes-related diagnostic codes in addition to pharmacy data does indeed increase the number of patients identified. However, medical records verification showed that the use of diagnostic codes also results in the identification of individuals who have elevated blood glucose levels for other reasons, such as the use of certain medications, and who are therefore not likely to be treated by most providers as someone with diabetes. Results of this analysis can be obtained upon request from the author.
This research was supported in part by the Department of Veterans Affairs Health Services Research and Development as part of the Quality Enhancement Research Initiative, DIB98-001. Drs. Hofer and Kerr were recipients of the VA HSR&D Career Development Awards at the time the study was conducted. Abstracts were presented at the VA HSR&D Annual Meeting, March 2000, the Society for General Internal Medicine 23rd Annual Meeting, May 2000, and the 3rd International Conference on the Scientific Basis of Health Services Research, October 1999.
References
- Agency for Health Care Policy and Research. “Clinical Classifications Software (CCS) Summary and Download Summary and Downloading Information.”. [May 3, 2000];2000 Available at http://www.ahrq.gov/data/ccs.htm.
- Anonymous. “Gauging Quality Regulation's Impact on Premium Costs.”. Medicine and Health. 1997;51(46):1. [Google Scholar]
- Ashton CM, Petersen NJ, Souchek J, Menke TJ, Yu H, Pietz K, Eigenbrodt ML, Barbour G, Kizer KW, Wray NP. “Geographic Variations in Utilization Rates in Veterans Affairs Hospitals and Clinics.”. New England Journal of Medicine. 1999;340(1):32–9. doi: 10.1056/NEJM199901073400106. [DOI] [PubMed] [Google Scholar]
- Balas EA, Boren SA, Brown GD, Ewigman BG, Mitchell JA, Perkoff GT. “Effect of Physician Profiling on Utilization: Meta-Analysis of Randomized Clinical Trials.”. Journal of General Internal Medicine. 1996;11(10):584–90. doi: 10.1007/BF02599025. [DOI] [PubMed] [Google Scholar]
- Blum JD. “The Evolution of Physician Credentialing into Managed Care Selective Contracting.”. American Journal of Law and Medicine. 1996;22(2–3):173–203. [PubMed] [Google Scholar]
- Casparie AF. “The Ambiguous Relationship between Practice Variation and Appropriateness of Care: An Agenda for Further Research.”. Health Policy. 1996;35(3):247–65. doi: 10.1016/0168-8510(95)00787-3. [DOI] [PubMed] [Google Scholar]
- Christiansen CL, Morris CN. “Improving the Statistical Approach to Health Care Provider Profiling.”. Annals of Internal Medicine. 1997;127(8 pt 2):764–8. doi: 10.7326/0003-4819-127-8_part_2-199710151-00065. [DOI] [PubMed] [Google Scholar]
- Corrigan JM, Nielsen DM. “Toward the Development of Uniform Reporting Standards for Managed Care Organizations: The Health Plan Employer Data and Information Set (Version 2.0)”. Joint Commission Journal of Quality Improvement. 1993;19(12):566–75. doi: 10.1016/s1070-3241(16)30037-2. [DOI] [PubMed] [Google Scholar]
- Davis P, Gribben B. “Rational Prescribing and Interpractitioner Variation: A Multilevel Approach.”. International Journal of Technology Assessment in Health Care. 1995;11(3):428–42. doi: 10.1017/s0266462300008655. [DOI] [PubMed] [Google Scholar]
- Diabetes Quality Improvement Project. “Diabetes Quality Improvement Project, Initial Measure Set”. [November 25 1998];1998 Available at http://www.diabetes.org/professional. [Google Scholar]
- Eddy DM. “Performance Measurement: Problems and Solutions.”. Health Affairs. 1998;17(4):7–25. doi: 10.1377/hlthaff.17.4.7. [DOI] [PubMed] [Google Scholar]
- Estacio RO, Jeffers BW, Hiatt WR, Biggerstaff SL, Gifford N, Schrier RW. “The Effect of Nisoldipine as Compared with Enalapril on Cardiovascular Outcomes in Patients with Non-Insulin-Dependent Diabetes and Hypertension.”. New England Journal of Medicine. 1998;338(10):645–52. doi: 10.1056/NEJM199803053381003. [DOI] [PubMed] [Google Scholar]
- Evans JH, Hwang Y, Nagarajan N. “Physicians' Response to Length-of-Stay Profiling.”. Medical Care. 1995;33(11):1106–19. doi: 10.1097/00005650-199511000-00004. [DOI] [PubMed] [Google Scholar]
- Faas A, Schellevis FG, van Eijk JTM. “The Efficacy of Self-Monitoring of Blood Glucose in NIDDM Subjects.”. Diabetes Care. 1997;20(9):1482–6. doi: 10.2337/diacare.20.9.1482. [DOI] [PubMed] [Google Scholar]
- Fiscella K, Franks P. “Impact of Patient Socioeconomic Status on Physician Profiles: A Comparison of Census-Derived and Individual Measures.”. Medical Care. 2001;39(1):8–14. doi: 10.1097/00005650-200101000-00003. [DOI] [PubMed] [Google Scholar]
- Garnick DW, Fowles J, Lawthers AG, Weiner JP, Parente ST, Palmer RH. “Focus on Quality: Profiling Physicians' Practice Patterns.”. Journal of Ambulatory Care Management. 1994;17(3):44–75. doi: 10.1097/00004479-199407000-00008. [DOI] [PubMed] [Google Scholar]
- Gatsonis C, Epstein AM, Newhouse JP, Normand SL, McNeil BJ. “Variations in the Utilization of Coronary Angiography for Elderly Patients with an Acute Myocardial Infarction.”. Medical Care. 1995;33(6):625–42. doi: 10.1097/00005650-199506000-00005. [DOI] [PubMed] [Google Scholar]
- Goldstein H, Spiegelhalter DJ. “League Tables and Their Limitations: Statistical Issues in Comparisons of Institutional Performance.”. Journal of the Royal Statistical Society, Series A. 1996;159(3):385–43. [Google Scholar]
- Green J, Wintfeld N. “Report Cards on Cardiac Surgeons: Assessing New York State's Approach.”. New England Journal of Medicine. 1995;332(18):1229–32. doi: 10.1056/NEJM199505043321812. [DOI] [PubMed] [Google Scholar]
- Hanchak NA, Schlackman N. “The Measurement of Physician Performance.”. Quality Management in Health Care. 1995;4(1):1–12. doi: 10.1097/00019514-199504010-00001. [DOI] [PubMed] [Google Scholar]
- Hayward RA, Manning WG, McMahon LF, Bernard AM. “Do Attending or Resident Physician Practice Styles Account for Variations in Hospital Resource Use.”. Medical Care. 1994;32(8):788–94. doi: 10.1097/00005650-199408000-00003. [DOI] [PubMed] [Google Scholar]
- Herman WH. “More Than Provider Specialty.”. Medical Care. 2000;38(2):128–30. doi: 10.1097/00005650-200002000-00002. [DOI] [PubMed] [Google Scholar]
- Hofer T, Hayward R. “Identifying Poor-Quality Hospitals. Can Hospital Mortality Rates Detect Quality Problems for Medical Diagnoses?”. Medical Care. 1996;34(8):737–53. doi: 10.1097/00005650-199608000-00002. [DOI] [PubMed] [Google Scholar]
- Hofer TP, Hayward RA, Greenfield S, Wagner EH, Kaplan SH, Manning WG. “The Unreliability of Individual Physician ‘Report Cards’ for Assessing the Costs and Quality of Care of a Chronic Disease.”. Journal of the American Medical Association. 1999;281(22):2098–105. doi: 10.1001/jama.281.22.2098. [DOI] [PubMed] [Google Scholar]
- Hofer T, Weissfeld J. “Designing a Simpler High Blood Cholesterol Case Detection Strategy: Are the Advantages of the NCEP Protocol Worth the Complexity?”. Medical Decision Making. 1994;14(4):357–68. doi: 10.1177/0272989X9401400406. [DOI] [PubMed] [Google Scholar]
- Jencks DF, Wilensky GR. “The Health Care Quality Improvement Initiative. A New Approach to Quality Assurance in Medicare.”. Journal of the American Medical Association. 1992;268(7):900–3. [PubMed] [Google Scholar]
- Jones D, Hendricks A, Comstock C, Rosen A, Chang BH, Rothendler J, Hankin C, Prashker M. “Eye examinations for VA patients with diabetes: standardizing performance measures.”. International Journal of Quality Health Care. 2000;12(2):97–104. doi: 10.1093/intqhc/12.2.97. [DOI] [PubMed] [Google Scholar]
- Kassirer JP. “The Use and Abuse of Practice Profiles.”. New England Journal of Medicine. 1994;330(9):634–6. doi: 10.1056/NEJM199403033300910. [DOI] [PubMed] [Google Scholar]
- Katon W, Rutter CM, Lin E, Simon G, Von Korff M, Bush T, Walker E, Ludman E. “Are There Detectable Differences in Quality of Care or Outcome of Depression across Primary Care Providers?”. Medical Care. 2000;38(6):552–61. doi: 10.1097/00005650-200006000-00002. [DOI] [PubMed] [Google Scholar]
- Kerr EA, Krein SL, Vijan S, Hofer TP, Hayward RA. “Avoiding Pitfalls in Chronic Disease Quality Measurement: A Case for the Next Generation of Technical Quality Measures.”. American Journal of Managed Care. 2001;7(11):1033–43. [PubMed] [Google Scholar]
- Krein SL, Hayward RA, Pogach L, BootsMiller BB. “Department of Veterans Affairs' Quality Enhancement Research Initiative for Diabetes Mellitus.”. Medical Care. 2000;38(6 QUERI supplement):I38–48. doi: 10.1097/00005650-200006001-00005. [DOI] [PubMed] [Google Scholar]
- Landon BE, Wilson IB, Cleary PD. “A Conceptual Model of the Effects of Health Care Organizations on the Quality of Medical Care.”. Journal of the American Medical Association. 1998;279(17):1377–82. doi: 10.1001/jama.279.17.1377. [DOI] [PubMed] [Google Scholar]
- Lasker RD, Shapiro DW, Tucker AM. “Realizing the Potential of Practice Pattern Profiling.”. Inquiry. 1992;29(3):287–97. [PubMed] [Google Scholar]
- McNeil BJ, Pedersen SH, Gatsonis C. “Current Issues in Profiling Quality of Care.”. Inquiry. 1992;29(3):298–307. [PubMed] [Google Scholar]
- Mainous AG, Hueston WJ, Love MM, Evans ME, Finger R. “An Evaluation of Statewide Strategies to Reduce Antibiotic Overuse.”. Family Medicine. 2000;32(1):22–9. [PubMed] [Google Scholar]
- Marshall MN, Shekelle PG, Leatherman S, Brook RH. “The Public Release of Performance Data: What Do We Expect to Gain? A Review of the Evidence.”. Journal of the American Medical Association. 2000;283(14):1866–74. doi: 10.1001/jama.283.14.1866. [DOI] [PubMed] [Google Scholar]
- MLwiN computer software. London: Institute of Education, University of London, Multilevel Models Project; 2000. [Google Scholar]
- Normand SLT, Glickman ME, Gatsonis C. “Statistical Methods for Profiling Providers of Medical Care: Issues and Applications.”. Journal of the American Statistical Association. 1997;92(439):803–14. [Google Scholar]
- Orav EJ, Wright EA, Palmer RH, Hargraves JL. “Issues of Variability and Bias Affecting Multisite Measurement of Quality of Care.”. Medical Care. 1996;34(9 supplement):SS87–101. doi: 10.1097/00005650-199609002-00009. [DOI] [PubMed] [Google Scholar]
- Ross G, Johnson D, Castronova F. “Physician Profiling Decreases Inpatient Length of Stay Even with Aggressive Quality Management.”. American Journal of Medical Quality. 2000;15(6):233–40. [PubMed] [Google Scholar]
- Salem-Schatz S, Moore G, Rucker M, Pearson SD. “The Case for Case-mix Adjustment in Practice Profiling. When Good Apples Look Bad.”. Journal of the American Medical Association. 1994;272(11):871–4. [PubMed] [Google Scholar]
- Sandy L. “Unreliability of Physician ‘Report Cards’ to Assess Cost and Quality of Care.”. Journal of the American Medical Association. 2000;283(1):51–2. [PubMed] [Google Scholar]
- Schectman JM, Kanwal NK, Schroth WS, Elinsky EG. “The Effect of an Education and Feedback Intervention on Group-Model and Network-Model Health Maintenance Organization Physician Prescribing Behavior.”. Medical Care. 1995;33(2):139–44. [PubMed] [Google Scholar]
- Schneeweiss R, Rosenblatt RA, Cherkin DC, Kirkwood R, Hart G. “Diagnosis Clusters: A New Tool for Analyzing the Content of Ambulatory Medical Care.”. Medical Care. 1983;21(1):105–22. doi: 10.1097/00005650-198301000-00008. [DOI] [PubMed] [Google Scholar]
- Shojania K, Wachter R. “Unreliability of Physician ‘Report Cards’ to Assess Cost and Quality of Care.”. Journal of the American Medical Association. 2000;283(1):52. [PubMed] [Google Scholar]
- Shwartz M, Ash AS, Anderson J, Iezzoni LI, Payne SMC, Restuccia JD. “Small-Area Variations in Hospitalization Rates: How Much You See Depends on How You Look.”. Medical Care. 1994;32(3):189–201. doi: 10.1097/00005650-199403000-00001. [DOI] [PubMed] [Google Scholar]
- Sixma HJ, Spreeuwenberg PM, van der Pasch MA. “Patient Satisfaction with the General Practitioner: A Two-Level Analysis.”. Medical Care. 1998;36(2):212–29. doi: 10.1097/00005650-199802000-00010. [DOI] [PubMed] [Google Scholar]
- Snijders TAB, Bosker RJ. Multilevel Analysis: An Introduction to Basic and Advanced Multilevel Modeling. Thousand Oaks CA: Sage; 1999. [Google Scholar]
- Tatti P, Pahor M, Byington RP, Di Mauro P, Guarisco R, Strollo G, Strollo R. “Outcome Results of the Fosinopril Versus Amlodipine Cardiovascular Events Randomized Trial (FACET) in Patients with Hypertension and NIDDM.”. Diabetes Care. 1998;21(4):597–603. doi: 10.2337/diacare.21.4.597. [DOI] [PubMed] [Google Scholar]
- Weiner JP, Starfield BH, Powe NR, Stuart ME, Steinwachs DM. “Ambulatory Care Practice Variation within a Medicaid Program.”. Health Services Research. 1996;30(6):751–70. [PMC free article] [PubMed] [Google Scholar]
- Weiss KB, Wagner R. “Performance Measurement through Audit, Feedback, and Profiling as Tools for Improving Clinical Care.”. Chest. 2000;118(2 supplement):53S–8. doi: 10.1378/chest.118.2_suppl.53s. [DOI] [PubMed] [Google Scholar]
- Welch HG, Miller ME, Welch WP. “Physician Profiling: An Analysis of Inpatient Practice Patterns in Florida and Oregon.”. New England Journal of Medicine. 1994;330(9):607–12. doi: 10.1056/NEJM199403033300906. [DOI] [PubMed] [Google Scholar]
- Wennberg DE. “Variation in the Delivery of Health Care: The Stakes Are High.”. Annals of Internal Medicine. 1998;12(10):866–8. doi: 10.7326/0003-4819-128-10-199805150-00012. [DOI] [PubMed] [Google Scholar]
- Westert GP, Groenewegen PP. “Medical Practice Variations: Changing the Theoretical Approach.”. Scandinavian Journal of Public Health. 1999;27(3):173–80. [PubMed] [Google Scholar]
- Zaslavsky A, Hochheimer J, Schneider EC, Cleary PD, Seidman J, McGlynn EA, Thompson J, Sennett C, Epstein A. “Impact of Sociodemographic Case Mix on the HEDIS Measures of Health Plan Quality.”. Medical Care. 2000;38(10):981–92. doi: 10.1097/00005650-200010000-00002. [DOI] [PubMed] [Google Scholar]
- Zhang Q, Safford M, Ottenweller J, Hawley G, Repke D, Burgess JF, Dhar D, Cheng H, Naito H, Pogach LM. “Performance Status of Health Care Facilities Changes with Risk Adjustment of HbA1c.”. Diabetes Care. 2000;23(7):919–27. doi: 10.2337/diacare.23.7.919. [DOI] [PubMed] [Google Scholar]