

Abstract
Objective
To quantify the relative and absolute importance of different factors contributing to increases in per capita prescription drug costs for a population of Canadian seniors.
Data Sources/Study Setting
Data consist of every prescription claim from 1985 to 1999 for the British Columbia Pharmacare Plan A, a tax-financed public drug plan covering all community-dwelling British Columbians aged 65 and older.
Study Design
Changes in per capita prescription drug expenditures are attributed to changes to four components of expenditure inflation: (1) the pattern of exposure to drugs across therapeutic categories; (2) the mix of drugs used within therapeutic categories; (3) the rate of generic drug product selection; and (4) the prices of unchanged products.
Data Collection/Extraction Methods
Data were extracted from administrative claims files housed at the UBC Centre for Health Services and Policy Research.
Principal Findings
Changes in drug prices, the pattern of exposure to drugs across therapeutic categories, and the mix of drugs used within therapeutic categories all caused spending per capita to increase. Incentives for generic substitution and therapeutic reference pricing policies temporarily slowed the cost-increasing influence of changes in product selection by encouraging the use of generic drug products and/or cost-effective brand-name products within therapeutic categories.
Conclusions
The results suggest that drug plans (and patients) would benefit from more concerted efforts to evaluate the relative cost-effectiveness of competing products within therapeutic categories of drugs.
Keywords: Prescription drugs, expenditures, pharmaceuticals
After adjusting for general inflation, per capita drug costs more than doubled in North America between 1985 and 1999 (Health Care Financing Administration 2000; Canadian Institute for Health Information 2001; Organization for Economic Cooperation and Development 2001). Under increased influence from consumer-directed advertising, and with many product launches imminent, the North American drug bill is expected to double again soon (National Institute for Health Care Management 1999; Mullins et al. 2001). Rising prescription drug expenditures have been, and will likely continue to be, particularly salient for senior citizens. Not only are these traditionally high users of pharmaceuticals growing in number, their average drug bill is also increasing rapidly (Anonymous 2000). Increased pharmaceutical expenses have put many elderly Americans in financial jeopardy, provoking demands for a government sponsored U.S. Medicare drug benefit program (Medicare Payment Advisory Committee 2000). Paradoxically, the rising cost of prescription drugs for seniors threatens publicly provided coverage currently available in Canada (BC Pharmacare 2001).
For those (thinking about) managing drug benefits plans, it is important to understand the cost dynamics underlying the rise in prescription drug spending. If cost pressures derive from real increases in the utilization of drug therapy—driven by increased medical needs or improved pharmacotherapy—then benefits policy might be focused on access. Ensuring continued (or improved) access to appropriate and cost-effective drug treatment through public drug benefits programs may be a sound investment of public resources; scaling back may prove penny-wise and pound-foolish (Soumerai et al. 1993; Tamblyn et al. 2001). If expenditure inflation arises from increases in the cost of drugs used in the treatment or management of illness, then a prudent drug benefit manager would focus on prices. There is, however, more than one dimension to the price of drug therapy. The price of individual drug products has an obvious and direct impact on the cost of treatment. Managers can influence this through negotiations, bulk purchasing, or even price regulation. Perhaps equally important in determining the cost (and, of course, benefit) of drug therapy is the selection of drug type and supplier (i.e., brand or generic). If cost increases are observed to be the result of shifts to more expensive products without evidence of proportionate increases in the quality of therapeutic outcomes, benefits managers might be well advised to focus on promoting best practices. Cost-effective drug use may be promoted, and unnecessary expenditures contained, through generic substitution policies, the incorporation of cost-effectiveness analyses in decisions about formularies, or through therapeutic reference pricing policies.
While this mapping of possible sources of cost pressure with potential policy foci seems straightforward, determining the relative importance of different sources of cost increase is far less so. Determining relative trends in the level and cost of drug therapy received by a large population is a complex undertaking. It is easy to mislead, and to be misled. The purpose of this paper is to illustrate methods for estimating the relative impacts of a multiplicity of factors that contribute to changes in per capita drug costs among large populations.
Using data from the seniors' drug benefit program in a Canadian province (British Columbia), four components of drug expenditure inflation are quantified. The components are (1) the pattern of exposure to pharmacologic treatment across different therapeutic categories; (2) the selection of drug types within therapeutic categories; (3) the rate of generic drug product selection; and (4) the price of the individual drug products purchased. The results shed new light on the debate over the relative contributions of “price” and “utilization” in determining per capita seniors' drug costs. Not only do the results establish the relative significance of the four components in the specific context of the BC seniors drug plan, but they show the importance of being clear about what ‘counts’ as utilization in a drug spending analysis.
Theory
The simplest way of describing changes in prescription drug costs is to separate them into the effects of price inflation and quantity change. This is the approach implicitly taken when the relatively slow growth of pharmaceutical prices is cited as evidence that the primary source of drug cost escalation is increased utilization—driven by the unquantified forces of needs, innovation, and demand (Noonan, Raymond, and Gesalman 2000; Pharmaceutical Research and Manufacturers of America 2000; Patented Medicine Prices Review Board 2000). Such conclusions are typically based solely on evidence of slow growth in the prices of individual drug products (i.e., pills, tablets, or bottles of a particular brand and form of a particular drug). By inference, all influences other than such “pure” price changes are referred to as the trend in prescription drug quantities or “utilization.” This statistical abstraction includes, by construction, all nonprice factors underlying changes in overall drug expenditures, and is in no way limited to “pure” utilization changes (i.e., changes in the quantity consumed of particular products).
Interpreting the common utilization measure poses some difficulty. The statistical approach to estimating changes in aggregate utilization—dividing pharmaceutical expenditures by a consumer price index for the drugs in question—captures both changes in “pure” utilization, and the cost impact of changes in the “basket” of drugs purchased. Substitutions from low-cost to high-cost medicines (due, for example, to new product availability or a successful marketing campaign) do not turn up as price inflation using conventional measures. Rather, these changes in the pattern of drug selection end up embodied in the measure of aggregate utilization. Where high-cost products replace low-cost ones, changes shows up as an apparent increase in the quantity of drugs consumed. The reason for this is that the standard statistical approach to measuring the utilization component of drug expenditure inflation is rooted in economic theory that assumes consumers are fully informed, rational, and financially accountable for their decisions. Such assumptions imply that higher cost drugs generate better outcomes—informed, rational, and financially accountable consumers would not purchase them otherwise. Thus, selection of higher cost medicines is somewhat tautologically inferred to imply the selection of “more” therapy per course of treatment. When patients are switched to appropriate, low-cost medicines (e.g., a trend toward thiazide diuretics for uncomplicated hypertension), this shows up as a decline in aggregate utilization because the statistical methodology assumes that lower prices reflect lower quality of care per episode of therapy.
Although the standard economic assumptions make the analysis of spending trends particularly simple, it is often inappropriate to assume that the quantity or quality of outcomes is proportionate to the cost of prescribed drug products. Pharmaceuticals are not like the ordinary commodities to which standard economic models apply. Asymmetric information, imperfect decision making, and nonstandard financial incentives are all common in the pharmaceutical sector, and all inconsistent with the model of consumer behavior that guarantees a relationship between the relative price and the relative value of goods purchased (Berndt et al. 2000). In fact, the violation of key economic assumptions—that decision makers are financially accountable for decisions they make and that they are fully informed about the availability and characteristics of competing products—may foster an inefficient reliance on newer, high-cost products in the pharmaceutical sector. The cost implications of this can be significant (Morgan 2001).
To overcome the obvious shortcomings of analyses based on the standard economic assumptions, health services researchers have long sought a richer and more accurate representation of the underlying dynamics of drug spending (Mehl 1984). Recent studies—made possible by the availability of large, representative databases—have assessed drug expenditure trends by looking at such indicators as the cost per prescription, numbers of prescriptions per capita (or per plan beneficiary), the days of treatment per prescription, and the relative cost of prescriptions for “new” versus “old” drugs (Merlis 2000). In many ways, such analyses represent progress toward a framework for drug spending analysis that makes the pharmacologic effect of drug consumption the unit of “utilization” that is to be measured. Studies tracking the use and cost of drugs within therapeutic categories (e.g., antihypertensive drugs) make this explicit, separating the “utilization” of any drug commonly used to meet given therapeutic ends (e.g., reducing blood pressure and the associated risk of stroke and heart disease) from the cost impact of price changes and product substitutions within that category of drug treatments (Mehl 1984; Dubois et al. 2000; Morgan 2001).
Given the richness of databases that track drug utilization and costs for large populations of insured individuals, it is possible to incorporate the details obtained in class-by-class analyses of drug utilization into an aggregate analysis of drug spending trends. In doing so, one can capture the cost impact of changes in prescription drug use—particularly product substitutions—that do not significantly alter the type and quality of therapy received by patients. What this requires is an acceptable model of drug expenditures and appropriate formulae for quantifying the individual components of the model.
A Model of the Components of Per Capita Expenditures
Factors contributing to changes in per capita expenditures on prescription drugs (PERCAP) that are readily observable using administrative databases include the pattern of exposure to pharmacologic treatment by therapeutic category (EXPOSURE); the quantity and type of drugs used from within therapeutic categories (DRUGMIX); the level of generic drug product selection (GENERICS); and the prices paid for the drug products purchased (PRICES).
Although population aging may appear to be a primary determinant of drug spending, empirical evidence suggests that it plays only a minor role—especially within the elderly cohort. Evans and colleagues showed that aging among the seniors cohort in British Columbia explained less than 2 percent of the change in per capita prescription drug expenditures between 1985 and 1999 (Evans et al. 2001). This is consistent with the findings in Belgium (Van Tielen, Peys, and Genaert 1998). For parsimony, the aging-related changes in prescription drug utilization are accounted for in the present analysis in the overall measure of change in exposure to drug treatments by therapeutic category.
The kind of treatment sought through the use of prescribed drugs may be inferred (albeit imperfectly) from the primary indication of the drugs purchased. For example, whether a patient uses ibuprofen, naproxen, or another nonsteroidal anti-inflammatory drug, the pharmacologic outcomes of interest are similar on average: analgesic and/or anti-inflammatory action. As has been done elsewhere to measure the incidence and cost of chronic illness (Mehl 1984; Mueller, Schur, and O'Connell 1997; Dubois et al. 2000; Schneider Institute for Health Policy 2000; Steinberg et al. 2000), exposure to one or more products within various therapeutic categories (EXPOSURE) may be used as an indication of the need (or at least demand) for the corresponding types of pharmacologic therapy.
Episodes of exposure to therapies so defined, rather than the number of pills and tablets of individual drugs purchased, become the “utilization” measure of interest in this form of drug spending analysis. An increase in the rate of exposure to a given therapeutic category of drugs may indicate an increase in the prevalence of underlying conditions potentially amenable to such therapy, an increase in the rate of pharmacological treatment for the underlying conditions, or both. Included in the latter possibilities would be the effect of technological improvement: e.g., the introduction of a new drug offering outcomes sufficiently superior to be attractive to patients previously not offered or refusing treatment with like-classified drugs.
A single patient may receive drugs from several therapeutic categories, and thus be counted in the “exposure” rates for each of those categories. Conversely, a given patient may receive multiple drugs from a therapeutic category, but be counted as having just one exposure to that category of treatment. The aggregate profile of exposure to drug treatments by therapeutic category will be influenced by both the absolute rate of exposure to courses of drug therapy—the average number of therapeutic categories from which patients receive drugs—and the pattern of categories from which patients receive treatment—the relative rate at which patients receive one category of therapy over another.
Changes in the drugs used per episode of treatment—that is, changes in the relative quantities of drugs used within therapeutic categories (e.g., a trend from ibuprofen to naproxen)—will not necessarily change a therapeutically-based measure of utilization. When a patient is switched from one drug (or a combination of drugs) within a given therapeutic category to another drug (or combination) within the same category, this reflects a change in the mix of drug products used to seek the same general therapeutic goal. Such changes in the mix of drugs used within a therapeutic category, (DRUGMIX), are the most difficult dynamics to account for in aggregate drug spending analyses.
In and of themselves, changes within therapeutic categories do not alter the real quantity of drug treatment received by a population. They may, however, influence the quality of treatment received per therapeutic episode, the average cost per therapeutic episode, or both. If health outcomes expected from treatment remain constant, changes in prescribing patterns within therapeutic categories may reasonably be interpreted as a form of de facto price change. If, for example, more costly drugs replace less costly alternatives without improving therapeutic outcomes, the side effects profile, or any other substantive aspect of the quality of the episode of care, then more money is spent to obtain the same (or even a lesser) “quantity” of desired health effects. When changes in the mix of products used within a therapeutic category improve therapeutic outcomes, these changes may be considered a de facto quantity change by way of improved outcomes per episode of treatment. Changes in the mix of drugs selected within therapeutic categories are likely to include some de facto price changes and some de facto quantity changes, making the task of disaggregation particularly complex.
A special case of substitutions within therapeutic classes is the use of generic drug products. The selection of generic products is a special form of substitution because the drug dispensed (in terms of chemical ingredient, strength, and dosage form) does not change—simplifying the task of determining whether generic substitution represents a de facto price change and/or a de facto quantity change. The impact of switching from brand name to generic drug products (GENERICS) will generally be one of reducing the cost of treatment without altering effectiveness. Changes in the actual price paid for individual drug products (branded or generic) will, on the other hand, have a direct impact on costs regardless of whether the product is branded or generic. These changes in “sticker” prices are accounted for by standard price indexes (PRICES). They are “pure” price effects.
The multiplicative interaction of the factors just described determines per capita prescription drug expenditures in any given period (t):
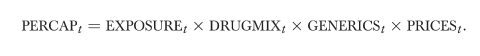 |
Other things being equal, per capita expenditures will rise with an increase in the rate of exposure to courses of pharmacological treatment, a decrease in utilization of generic products, or an increase in the price paid for the products purchased. Per capita costs will also move in proportion to the relative cost of drugs chosen for treatment regimens. Changes in the mix of drugs used per episode of treatment may be interpreted as de facto price or utilization effects depending on whether resulting changes in therapeutic outcomes are in proportion to the impact on costs.
Methods
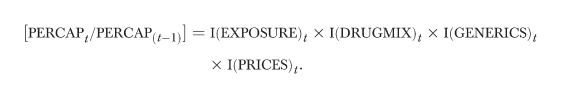
This model may be brought to empirical life using indexes that capture the contribution of each component of the total change in per capita expenditures. Each index, I(“COMPONENT”)t, quantifies the relative change in per capita costs that stems from allowing only the specified component to change between periods. (Complete details regarding the indexes can be found in the appendix.) An index will be equal to 1.0 when the component is unchanged between periods or when its change has no impact on expenditures per capita. The index will be less than 1.0 when changes in the expenditure component contribute to a decline in costs per capita, and greater than one when changes contribute to cost increases. The product of the indexes will equal the total change in expenditures per capita:
 |
Data
The data used in this study were extracted from 73.5 million prescription claim records, one for every prescription dispensed to beneficiaries of the British Columbia Pharmacare Plan A between 1985 and 1999 inclusive. Each observation describes the transaction date, quantity, cost, and type of drug purchased by an individual covered under the Plan. The data used in this study represent the actual acquisition cost to the pharmacist of the prescription drug products, and exclude dispensing fees.
The Pharmacare Plan A is a tax-financed public drug plan that covers all community-dwelling British Columbia residents who are 65 years of age and older. Beneficiaries are insured for the ingredient costs of prescription medicines. However, Pharmacare implemented an incentive pricing policy for generic substitutions in 1994 and therapeutic reference pricing policies in 1995 and 1997. Under these policies, Pharmacare reimbursed the dispensing pharmacy only for the ingredient cost of the referenced products (e.g., a generic drug). Except where the prescribing physician requested and received special authority, the patients were responsible for the difference between the ingredient cost of the product prescribed and that of the referenced drug. The administrative data track all components of the ingredient cost of drugs purchased, including the portion paid by Pharmacare and “top-ups” by patients who did not qualify for full coverage of non-reference products. By 1999, out-of-pocket costs associated with patient top-ups accounted for only three percent of total drug costs under the Pharmacare plan. The impacts of the generic substitution and reference pricing policies are discussed further later in this article.
The administrative database used facilitates the implementation of this expenditure model by allowing one to track a patient's utilization of medicines within and across categories. When transaction data do not uniquely identify the prescription's recipient, it is impossible to determine whether changes in the quantity of drug products purchased reflect changes in the rate of exposure to drug therapy or changes in the mix and quantity of drugs used by patients already receiving therapy.
In order to track patients' exposure to various types of drug treatment, therapeutic categories were defined according to the American Hospital Formulary Service (AHFS) Pharmacologic-Therapeutic Classification System. This coding system assigns each drug a code that is arranged hierarchically. Codes beginning with successively more matched digits belong to successively more detailed therapeutic subclasses. For example, drug codes beginning with 28 all belong to the broad category of “Central Nervous System Agents”; those beginning with 28-08 belong to the category of “Analgesics and Antipyretics”; and those beginning with 28-08-04 belong to the category of “Nonsteroidal Anti-Inflammatory Agents.” This analysis uses the classifications at the six-digit level, which define the narrowest therapeutic categories involving chemically distinct products. Drugs purchased under the Pharmacare plan fall into 206 such six-digit-defined therapeutic subclasses.1 A patient was considered “exposed” to a type of therapy—for example, that of Nonsteroidal Anti-Inflammatory Agents—if she or he had one or more prescriptions dispensed for one or more products from within that therapeutic category. A single patient could be “exposed” to several therapeutic categories, and thus counted in the exposure rates for each of those categories.
Pharmacare uses a nine-digit coding system that uniquely identifies products certified to be chemically equivalent by Health Canada. This coding system facilitates the analysis of changes in the rate of generic utilization for multisource drugs. Approximately half of the drug products available over the period of study were not subject to generic competition. Savings attributable to changes in the rate of generic utilization were calculated for each multisource category and aggregated according to the index formula found in the appendix.
Results
Adjusted to constant 1999 dollars using the Canadian consumer price index to reflect the change in general buying power, expenditures per senior grew from $49 to $136 per quarter over the period of study.2 The contributions of the four components of the expenditure model described above are summarized, in terms of impact on quarterly costs per capita, in Table 1. Changes in drug prices, treatment exposure, and drug mix all caused spending per capita to increase. Combined, these changes would have increased costs to $150 per capita were it not for a savings of $14 per capita attributable to increased utilization of generic drugs. Increased utilization of generics can, in turn, be attributable to a generic substitution policy discussed below.
Table 1.
Financial Impact of Expenditure Components between 1985 and 1999: Relative to a Baseline of $49 per Capita per Quarter in 1985
| Impact on Drug Costs | Share of Cost Increases | |
|---|---|---|
| EXPOSURE | +$39 per capita | 38% |
| DRUGMIX | +$40 per capita | 40% |
| PRICES | +$22 per capita | 22% |
| GENERICS | −$14 per capita | |
| Total Change | +$87 per capita |
Sticker price increases—which are what would traditionally be tracked with ordinary consumer price indexes—accounted for a per capita increase of $22 over the period of study. Changes in exposure to drug treatment, defined by the use of one or more drugs from the various AHFS therapeutic categories, contributed $39 to the overall increase in inflation-adjusted per capita costs (38 percent of total increase). This change was due to changes in the rate and pattern of exposure to drug treatments. In 1985, the average senior in British Columbia received drugs from 1.73 therapeutic categories, whereas the average senior received drugs from 2.09 therapeutic categories in 1999. In addition to this increase in the “absolute” exposure to drugs from multiple therapeutic categories, there were some changes in the profile of therapeutic categories that seniors received drugs from—wherein exposure to some categories of drug treatment (especially lipid lowering agents) grew more rapidly than exposure to others.
Excluding the $14 per capita savings due to increased generic utilization, changes in mix of drugs used within therapeutic categories contributed $40 to per capita drug costs (40 percent of inflationary pressures). This captures the cost-impact of increases in the volume of drugs dispensed per patient receiving treatment from each therapeutic category—more days of treatment per quarter or higher daily doses—as well as changes in the proportions of different drugs dispensed from each category. Changes in the mix of drugs used within the categories of lipid lowering drugs, gastrointestinal agents (dominated by ulcer remedies), and antidepressants had the most significant impact on the aggregate measure of DRUGMIX. In each of these therapeutic categories, changes in the mix of drugs used per episode of treatment was sufficient to more than double the cost of treatment over the period of analysis—holding constant the rate of generic drug product selection and the price of drug products purchased within those categories. Since many of the drugs that came to dominate these therapeutic categories over the period of study have recently come off patent (or are soon to do so), there is potential for significant cost savings from generic substitution unless still newer, patented products replace them.
Variations in the trends of each of the four components of expenditure change illustrate the impact of policies aimed at altering specific determinants of drug inflation. To illustrate trends, accumulated indices for each expenditure component are plotted in Figure 1. The level of each line in the figure indicates the percentage change in expenditures that would be due to changes in the specified component of the expenditure model vis-à-vis the baseline per capita drug costs of $49—observed in the first quarter of 1985—holding all other components of the model constant. For example, indexes describing the cost impact of changes in drug product prices, drug mix, and therapeutic exposure had all grown approximately 50 percent by 1992Q1. This implies that changes in any one of these components of the expenditure model were sufficient to make the 1992Q1 per capita drug costs 50 percent higher than costs in 1985Q1.
Figure 1.

Accumulated Changes in Expenditure Component Indexes BC Pharmacare Plan A 1985Q1 to 1999Q4
Consistent with findings at a national level in Canada (Patented Medicine Prices Review Board 2000; Canadian Institute for Health Information 2001), the price index for drugs purchased under the Pharmacare plan grew steadily until 1993, at which time drug prices stopped increasing, and indeed decreased slightly through to 1999. Although this slow-down is coincident with the implementation of Canadian regulations restricting price movements for patented drugs to a rate no faster than general inflation (Patented Medicine Prices Review Board 1989), observed price changes have consistently been below the allowable rate since the regulations took effect—implying that the regulations were not a binding constraint on a majority of drug prices. Given that price changes for pharmaceuticals also slowed significantly in the United States during the mid- to late 1990s—for seniors and the population as a whole (Berndt et al. 1998)—it appears that the trend observed in Canada may simply reflect a North American trend.
Increased generic drug utilization under the Pharmacare plan—due to new generic entrants and more frequent use of existing generics—caused a steady de facto rate of price decline for multisource products over the period. As can be seen in Figure 1, the GENERICS index fell steadily over time. The average quarterly decline in the generics index was 0.4 percent between 1985 and 1999. A one-time change in this trend—wherein when it fell by 5 percent in the second quarter of 1994—captures the impact of a generic substitution policy implemented by Pharmacare.
Prior to 1994, the Pharmacare program reimbursed pharmacies for generic and brand name drugs according to actual acquisition costs plus dispensing fees (which were paid by the patient). Under this reimbursement scheme, pharmacists, like patients and doctors, had little incentive to consider the savings associated with generic drug use; generic drug use was consequently low in British Columbia (Grootendorst et al. 1996). To increase the incentive for pharmacists (and, more specifically, patients) to consider generic alternatives, the Low Cost Alternative program was implemented in April 1994. This incentive pricing policy limited the pharmacy's reimbursement to the average ingredient cost of competing generic suppliers. Pharmacare would only provide full reimbursement for the cost of a brand name drug if the prescribing physician requested special authority to use the brand on medical grounds. Patients preferring a more costly brand name version without medical reason were required to pay the cost difference between that and the generic equivalent. Both patient “top-ups” and medical exemptions were exceedingly rare; thus, the Low Cost Alternative program substantially increased the utilization of available generic drugs under the Pharmacare program (Grootendorst et al. 1996).
One-time changes in the trend of the product-mix index are coincident with other policy changes. For example, the cost-impact in 1987Q1–1987Q2 captured by the DRUGMIX index reflects Pharmacare's implementation of a copayment on dispensing fees. Beginning in 1987, patients were required to pay 75 percent of dispensing fees (to become 100 percent in 1994) up to a maximum of $200 per year. This appears to have induced a slight “gaming” of the system wherein patients—presumably those with chronic conditions—stocked up on medicines just before the policy change. The DRUGMIX variable captures this because it accounts for the cost-impact of increases in the volume of drugs dispensed from with a therapeutic category—more days of treatment or higher daily doses—as well as changes in the proportions of different drugs dispensed from that category.
Later, Pharmacare implemented reference pricing policies for several selected categories of drugs—gastric acid suppression drugs, nitrate patches, and nonsteroidal anti-inflammatory drugs in October/November 1995; and dihydropyridine calcium channel blockers, and angiotensin converting enzyme inhibitors in January 1997. The DRUGMIX index fell 8.3 and 5.4 percent in the first quarters following each of these policy changes; whereas the average first quarter fall in the drug mix index was only 1.6 percent more than the period from 1985 to 1999.3 That changes in product mix are associated with declining drug costs during these periods is consistent with the finding that reference pricing policies influenced product choices within therapeutic categories, resulting in significant savings to the Pharmacare program (Narine, Senathirajah, and Smith 1999; Grootendorst et al. 2001). The reference-based pricing policies did not appear to influence drug utilization as measured by exposure to drugs across pharmacologic categories; this is evidenced by the steady upward trend in the EXPOSURE index between 1995 and 1999.
Sensitivity to Therapeutic Categorizations
The interpretation of results of an analysis based on therapeutic classifications will depend on how the categories are defined. Placing drugs with common indications in different therapeutic categories will portray substitutions between those drugs as changes in therapeutic exposure. This is because the measure of the EXPOSURE component of changes in drug expenditures accounts for the cost-impact of not only changes in the absolute rate of exposure to drugs from various categories, but also the relative pattern of exposure to drugs across therapeutic categories. Thus, the substitution between products assigned to different therapeutic categories appears as a change in the pattern of treatments sought through drug consumption, rather than a change in the mix of drugs used to achieve similar treatment objectives. If products are commonly used to treat similar indications but are wrongfully placed in different treatment categories, the analysis will overstate “utilization effects” through the inflated EXPOSURE component of expenditure change and understate de facto price effects stemming from changes in the mix of drugs used to achieve similar therapeutic ends. Conversely, grouping together products used to treat dissimilar conditions may cause potential price effects to be overstated in the DRUGMIX component, while understating changes in utilization as per the pattern of exposure to various drug treatments.
As a means of illustrating the sensitivity of results to therapeutic categorizations, the results of the six-digit AHFS coding system breakdown (with 206 categories) were compared with an analysis of a 48-category breakdown of therapeutic categories. The 48 categories were defined to be similar to the categories used in other studies wherein exposure to drugs is employed as a marker for chronic illnesses—specifically, those used by Clark and colleagues and by Steinberg and colleagues (Clark et al. 1995; Steinberg et al. 2000). Constructing these categories involved “splitting” some of the six-digit AHFS categories into separate groups, while “merging” other categories in order to comply with the classifications used by Clark and by Steinberg.
Using the 48 categories as the basis for analysis, the results imply that per capita costs would have risen 59 percent due to observed changes in exposure to the 48 categories of drug treatment over the period of study—holding all other components of expenditure inflation constant. That is, the EXPOSURE index would have risen to 1.59. The comparable EXPOSURE index was 1.77—implying a per capita expenditure change of 77 percent—when the 206 categories of the six-digit AHFS coding system were used. A majority of the difference in these findings is not attributable to the absolute rate of exposure to different categories of drug treatments (though the six-digit AHFS coding system has about four times as many therapeutic categories to be exposed to), but to the relative pattern of treatments across therapeutic categories. Most of this difference is explained by changes in the relative rate at which patients received various hypertension drugs.
Drugs commonly indicated for the treatment of hypertension—diuretics, beta-blockers, calcium-channel blockers, and ACE-inhibitors—are found in three different therapeutic categories in the six-digit AHFS coding system. Using the AHFS categories, changes in relative utilization rates for diuretics versus calcium channel blockers, for example, appear as a change in the exposure to drug treatment across therapeutic classes because these products are in distinct AHFS categories. However, because these medicines were grouped together by Clark and colleagues as “hypertension drugs,” and by Steinberg and colleagues as “non-arrhythmia cardiovascular drugs,” they were combined into one category for the 48-category analysis. With this categorization, changes in the relative rate of their use appear as a change in the mix of drugs used to attain similar therapeutic ends.
Despite clinical evidence and national guidelines recommending otherwise (Flack and Cushman 1996; Psaty et al. 1997; Wright 2000), the rate at which patients used diuretics and beta-blockers fell over the course of the study. At the same time, the use of newer hypertensives increased substantially. Trends similarly inconsistent with recommended protocol have been found in studies of hypertensive prescribing in other jurisdictions (McAlister et al. 1997; Siegel and Lopez 1997; Siegel 2000; Bourgault, Rainville, and Suissa 2001), as well as in a detailed analysis of trends in first-line hypertensive prescribing in British Columbia (Maclure et al. 1998). Since hypertension is the most common diagnosis leading to a prescription in Canada (the drugs in the treatment of which account for 30 percent of the Pharmacare budget) and since the daily cost of therapy with the newer classes of hypertension treatment is several times (sometimes hundreds of times) more expensive than treatment with diuretics or beta-blockers, the substitution dynamics have significant financial impacts (Morgan 2001).
When substitution patterns among antihypertensives are normalized so that they affect both indexes in the same manner,4 the change in per capita costs attributable to changes in exposure to drugs by therapeutic category is 75 percent with the 48-category analysis and 77 percent with the 6-digit AHFS categories. Thus, with the exception of drugs typically used in the treatment of hypertension, most of the “substitutions” observed over the period of analysis occurred within the therapeutic categories defined by six-digit AHFS codes.
If the 48-category analysis were retained—and the trends in hypertensive use were included as substitutions within therapeutic categories (rather than across)—a $32 increase in costs per capita would be attributed to changes in seniors' exposure to drug treatments by therapeutic category, and a $47 increase would be attributed to changes in the mix of products used within categories. This compares to the findings reported above, where a $39 increase in costs per capita were attributed to changes in seniors' exposure to drug treatments by therapeutic category, and a $40 increase was attributed to changes in the mix of products used within categories.
No therapeutic classification system is perfect—particularly considering the propensity for one drug to be prescribed for a variety of illnesses. The six-digit AHFS code groupings appear to suffer a significant weakness insofar as they place commonly used antihypertensive drugs in three different therapeutic categories. These classifications are retained, however, as a bias against overaccounting for changes in product mix within other therapeutic categories. It is unlikely that potential bias stemming from such intratherapeutic category substitutions will be greater than the bias stemming from the intertherapeutic category substitutions for the treatment of hypertension. Further research might fruitfully be directed at developing a hierarchy of therapeutic categories that progressively break down into even finer submarkets to determine substitutions among successively more narrow categories of drug treatment. Such an analysis may be useful to benefits providers looking for indications of potential savings from formulary restrictions, which tend to apply only to very narrow categories of drugs.
Conclusion
This study used indexes to quantify factors that contributed to changes in per capita prescription drug expenditures for British Columbian seniors over the period from 1985 to 1999. One such index was a relatively standard measure of the change in the price of drug products consumed. Consistent with commonly cited national statistics, changes in prices charged for drug products purchased under the British Columbia Pharmacare Plan were relatively small over the period of analysis (especially in the mid-1990s), contributing modestly to the overall change in per capita drug costs. Common methods for analyzing drug expenditure trends conclude that whatever is not explained by these “pure” price changes must be a reflection of increased “utilization,” directly through increased quantity of pills and tablets purchased, and indirectly through the purchased of newer, more costly medicines. This analysis disaggregates drug expenditure trends further. Based on a model wherein exposure to episodes of pharmacologic treatment form the basis for measuring “pure” utilization, indexes were calculated to account for the cost-impact of changes in the exposure to categories of therapeutic treatments, the mix of drugs used within therapeutic categories, and the rate of generic drug product selection.
Using 206 therapeutic categories defined by the AHFS classification system, the exposure-based measure of pharmaceutical utilization increased steadily over the period under analysis, contributing significantly to per capita expenditure inflation. The impact of therapeutic exposure-based utilization was less than that which would be inferred by a standard measure of utilization based on the purchase of individual drug products (pills, tablets, etc.). This difference stems from changes in the selection of products and suppliers within therapeutic categories. These dynamics may be interpreted as de facto price or utilization effects.
Included among such intratherapeutic category changes are substitutions between suppliers of chemically identical drug products: that is, the selection of brands or generics. The rate of generic drug use increased over the period of analysis, generating modest savings that can be interpreted as a form of de facto price change. After accounting for changes in generic utilization, changes in the mix of drugs used within therapeutic categories caused a steady increase in the per capita drug costs. Changes in drug mix among the 206 categories of drug treatment identified here were sufficient to nearly double drug costs per capita under the British Columbia Pharmacare Plan for seniors.
One purpose for aggregate drug spending analysis is to identify target areas for further research and to indicate areas for potential policy intervention. The results of this study suggest that substitutions among products within therapeutic categories are significant cost drivers that deserve further scrutiny. There is little doubt that many seniors received better drug treatment in 1999 than would have been available to them in 1985, implying that some of the changes in product selection within therapeutic classes reflect a de facto increase in utilization—by way of improved quality per episode of treatment. The question remains, however, whether the average quality of care per episode of pharmacologic treatment increased in proportion to the increase in costs per episode of care. Some of the expenditure inflation stemming from product substitutions within therapeutic categories may have been a form of de facto price inflation that could benefit from policy intervention. A focused approach for further research may be to assess trends against guidelines for cost-effective prescribing in high-volume therapeutic categories such as hypertension drugs, gastrointestinal drugs, lipid lowering agents, and antidepressants. Made possible by the nonstandard financial incentives of patients and prescribers, inefficient drug selection within such categories has the potential to drive the cost of therapy more rapidly than is indicated by changes in the prices of individual drug products themselves. If this form of disguised “inflation” could be controlled, ensuring access to medically necessary, cost-effective pharmacotherapy may be more affordable than standard analyses of prescription drug expenditures would make it appear.
Appendix
Index Formulae
The indexes computed in this study describe the changes in expenditures between two periods: a base period (t−1) and a current period (t). The length of time between periods is one quarter of a year (three months). The product of successive quarterly indexes describes the accumulated change over those periods—a process known as “chaining” the index. Thus, the accumulated change from one year to the next is the product of four quarterly “links” in the one-year chain.
The mathematical formulae for the indexes used in this analysis take the form of Fisher's Ideal index—which is the geometric mean of the more widely used Laspeyres and Paasche indexes. Fisher's formula is used so that the equation describing the multiplicative relationship between components of expenditure inflation (see the methods section) will satisfy the “adding up” or “factor reversal” test (Diewert 1993). That is, the product of the four indexes describing the cost-impact of the four components of expenditure inflation will exactly equal the change in total expenditures per capita in the relevant period. Though the Paasche or Laspeyres formulae do not satisfy this desirable property, their calculation is more intuitive than that of Fisher's formula.
An index based on the Laspeyres formula reports the relative change expenditures due to changes in one variable, while all others are held at their base level. Consider the Laspeyres index as a “forward looking” device that asks how things would change from the perspective of the base period. An index based on a Paasche formula reports the relative change expenditures due to changes in one variable, while all others are held at their current level. Its comparison is “backward looking” describing how different things would be if one variable returned to yesterday's levels.
In this analysis, the Laspeyres index reports the relative change in per capita costs that would stem from the change in one component of expenditures, while the other three are kept at their base period levels. For example, the Laspeyres index for the effect of changes in the profile of drug treatment exposure takes the following form:
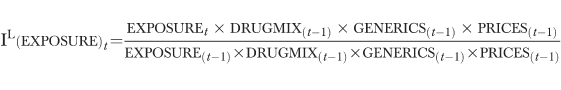 |
In words, this index reports how much more or less it would have cost in the last period if patients were exposed to the different categories of treatment at this period's rates.
The Paasche-style index is similarly calculated, holding all variables at the current period levels, and allowing the component of interest to change:
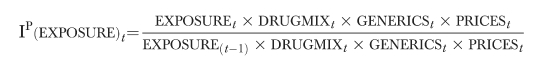 |
This index reports how much more or less costs are in this period as opposed to what they would have been if patients were exposed to the different categories of drug treatment at last periods' rates. The index in its desired form—the Fisher-style index—is the geometric mean of the Paasche and Laspeyres style indexes: for example,
Because the Laspeyres and Paasche indexes are linear sums, the formulae for each variable can be reduced to a reasonably parsimonious form. Laspeyres-style indexes are discussed here; the extension to Paasche and Fisher styles is trivial.
The PRICES index used in this analysis is mathematically equivalent to a standard price index for all drug purchases,
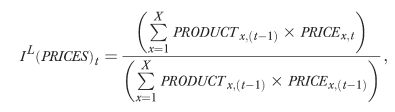 |
where the number of drug products on the market, X, includes all brand and generic versions of drugs sold across all therapeutic categories. New (disappearing) goods are linked into (out of) the price index in a manner that does not capture any implicit price changes stemming from changes in product variety. Specifically, the goods are linked into the Paasche index using reservation prices equal to their launch price; exiting products are linked out of the Laspeyres index using a reservation price equal to their exit price. All implicit price effects stemming from changing product variety will therefore be captured by the product mix index.
The GENERICS index captures the impact of switching between brand and generic versions of the same (chemically equivalent) drug. This index is the weighted average change in the share of markets held by brand name drug products, where the weights correspond to the relative unit cost of the brand vis-à-vis generic competitors.
 |
The number of drug types, N, will be smaller than the number of products, X, since many categories have brand and generic competitors. COSTn is the average unit cost of the nth drug. For drugs with no generic versions, the brand share and relative price are one, and the unit cost is simply the brand price. When generics exist, the relative price of brands is typically greater than one. Thus, a decrease in the share of markets held by brand name drug products (due, e.g., to generic entry) will result in a decrease in the index—implying that costs are declining. The product of the PRICES and the GENERICS indexes is equal to a drug price index that tracks changes in the unit price of chemically equivalent products by strength, dose, and dosage form (Morgan 2000).
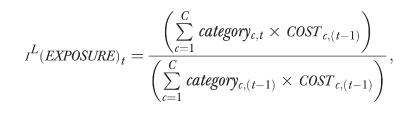
The formula for the EXPOSURE index is as follows:
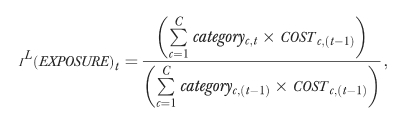 |
where categoryc represents the percentage of the population exposed to treatment from the cth drug category, and COSTc,(t−1) is the average base-period costs per person receiving drugs from the cth therapeutic category.
The index that captures the cost-impact of changing mix of drugs used within therapeutic category, the DRUGMIX index, is based on the following formula:
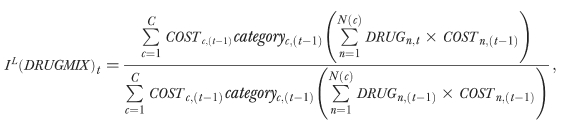 |
where the categoryc is the exposure rate to the cth category of drugs; DRUGn is the number of units of the nth drug purchased within the category; N(c) defines the number of drugs within the cth category; and COSTn is the unit cost of the nth drug—taking into account the implicit savings associated with generic utilization.
Notes
Files containing Pharmacare's drug coding system are available online from the Ministry of Health: http://www.moh.hnet.bc.ca/pharme.
The population of seniors in British Columbia grew from 345,000 to 518,000 over the same period.
There is a pronounced seasonal pattern in Pharmacare Plan A claims, with first quarter costs per episode of treatment being lower than other quarters. This may reflect patients “stocking up” at years' end, in response to the annual limit on dispensing fee copayments.
This normalization involved substituting the change in costs of antihypertensive therapy as per six-digit AHFS code groupings for the value in the aggregated category of nonarrhythmia cardiac drugs used in the 48-category analysis.
This research was supported in part by a Post-doctoral Fellowship from the Canadian Institutes of Health Research. Data access was arranged through the Centre for Health Services and Policy Research, UBC, with permission of the British Columbia Ministry of Health and Ministry Responsible for Seniors.
References
- Anonymous. Cost Overdose: Growth in Drug Spending for the Elderly 1992–2010. Washington DC: Families USA; 2000. [Google Scholar]
- BC Pharmacare. Pharmacare Newsletter: Victoria British Columbia; 2001. [December 7 2001]. “Pharmacare Coverage Changes”. http://www.healthservices.gov.bc.ca/pharme/newsletter/01015news.pdf. [Google Scholar]
- Berndt ER, Cockburn I, Cocks DL, Epstein AM, Giliches Z. “Prescription Drug Prices for the Elderly.”. Monthly Labour Review. 1998;(September):23–34. [Google Scholar]
- Berndt ER, Cutler DM, Frank RG, Griliches Z, Newhouse JP, Triplett JE, Culyer AJ, Newhouse JP. “Medical Care Prices and Output.”. In: Culyer AJ, Newhouse JP, editors. Handbook of Health Economics. Vol. 1. Amsterdam: Elsevier Science; 2000. pp. 119–80. [Google Scholar]
- Bourgault C, Rainville B, Sousa S. “Antihypertensive Drug Therapy in Saskatchewan: Patterns of Use and Determinants in Hypertension.”. Archives of Internal Medicine. 2001;161(15):1873–9. doi: 10.1001/archinte.161.15.1873. [DOI] [PubMed] [Google Scholar]
- Canadian Institute for Health Information. Drug Expenditures in Canada 1985–2000. Ottawa: Canadian Institute for Health Information; 2001. [Google Scholar]
- Clark DO, Von Korff M, Saunders K, Baluch WM, Simon GE. “A Chronic Disease Score with Empirically Derived Weights.”. Medical Care. 1995;33(8):783–95. doi: 10.1097/00005650-199508000-00004. [DOI] [PubMed] [Google Scholar]
- Diewert WE. “The Economic Theory of Index Numbers: A Survey.”. In: Diewert WE, Nakamura AO, editors. Essays in Index Number Theory. Vol. 1. Amsterdam: Elsevier Science; 1993. [Google Scholar]
- Dubois RW, Chawla AJ, Neslusan CA, Smith MW, Wade S. “Explaining Drug Spending Trends: Does Perception Match Reality?”. Health Affairs (Millwood) 2000;19(2):231–9. doi: 10.1377/hlthaff.19.2.231. [DOI] [PubMed] [Google Scholar]
- Evans RG, McGrail KM, Morgan SG, Barer ML. “APOCALYPSE NO: Population Aging and the Future of Health Care Systems.”. Canadian Journal on Aging. 2001;20(Supplement 1):160–91. [Google Scholar]
- Flack JM, Cushman WC. “Evidence for the Efficacy of Low-Dose Diuretic Monotherapy.”. American Journal of Medicine. 1996;101(3A):53S–60. doi: 10.1016/s0002-9343(96)00268-9. [DOI] [PubMed] [Google Scholar]
- Grootendorst PV, Goldsmith L, Hurley J, O'Brian B, Dolovich L. Financial Incentives to Dispense Low Cost Drugs: A Case Study of British Columbia Pharmacare. Hamilton ON: McMaster University; 1996. [Google Scholar]
- Grootendorst PV, Dolovich LR, O'Brian B, Holbrook AM, Levy AR. “Impact of Reference-Based Pricing of Nitrates on the Use and Costs of Anti-Anginal Drugs.”. Canadian Medical Association Journal. 2001;165(8):1011–19. [PMC free article] [PubMed] [Google Scholar]
- Health Care Financing Administration. National Health Expenditures. Washington DC: Health Care Financing Administration; 2000. [Google Scholar]
- Maclure M, Dormuth C, Naumann T, McCormack J, Rangno R, Whiteside C, Wright JM. “Influences of Educational Interventions and Adverse News about Calcium-Channel Blockers on First-Line Prescribing of Antihypertensive Drugs to Elderly People in British Columbia.”. Lancet. 1998;352(9132):943–8. doi: 10.1016/S0140-6736(97)11390-3. [DOI] [PubMed] [Google Scholar]
- McAlister FA, Teo KK, Lewanczuk RZ, Wells G, Montague TJ. “Contemporary Practice Patterns in the Management of Newly Diagnosed Hypertension.”. Canadian Medical Association Journal. 1997;157(1):23–30. [PMC free article] [PubMed] [Google Scholar]
- Medicare Payment Advisory Committee. Report to Congress: Selected Medicare Issues. Washington DC: Medicare Payment Advisory Committee; 2000. [Google Scholar]
- Mehl B. “Indicators to Control Drug Costs in Hospitals.”. American Journal of Hospital Pharmacology. 1984;41(4):667–75. [PubMed] [Google Scholar]
- Merlis M. Washington DC: Department of Health and Human Services Conference on Pharmaceutical Pricing Practices; 2000. “Explaining the Growth in Prescription Drug Spending: A Review of Recent Studies”. Utilization and Costs August 8-9 2000. [Google Scholar]
- Morgan SG. Ph.D. diss., University of British Columbia; 2000. “Pharmaceutical Sector Price and Productivity Measurement: Exploring the Roles of Agency Incentives and Information.”. [Google Scholar]
- Morgan SG. Productivity Measurement in a Pharmaceutical Sub-Sector: The Real Cost of Treating Hypertension. Vancouver British Columbia: UBC Centre for Health Services and Policy Research; 2001. [Google Scholar]
- Morgan SG. “Statistics and Drug Utilization: Are Prescribing Rates Really That High?.”. Canadian Medical Association Journal. 2001;165(11):1507–8. [PMC free article] [PubMed] [Google Scholar]
- Mueller C, Schur C, O'Connell J. “Prescription Drug Spending: The Impact of Age and Chronic Disease Status.”. American Journal of Public Health. 1997;87(10):1626–9. doi: 10.2105/ajph.87.10.1626. [DOI] [PMC free article] [PubMed] [Google Scholar]
- Mullins CD, Wang J, Palumbo FB, Stuart B. “The Impact of Pipeline Drugs on Drug Spending Growth.”. Health Affairs (Millwood) 2001;20(5):210–15. doi: 10.1377/hlthaff.20.5.210. [DOI] [PubMed] [Google Scholar]
- Narine L, Senathirajah M, Smith T. “Evaluating Reference-Based Pricing: Initial Findings and Prospects.”. Canadian Medical Association Journal. 1999;161(3):286–8. [PMC free article] [PubMed] [Google Scholar]
- National Institute for Health Care Management. Factors Affecting the Growth of Prescription Drug Expenditures. Washington DC: National Institute for Health Care Management Foundation; 1999. [Google Scholar]
- Noonan D, Raymond J, Gesalman A. “Why Drugs Cost So Much.”. Newsweek. 2000;136(13):22–8. [PubMed] [Google Scholar]
- Organization for Economic Cooperation and Development (OECD) OECD Health Data 2000 CD-ROM. Paris: OECD; 2001. [Google Scholar]
- Patented Medicine Prices Review Board. Patented Medicine Prices Review Board: First Annual Report. Patented Medicine Prices Review Board; 1989. [Google Scholar]
- Patented Medicine Prices Review Board. Patented Medicine Prices Review Board: Annual Report 1999. Ottawa ON: Patented Medicine Prices Review Board; 2000. [Google Scholar]
- Pharmaceutical Research and Manufacturers of America. Why Do Prescription Drugs Cost So Much? Washington DC: Pharmaceutical Research and Manufacturers of America; 2000. [Google Scholar]
- Psaty BM, Smith NL, Siscovick DS, Koepsell TD, Weiss NS, Heckert SR, Lemaitre RN, Wagner EH, Furberg CD. “Health Outcomes Associated with Antihypertensive Therapies Used as First-Line Agents A Systematic Review and Meta-analysis.”. Journal of the American Medical Association. 1997;277(9):739–45. [PubMed] [Google Scholar]
- Schneider Institute for Health Policy. Prescription Drug Expenditures Increase by More Than 24 Percent. WalthamMA: Schneider Institute for Health PolicyBrandeis University; 2000. [Google Scholar]
- Siegel D. “The Influence of National Guidelines on Antihypertensive Prescribing Patterns.”. Current Hypertension Reports. 2000;2(3):247–52. doi: 10.1007/s11906-000-0007-1. [DOI] [PubMed] [Google Scholar]
- Siegel D, Lopez J. “Trends in Antihypertensive Drug Use in the United States: Do the JNC V Recommendations Affect Prescribing? Fifth Joint National Commission on the Detection Evaluation and Treatment of High Blood Pressure.”. Journal of the American Medical Association. 1997;278(21):1745–8. doi: 10.1001/jama.278.21.1745. [DOI] [PubMed] [Google Scholar]
- Soumerai SB, Ross-Degnan D, Fortess EE, Abelson J. “A Critical Analysis of Studies of State Drug Reimbursement Policies: Research in Need of Discipline.”. Millbank Quarterly. 1993;71(2):217–52. [PubMed] [Google Scholar]
- Steinberg EP, Gutierrez B, Momani A, Boscarino JA, Neuman P, Deverka P. “Beyond Survey Data: A Claims-Based Analysis of Drug Use and Spending by the Elderly.”. Health Affairs. 2000;19(2):198–211. doi: 10.1377/hlthaff.19.2.198. [DOI] [PubMed] [Google Scholar]
- Tamblyn R, Laprise R, Hanley JA, Abrahamowicz M, Scott S, Mayo N, Hurley J, Grad R, Latimer E, Perreault R, McLeod P, Huang A, Larochelle P, Mallet L. “Adverse Events Associated with Prescription Drug Cost-Sharing among Poor and Elderly Persons.”. Journal of the American Medical Association. 2001;285(4):421–9. doi: 10.1001/jama.285.4.421. [DOI] [PubMed] [Google Scholar]
- Van Tielen R, Peys F, Genaert J. “The Demographic Impact on Ambulatory Pharmaceutical Expenditure in Belgium.”. Health Policy. 1998;45(1):1–14. doi: 10.1016/s0168-8510(98)00026-8. [DOI] [PubMed] [Google Scholar]
- Wright JM. “Choosing a First-Line Drug in the Management of Elevated Blood Pressure: What is the Evidence? 1: Thiazide diuretics.”. Canadian Medical Association Journal. 2000;163(1):57–60. [PMC free article] [PubMed] [Google Scholar]