

Abstract
Background
Tissue oxygenation is the primary determinant of wound infection risk. Mild hypercapnia markedly improves cutaneous, subcutaneous, and muscular tissue oxygenation in volunteers and patients. However, relative contributions of increased cardiac output and peripheral vasodilation to this response remains unknown. We thus tested the hypothesis that increased cardiac output is the dominant mechanism.
Methods
We recruited 10 ASA III patients, aged 40–65 years, undergoing cardiopulmonary bypass for this crossover trial. After induction of anaesthesia, a Silastic tonometer was inserted subcutaneously in the upper arm. Subcutaneous tissue oxygen tension was measured with both polarographic electrode and fluorescence-based systems. Oximeter probes were placed bilaterally on the forehead to monitor cerebral oxygenation. After initiation of cardiopulmonary bypass, in random order patients were exposed to two arterial CO2 partial pressures for 30 minutes each: 35 (normocapnia) or 50 mmHg (hypercapnia). Bypass pump flow was kept constant throughout the measurement periods.
Results
Hypercapnia during bypass had essentially no effect on PaO2, mean arterial pressure, or tissue temperature. PaCO2 and pH differed significantly. Subcutaneous tissue oxygenation was virtually identical during the two PaCO2 periods (139 [50,163] vs. 145 [38,158], P=0.335) (median [range]). In contrast, cerebral oxygen saturation (our positive control measurement) was significantly less during normocapnia (57 [28,67]%) than hypercapnia (64 [37,89]%, P=0.025).
Conclusions
Mild hypercapnia, which normally markedly increases tissue oxygenation, did not do so during cardiopulmonary bypass with fixed pump output. This suggests that hypercapnia normally increases tissue oxygenation by increasing cardiac output rather than direct dilation of peripheral vessels.
Keywords: Carbon Dioxide, Hypercapnia, Hypercarbia, Acidosis, Respiratory, Oxygenation, Oxygen, Tissue, Cutaneous, Subcutaneous, Cerebral, Perfusion, Cerebrovascular, Cardiac Output
Background
Wound infections are among the most common serious complications of anaesthesia and surgery.1. All wounds become contaminated. Contamination progresses to a clinical infection when host defence fails. This process occurs during a “decisive period” lasting several hours after contamination2; in other words, during the immediate perioperative period. Oxidative killing by neutrophils is the primary determinant of host resistance to bacterial contamination.3. It is thus unsurprising that factors which increase subcutaneous tissue oxygenation reduce infection risk.4
Determinants of subcutaneous oxygen availability include arterial oxygen pressure,4 haemoglobin concentration,5 cardiac output,6 local perfusion,7 fraction of fat in subcutaneous tissue,8 hydration status,9 and autonomic responses to pain.10 Mild-to-moderate hypercapnia also improves tissue oxygen availability.11 For example, subcutaneous oxygenation increased from 63 ± 14 to 89 ± 19 mmHg (P = 0.01) when arterial PCO2 increased from 35 to 50 mmHg.11 This 26-mmHg increase is likely to be clinically important.12
There are two mechanisms by which hypercapnia might improve tissue oxygenation. The first is activation of central13 and peripheral14 chemoreceptors, which promotes release of catecholamines.15, 16 Catecholamines, in turn, increase cardiac output,11, 17 enhance systemic vascular conductance,14, 18 and increase venous return.13, 19, 20 Interestingly, hypercapnia is not associated with increased blood pressure,11 at least not during anaesthesia, because baroreflex-mediated parasympathetic activity reduces systemic vascular resistance (SVR) and heart rate.17, 21 The second mechanism by which hypercapnia might improve tissue oxygenation is direct, locally-medicated peripheral vasodilation that may overwhelm sympathetic vasoconstriction.22, 23
The relative contribution of increased cardiac output and direct peripheral vasodilation remains unknown; that is, peripheral capacitance vessels could dilate to absorb increased cardiac output or cardiac output could increase in response to systemic vasodilation. Normally, it would be difficult to separate peripheral vasodilation caused by the local action of CO2 from mechanisms that involve increased cardiac output and central autonomic regulation of the circulation. An exception, though, is during cardiopulmonary bypass when the bypass pump can control systemic perfusion. We, therefore, tested the hypothesis that mild hypercapnia increases peripheral tissue and cerebral oxygenation during cardiopulmonary bypass even when the pump flow (cardiac output) remains constant.
Among the various systems currently used for tissue oxygen monitoring, the Clark-type electrode-based method is considered the gold standard. The disadvantage of this method is that the Clark-type electrode consumes oxygen itself, which can decrease the system’s accuracy, especially at lower tissue oxygen tensions. Ruthenium-based fluorescent oxygen probe (optode) systems do not have this disadvantage, but have not been fully validated for clinical use. We thus took this opportunity to validate a new fluorescence optode oxygen monitoring system by comparing it to the standard polarographic electrode (Clark-type) method and evaluating practical factors related to its use.
Methods
With the approval of Human Studies Committee at the University of Louisville and written informed consent, we enrolled 10 American Society of Anesthesiologists (ASA) physical status III patients aged 40–65 years, undergoing heart surgery on cardiopulmonary bypass. Patients were excluded if they were morbidly obese (BMI > 35), had diabetes or peripheral vascular disease of any type, or were taking α2-agonists or other vasoactive drugs. Patients who smoked were included, but were not permitted to smoke during the 8 hours prior to surgery because smoking reduces tissue oxygenation for one hour.24
Using a crossover study design, we compared subcutaneous tissue oxygen pressure and cerebral oxygen saturation during normocapnia and mild hypercapnia. Based on previous data,11 we expected that mild hypercapnia (a 15–20 mmHg increase in arterial PCO2) would increase subcutaneous tissue oxygen pressure by at least 15 mmHg. Assuming, as in our previous studies, that the standard deviation would be 15 mmHg, we estimated that a sample size of 10 would provide an 80% power to detect a statistically significant effect of hypercapnia at an alpha level of 0.05.
Protocol
Anaesthesia was induced with etomidate (0.3 mg kg−1), succinylcholine (≈1 mg kg−1), and fentanyl (3–4 μg kg−1), and maintained with pancuronium (0.01 mg kg−1 as needed), fentanyl (≈10 μg kg−1 bolus before sternotomy then 2–3 μg kg−1 as needed), and isoflurane. Hypovolemia reduces subcutaneous perfusion9; therefore, patients were kept well hydrated, especially during the pre-bypass period, by an infusion of crystalloid at a rate of 6–8 mL·kg−1·h−1. Patients were actively warmed to maintain core temperature near 36°C before and after the bypass procedure. Because local warming influences tissue oxygenation, the upper arm tonometer site (described below) was protected from active surface warming.
After initiation of cardiopulmonary bypass, pump flow was set to maintain sufficient perfusion with a constant flow at a target mean arterial pressure of 60 mmHg. Once set, pump outflow was kept constant until the end of the bypass period. Patients were alternately exposed to a PaCO2 of 35 and 50 mmHg during bypass, using a crossover design. Each designated PaCO2 tension was maintained for about 30 minutes. Carbon dioxide was added to the oxygenator circuit by the perfusionist, as necessary, to maintain the designated PaCO2. Treatment order was randomly assigned and based on computer-generated codes that were maintained in sealed, sequentially numbered opaque envelopes until the beginning of the bypass procedure. Intraoperatively (including the bypass period), the inspired oxygen concentration (FiO2) was kept constant for each patient (average of all patients was 0.85 ± 0.10).
Measurements
Demographic and morphometric characteristics and potential confounding factors, including preoperative haemoglobin, smoking status, type and duration of surgery, total amount of crystalloids given, and intraoperative core temperature, were recorded. Core temperature was measured from the distal oesophagus (Mallinckrodt Anaesthesiology Products, St. Louis, MO) and Swan-Ganz catheter. Bladder temperature, which was recorded from the urinary catheter, was used to represent core temperature during the bypass period because the chest cavity was open.
After induction of anaesthesia, 5 to 6 cm of a 15-cm-long Silastic tonometer (1 mm outer diameter, 0.8 mm inner diameter) was inserted subcutaneously on the lateral aspect of one upper arm, which was then gently tucked at the patient’s side. Subcutaneous tissue oxygen tension (PsqO2) was measured with a polarographic electrode system (Licox Medical Systems, Corp., Greenvale, NY).25 The polarographic oxygen electrode was calibrated on room air at the beginning of each surgery (154 mmHg), and then positioned within the Silastic tonometer described above. A thermocouple was inserted into the opposite lumen of the tonometer and positioned approximately 1 cm from the oxygen electrode. The system was filled with hypoxic saline to remove air from the catheter.
Calibration and stabilization of the polarographic system required 20 to 30 minutes. In vitro accuracy of the polarographic electrodes (in a water bath at 37°C) is ±3 mmHg for 0 to 100 mmHg O2 and ±5% for 100 to 360 mmHg O2. Temperature sensitivity is 0.25% per degree centigrade (°C), but temperature-compensation is included in the PsqO2 calculations. Polarographic electrode calibration remains stable (within 8% of baseline value for room air) in vivo for at least 8 hours. Consequently, polarographic electrodes measure oxygen tension accurately and reliably over a broad range of subcutaneous temperatures and PO2 values.25
Subcutaneous tissue oxygen tension was also measured from the same silicon tubing with the FOXY fluorescence system (Ocean Optics Inc., Dunedin, FL), a relatively new technology. The FOXY-PI600 oxygen probe was simultaneously inserted into the silicon catheter. The fibre-optic probe conveys excitation light produced by a blue LED to a solgel thin film coating on the membrane at the probe tip. Fluorescence quenching of this probe is related to the partial pressure of oxygen by the Stern-Volmer equation.26 Fluorescence generated at the tip is collected by the probe and carried by optical fibre to the detector.27 We performed a two-point calibration of the optode at 0 and 154 mmHg (FiO2: 0 and 0.21) before insertion.
Cerebral oxygen saturation was monitored by a non-invasive near-infrared reflectance spectroscopic oximeter (INVOS 3100, Somanetics, Troy, Michigan, U.S.A.).28 Cerebral oximetry reflects the balance between regional oxygen supply and demand.29
Data Analysis
The major outcomes of our study were subcutaneous oxygen tension, as measured by two different systems, and cerebral oxygen saturation.
Intraoperative values were recorded at 5-minute intervals. Tissue oxygenation values were monitored continuously and recorded at the end of each 30-minute interval. The average values of the tissue oxygen gathered at the end of each 30-minute interval were then compared between the periods. Demographic and morphometric factors were recorded.
Outcomes were compared between the groups with paired, two-tailed t tests. Non-normally distributed results were analyzed by Wilcoxon signed-rank tests. Results are presented as means (standard deviations or 95% confidence intervals), actual values, median [range], or percentages; P < 0.05 was considered statistically significant. Additionally, two-period crossover methodology described by Hills and Armitage30 was used to investigate treatment effects and possible period effects for the three major outcomes.
Linear regression and Bland-Altman analysis were used to compare tissue oxygen tensions obtained from the polarographic electrode (Licox) and fluoroscopic optode (Foxy) systems.
Results
The patients were 56 (7) years old and three were women. Three of the 10 were obese (BMI between 30 and 35 kg m−2). The duration of surgery averaged 3.5 hours, which included 1 to 1.5 hours of cardiopulmonary bypass. Five patients had coronary artery bypass graft (CABG) surgery, five had valve replacement surgery, and one had both arterial grafting and a valve replacement. All but one of the patients had a history of cigarette smoking. Preoperative haemoglobin and other laboratory values were within normal range (Table 1).
Table 1.
Patient Characteristics and Potential Confounding Factors.
| N = 10 | |
|---|---|
| Age (years) | 56 (7) |
| Sex (Female / Male) | 3 / 7 |
| Height (cm) | 171 (12) |
| Weight (kg) | 84 (21) |
| Body Mass Index (BMI) (kg m−2) | 28 (5) |
| BMI > 30 kg m−2 (n) | 3 |
| Duration of Surgery (min) | 203 (38) |
| Total Crystalloids (L) | 3.0 (0.7) |
| Type of Surgery (n) | |
| CABG | 4 |
| CABG and Aortic Valve Replacement | 1 |
| Mitral and Aortic Valve Replacement | 2 |
| Mitral Valve Replacement | 3 |
| Smoking Status (n) | |
| Never Smoked | 1 |
| Quit >12 weeks ago – Smoked > 20 y | 3 |
| Quit 3–12 weeks ago – Smoked > 20 y | 3 |
| Current Smoker – not smoked in the past 24h | 3 |
| Preoperative Laboratory Values* | |
| Glucose, mmol L−1 [mg dL−1] | 6.1 (1.0) [110 (18)] |
| Haemoglobin, g L−1 [mg dL−1] | 140 (20) [14 (2)] |
| Albumin, g −1L [g dL−1] | 37 (6) [3.7 (0.6)] |
| Serum urea nitrogen (BUN), mmol L−1 [mg dL−1] | 5 (1) [13 (3)] |
| Creatinine, μmol L−1 [mg dL−1] | 88 (18) [1.0 (0.2)] |
Data presented as means (standard deviations) or actual values.
SI units [conventional units]
During bypass, measurements of FiO2, PaO2, pump outflow, mean arterial pressure, core (bladder) temperature, and subcutaneous tissue temperature were similar during the normocapnic and hypercapnic periods (Table 2). Arterial carbon dioxide pressures (PaCO2) and pH differed significantly, as expected (Table 2). No vasopressor agents were administered before or during bypass.
Table 2.
Major Outcomes With Normocapnia and Hypercapnia During Cardiopulmonary Bypass.
| Target PaCO2 | 35mmHg | 50mmHg | P |
|---|---|---|---|
| Cardiac Index – Pump Outflow (L·m−2 min−1) | 2.5 (0.2) | 2.5 (0.1) | 0.608 |
| 2.5 [2.2, 2.7] | 2.6 [2.3, 2.6] | ||
| Mean Arterial Pressure (mmHg) | 65 (6) | 66 (6) | 0.724 |
| 66 [56, 77] | 66 [56, 77] | ||
| FiO2 (%) | 83 (7) | 83 (6) | 0.979 |
| 80 [75, 97] | 82 [72, 97] | ||
| PaO2 (mmHg) | 363 (110) | 367 (84) | 0.881 |
| 349 [216, 541] | 372 [234, 515] | ||
| PaCO2 (mmHg) | 38 (3) | 52 (4) | <0.001 |
| 38 [33, 41] | 53 [43, 57] | ||
| PH | 7.42 (0.04) | 7.32 (0.05) | 0.002 |
| 7.41 [7.38, 7.50] | 7.31 [7.26, 7.42] | ||
| Core Temperature (°C) | 34.6 (1.1) | 34.7 (1.2) | 0.850 |
| 34.6 [33.1, 36.9] | 34.7 [33.1, 36.4] | ||
| Subcutaneous Temp - Tsq (°C) | 31.9 (1.7) | 32.3 (2.0) | 0.193 |
| 32.3 [29.5, 35.4] | 32.4 [28.8, 35.1] | ||
| Licox PsqO2 (mmHg) | 122 (39) | 119 (47) | 0.335 |
| 139 [50, 163] | 145 [38, 158] | ||
| Foxy PsqO2 (mmHg) | 130 (38) | 129 (51) | 0.322* |
| 142 [56, 187] | 147 [47, 209] | ||
| Cerebral Oximeter Saturation (%) | 55 (14) | 64 (17) | 0.025 |
| 57 [28, 67] | 64 [37, 89] |
Data presented as means (SDs) and median [range]; paired two-tailed t tests were used to compare values for each 30-min crossover period except where asterisk (*) denotes Wilcoxon signed-rank test was used. Licox PsqO2: Polarographic electrode system. Foxy PsqO2: Fluorescence optode system.
PaO2 was virtually identical during each study period. Although the relationship is not known to be linear, subcutaneous oxygen partial pressure (PsqO2) was approximately one-third that of the PaO2 (≈120 vs. 365 mmHg). PsqO2 during normocapnia (PCO2 of 35 mmHg) was similar to that during hypercapnia (PCO2 of 50 mmHg), whether measured by the Licox or Foxy system (Table 2 and Fig. 1).
Fig. 1.
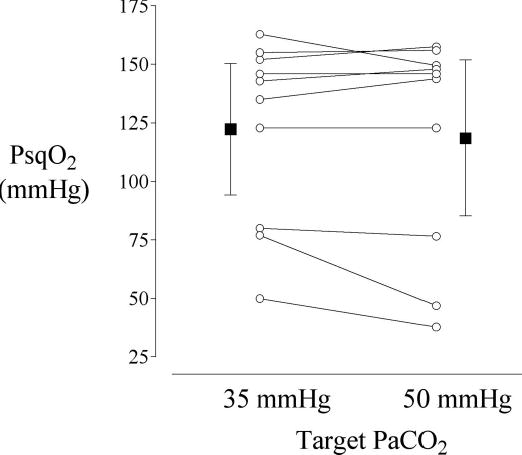
Mean subcutaneous tissue oxygen tension values obtained via a polarographic electrode system at the end of the 30-min normocapnia (35 mmHg PaCO2) and hypercapnia (50 mmHg PaCO2) periods. There was no statistically significant difference in subcutaneous tissue oxygenation between the periods (P = 0.335).
On the other hand, hypercapnia caused a clinically important and statistically significant increase in the cerebral oxygen saturation despite constant bypass pump flow and mean arterial pressure (55 (14)% vs. 64 (17)%, P = 0.025, Table 2 and Fig. 2).
Fig. 2.

Mean cerebral oximeter saturation values obtained at the end of 30-min normocapnia (35 mmHg PaCO2) and hypercapnia (50 mmHg PaCO2) periods. Cerebral oxygen saturation was significantly greater during hypercapnia (P = 0.025).
Using the two-period crossover methodology,30 PsqO2, as measured with Licox, had a treatment effect of 4.9 mmHg (P = 0.213, 95% CI of −3.3 to 13.1) and a period effect of 5.1 mmHg (P = 0.194, 95% CI of −3.1 to 13.3). PsqO2, as measured with the Foxy system, had similar results with a treatment effect of 3.8 mmHg (P = 0.562, 95% CI of −10.3 to 17.9) and a period effect of 11.4 mmHg (P = 0.100, 95% CI of −2.7 to 25.5). On the contrary, in cerebral oxygen saturation there was a statistically significant treatment effect of 9.5% (P = 0.007, 95% CI of 4.1 to 14.9) with a non-significant period effect of 3.4% (P = 0.204, 95% CI of −2.0 to 8.8).
Tissue oxygenation recorded from the tissue oxygen monitoring systems correlated well (r=0.92, Fig. 3). The difference between the polarographic and fluoroscopic systems (accuracy, bias) averaged 6.8 (15.0) mmHg. The precision (two standard deviations of the difference between the systems) was 30 mmHg (Fig. 4). The Foxy system proved difficult to use because it was light sensitive, subject to substantial motion artefact, and lacked a small-calibre temperature sensor.
Fig. 3.

The correlation between the PsqO2 values obtained with the polarographic electrode (Licox) and fluoroscopic optode (Foxy) systems.
Fig. 4.
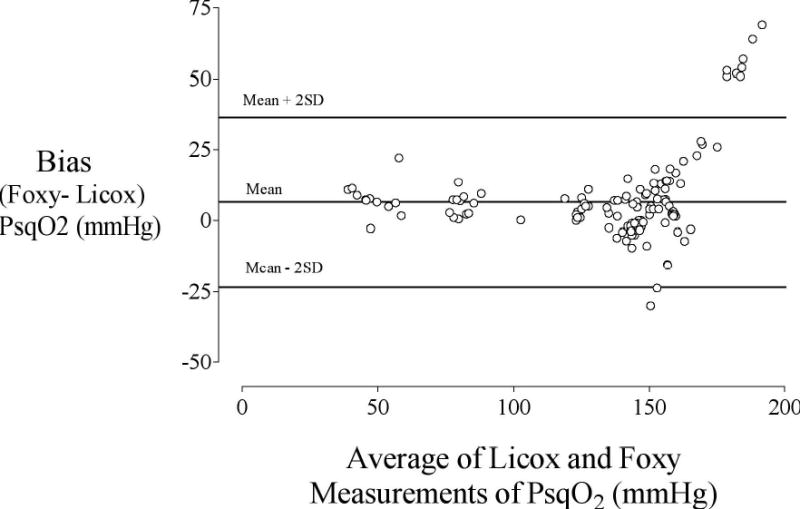
Bland-Altman analysis comparing the polarographic electrode (Licox) and fluoroscopic optode (Foxy) systems. The bias (average difference of Foxy minus Licox method) is plotted on the y-axis and the average of the Foxy and Licox values is plotted on the x-axis. The solid line represents the bias (6.8 (15.0)) whereas the dashed lines represent ± 2 standard deviations of the bias.
Discussion
It is well established that mild hypercapnia improves peripheral perfusion and increases tissue PO2. Our main question was whether peripheral vasodilation is a direct effect of the CO2 or a secondary result of increased cardiac output and related central autonomic homeostatic responses. We found that mild hypercapnia did not increase subcutaneous tissue oxygenation when systemic blood flow and mean arterial pressure remained constant during cardiopulmonary bypass. Increased tissue oxygenation during mild hypercapnia thus most likely results from a hyperdynamic circulatory response and shifting oxyhaemoglobin dissociation curve rather than direct peripheral vasodilation.
Even mild systemic hypercapnia provokes sympatho-excitation15 which increases cardiac output, enhances systemic vascular conductance,18, 19 and — because of active venoconstriction — increases venous return.19, 20 The increase in capacitance vessel tone is mediated via peripheral and central chemoreceptors and does not necessarily parallel changes in overall vascular resistance18 — and, as our results demonstrate, does not increase subcutaneous perfusion. Venoconstriction nonetheless increases venous return and is, thus, invariably associated with a sustained increase in cardiac output,14, 18, 19, 31 an effect that dominates a small direct depressant effect of hypercapnic acidosis on the isolated myocardium.32, 33
Hypercapnia increases both sympathetic and cardiac vagus nerve activity in anaesthetized dogs. Such co-activation of vagus and sympathetic systems, which can be initiated reflexively or by action on higher centres, has been shown to be of distinct physiological benefit in controlling reactions that relate cardiac function to body need. Since the sympathetic and parasympathetic systems are co-activated during systemic hypercapnia, blood pressure and heart rate response depends on the functional balance between these two systems. We were unable to evaluate heart rate during bypass, but have previously shown that both mean arterial blood pressure and heart rate remained essentially unchanged during hypercapnia even though cardiac output increases 25%.11
Recent evidence indicates that both the sympathetic and parasympathetic nervous systems contribute to regulation of peripheral microcirculation.34 The presence of parasympathetic-related, high-frequency microvascular oscillations has been recently documented in adrenergically rich peripheral regions — even during nonpulsatile perfusion34 — and has important implications for local flow homeostasis. Interestingly, nonpulsatile flow in the systemic circulation, as during cardiopulmonary bypass, progressively increases sympathetic nerve activity,35 leading to arterial vasoconstriction and increased systemic vascular resistance.35 This increase in sympathetic nerve activity is due to suppression of baroreflex-mediated inhibition of the vasomotor centre and is associated with local parasympathetic activation34 in an effort to preserve tissue perfusion. Mild hypercapnia during constant systemic blood flow did not increase tissue oxygenation; however, we can not exclude the possibility of a differential action of CO2 in regional vascular resistance,36 which could have diverted systemic perfusion to areas other than subcutaneous tissues.37 Our results provided data only from the subcutaneous tissue. If any perfusion improvements occurred because of a change in vascular resistance, we missed them due to lack of monitoring. Potential redistribution cannot be excluded either.
In striking contrast to the unchanged subcutaneous oxygenation during constant systemic blood flow, mild hypercapnia markedly improved cerebral regional oxygen saturation. And the magnitude of the increase was similar to that we have previously observed in patients undergoing elective non-cardiac surgery.31 This finding is consistent with the fact that sympathetic control of the cerebral vessels is weaker than of other vascular beds,38 and the contractile state of the cerebrovascular smooth muscle appears to depend mainly on local metabolic factors including the partial pressure of CO2. Thus, the vasodilator effect of CO2 is particularly marked in the cerebral circulation where a CO2 concentration of 7 to 10% nearly doubles cerebral blood flow (CBF) in humans,39 while mild hypercapnia (PaCO2 ~ 50 mmHg) impairs autoregulation of CBF and is associated with an overall increase in cerebral oxygenation.11, 40 A similar cerebrovascular response during cardiopulmonary bypass leads to an increase in CBF41 that is associated with a reduction in cerebral oxygen consumption.42 On the other hand, peripheral vasomotor tone during hypercapnia is essentially the result of a balance between the direct effects of CO2 and the level of sympathetic activity.38 Of course, because neither cerebral nor other vital organ blood flows were monitored in the study, it was not possible to exclude any role of redistribution of blood flow between the organ systems.
The mechanism by which CO2 exerts its direct effects on the cerebral vasculature seems to involve nitric oxide (NO), ATP-sensitive potassium channels, and cyclooxygenase-dependent pathways. The CO2-NO axis is considered a cardinal pathway for CBF regulation in humans. Thus, although ATP-sensitive and Ca2+-activated potassium channels are also major systems that respond to hypercapnic acidosis, their response is incomplete in the absence of NO donors. In both animals43 and humans,44 hypercapnic vasodilatation is mediated by inhibition of nitric oxide synthase — the enzyme responsible for nitric oxide synthesis. It is probable that the vasodilation to hypercapnic acidosis is mediated either by increased synthesis of NO or increased sensitivity to NO.
A secondary goal of our study was to compare a new fluoroscopic optode based oxygen-monitoring system (Foxy) with the current standard, polarographic electrode system (Licox). The fluorescence optode system is known to be more accurate in lower tissue oxygen environments than the polarographic one, because it does not consume oxygen. However, increased bias and impaired linearity of the relationship between the oxygen-monitoring systems when PsqO2 was above 150 mmHg indicates reduced accuracy of the fluorescence optode at high tissue oxygenation. Other drawbacks of the fluorescence method include substantial light sensitivity, sensitivity to movement, and the lack of a small calibre temperature probe. These limitations make its use in the clinical setting impractical.
Another potential limitation of our study was that we allowed only a 30-minute equilibration period at each designated of arterial PCO2 concentration. (A period of 30 minutes was chosen because the bypass period sometimes lasted only an hour.) However, 20 to 30 minutes is sufficient to obtain stable tissue oxygen values with tonometric systems that accommodate tissue oxygen probes. A further potential limitation of our study was that 3 of our 10 patients were obese and obesity is known to influence tissue oxygenation.8 However, because of our crossover design, the effect on tissue oxygenation should have been the same at both concentrations of carbon dioxide. And lastly, we did not provide a positive control by increasing the bypass pump outflow during the study, which would have simulated increased cardiac output. Although we initially thought about putting this in our protocol, because we were working with patients as study subjects, we decided that it would be risky to include it. The clinical importance of the relationship between the bypass pump outflow and weaning the patient off the pump is just too fragile.
In summary, mild hypercapnia — which normally markedly increases subcutaneous tissue oxygenation — failed to do so during cardiopulmonary bypass when the bypass pump controlled systemic blood flow. In contrast, cerebral oxygen saturation increased as usual. The increase in subcutaneous oxygen partial pressure that normally accompanies mild hypercapnia thus results largely from increased cardiac output and compensatory autonomic circulatory responses. Potential contribution of shifting of oxyhaemoglobin dissociation curve and decreased oxygen consumption should also be considered.
Acknowledgments
Supported by NIH Grants GM 61655 and DE 14879-01A1 (Bethesda, MD), the Joseph Drown Foundation (Los Angeles, CA), the Oesterreichische Nationalbank Jubiläumsfonds, the Gheens Foundation (Louisville, KY), Ocean Optics Inc. Spectroscopy Educational Grant program, and the Commonwealth of Kentucky Research Challenge Trust Fund (Louisville, KY). Dr. Akça is the recipient of a Research Training Grant from the Foundation for Anesthesia Education and Research. Somanetics, Inc. (Troy, MI) donated the INVOS cerebral oximeter probes. Tyco-Mallinckrodt Anesthesiology Products, Inc. (St. Louis, MO) donated the thermocouples we used. We thank Gilbert Haugh, M.S., for help with the statistical analysis, Nancy Alsip, Ph.D., for editorial assistance (both from the Outcomes Research Institute, University of Louisville), and Dr. Harvey Edmonds for suggestions about cerebral oxygenation and perfusion monitoring (Dept. of Anesthesiology, University of Louisville).
Footnotes
Received from the Outcomes Research Institute, Department of Anesthesiology and Perioperative Medicine, Neuroscience Intensive Care Unit, and Department of Surgery, University of Louisville, Louisville, KY; and the Department of Outcomes Research, Cleveland Clinic Foundation, Cleveland, OH.
References
- 1.Haley R. Infection-control strategies save $250,000 annually. Hospitals. 1985;59:63–65. [PubMed] [Google Scholar]
- 2.Burke JF. The effective period of preventive antibiotic action in experimental incisions and dermal lesions. Surgery. 1961;50:161–168. [PubMed] [Google Scholar]
- 3.Knighton DR, Fiegel VD, Halverson T, et al. Oxygen as an antibiotic. The effect of inspired oxygen on bacterial clearance. Arch Surg. 1990;125:97–100. doi: 10.1001/archsurg.1990.01410130103015. [DOI] [PubMed] [Google Scholar]
- 4.Greif R, Akça O, Horn E-P, et al. Supplemental perioperative oxygen to reduce the incidence of surgical wound infection. N Engl J Med. 2000;342:161–167. doi: 10.1056/NEJM200001203420303. [DOI] [PubMed] [Google Scholar]
- 5.Gosain A, Rabin J, Reymond JP, et al. Tissue oxygen tension and other indicators of blood loss or organ perfusion during graded hemorrhage. Surgery. 1991:523–532. [PubMed] [Google Scholar]
- 6.Shoemaker W, Appel P, Kram H. Oxygen transport measurements to evaluate tissue perfusion and titrate therapy: dobutamine and dopamine effects. Crit Care Med. 1991;19:672–688. doi: 10.1097/00003246-199105000-00014. [DOI] [PubMed] [Google Scholar]
- 7.Ikeda T, Tayefeh F, Sessler DI, et al. Local radiant heating increases subcutaneous oxygen tension. Am J Surg. 1998;175:33–37. doi: 10.1016/s0002-9610(97)00237-7. [DOI] [PubMed] [Google Scholar]
- 8.Kabon B, Nagele A, Reddy D, et al. Obesity decreases perioperative tissue oxygenation. Anesthesiology. 2004;100:274–280. doi: 10.1097/00000542-200402000-00015. [DOI] [PMC free article] [PubMed] [Google Scholar]
- 9.Arkilic C, Tagushi A, Ahluwalia A, Sessler D, Kurz A. The effect of supplemental fluid administration on tissue perfusion and tissue oxygen pressure. Anesthesiology. 2000;93:A207. [Google Scholar]
- 10.Akça O, Melischek M, Scheck T, et al. Postoperative pain and subcutaneous oxygen tension. Lancet. 1999;354:41–42. doi: 10.1016/S0140-6736(99)00874-0. [DOI] [PubMed] [Google Scholar]
- 11.Akça O, Doufas A, Morioka N, et al. Hypercapnia Improves Tissue Oxygenation. Anesthesiology. 2002;97:801–806. doi: 10.1097/00000542-200210000-00009. [DOI] [PubMed] [Google Scholar]
- 12.Hopf HW, Hunt TK, West JM, et al. Wound tissue oxygen tension predicts the risk of wound infection in surgical patients. Arch Surg. 1997;132:997–1004. doi: 10.1001/archsurg.1997.01430330063010. discussion 1005. [DOI] [PubMed] [Google Scholar]
- 13.Gaddis ML, MacAnespie CL, Rothe CF. Vascular capacitance responses to hypercapnia of the vascularly isolated head. Am J Physiol. 1986;251:H164–170. doi: 10.1152/ajpheart.1986.251.1.H164. [DOI] [PubMed] [Google Scholar]
- 14.Shoemaker JK, Vovk A, Cunningham DA. Peripheral chemoreceptor contributions to sympathetic and cardiovascular responses during hypercapnia. Can J Physiol Pharmacol. 2002;80:1136–1144. doi: 10.1139/y02-148. [DOI] [PubMed] [Google Scholar]
- 15.Low JM, Gin T, Lee TW, Fung K. Effect of respiratory acidosis and alkalosis on plasma catecholamine concentrations in anaesthetized man. Clin Sci (Lond) 1993;84:69–72. doi: 10.1042/cs0840069. [DOI] [PubMed] [Google Scholar]
- 16.Somers VK, Mark AL, Zavala DC, Abboud FM. Contrasting effects of hypoxia and hypercapnia on ventilation and sympathetic activity in humans. J Appl Physiol. 1989;67:2101–2106. doi: 10.1152/jappl.1989.67.5.2101. [DOI] [PubMed] [Google Scholar]
- 17.Andersen M, Mouritzen C. Effect of acute respiratory and metabolic acidosis on cardiac output and peripheral resistance. Ann Surg. 1966;63:161–168. doi: 10.1097/00000658-196602000-00001. [DOI] [PMC free article] [PubMed] [Google Scholar]
- 18.Rothe CF, Maass-Moreno R, Flanagan AD. Effects of hypercapnia and hypoxia on the cardiovascular system: vascular capacitance and aortic chemoreceptors. Am J Physiol. 1990;259:H932–939. doi: 10.1152/ajpheart.1990.259.3.H932. [DOI] [PubMed] [Google Scholar]
- 19.Braunwald E, Ross J, Jr, Kahler R, et al. Reflex control of the systemic venous bed. Effects on venous tone of vasoactive drugs, and of baroreceptor and chemoreceptor stimulation. Circ Res. 1963;2:539–552. doi: 10.1161/01.res.12.5.539. [DOI] [PubMed] [Google Scholar]
- 20.Tominaga M, Stekiel TA, Bosnjak ZJ, Kampine JP. Contribution of carotid chemoreceptors to mesenteric venoconstriction during acute hypercapnia in rabbits. Am J Physiol. 1999;277:H2305–2310. doi: 10.1152/ajpheart.1999.277.6.H2305. [DOI] [PubMed] [Google Scholar]
- 21.Oikawa S, Hirakawa H, Kusakabe T, Nakashima Y, Hayashida Y. Autonomic cardiovascular responses to hypercapnia in conscious rats: the roles of the chemo- and baroreceptors. Auton Neurosci. 2005;117:105–114. doi: 10.1016/j.autneu.2004.11.009. [DOI] [PubMed] [Google Scholar]
- 22.Morii S, Ngai AC, Winn HR. Reactivity of rat pial arterioles and venules to adenosine and carbon dioxide: with detailed description of the closed cranial window technique in rats. J Cereb Blood Flow Metab. 1986;6:34–41. doi: 10.1038/jcbfm.1986.5. [DOI] [PubMed] [Google Scholar]
- 23.Yamaguchi K, Takasugi T, Fujita H, et al. Endothelial modulation of a pH-dependent pressor response in isolated perfused rabbit lungs. Am J Physiol. 1996;270:H252–258. doi: 10.1152/ajpheart.1996.270.1.H252. [DOI] [PubMed] [Google Scholar]
- 24.Jensen JA, Goodson WH, Hopf HW, Hunt TK. Cigarette smoking decreases tissue oxygen. Arch Surg. 1991;126:1131–1134. doi: 10.1001/archsurg.1991.01410330093013. [DOI] [PubMed] [Google Scholar]
- 25.Gottrup F, Firmin R, Chang N, Goodson IIIWH, Hunt TK. Continuous direct tissue oxygen tension measurement by a new method using an implantable silastic tonometer and oxygen polarography. Am J Surg. 1983;146:399–403. doi: 10.1016/0002-9610(83)90427-0. [DOI] [PubMed] [Google Scholar]
- 26.Torres Filho IP, Intaglietta M. Microvessel PO2 measurements by phosphorescence decay method. Am J Physiol. 1993;265:H1434–1438. doi: 10.1152/ajpheart.1993.265.4.H1434. [DOI] [PubMed] [Google Scholar]
- 27.Ocean Optics I, 380 Main Street D, Fla., USA. OOISensors, Fiber Optic Sensors System Operating Instructions. In, vol. 2001–2005: Ocean Optics, Inc.; 2004.
- 28.Akca O, Sessler D. Use of cerebral oximetry to detect and manage cerebral desaturation with a rapidly expanding neck hematoma. Acta Anaesthesiol Scand. 2002;46:607–608. doi: 10.1034/j.1399-6576.2002.460521.x. [DOI] [PubMed] [Google Scholar]
- 29.Nemoto E, Yonas H, Kassam A. Clinical experience with cerebral oximetry in stroke and cardiac arrest. Crit Care Med. 2000;28:1052–1054. doi: 10.1097/00003246-200004000-00023. [DOI] [PubMed] [Google Scholar]
- 30.Hills M, Armitage P. The two-period cross-over clinical trial. Br J Clin Pharmacol. 1979;8:7–20. doi: 10.1111/j.1365-2125.1979.tb05903.x. [DOI] [PMC free article] [PubMed] [Google Scholar]
- 31.Akca O, Liem E, Suleman M, et al. Effect of intra-operative end-tidal carbon dioxide partial pressure on tissue oxygenation. Anaesthesia. 2003;58:536–542. doi: 10.1046/j.1365-2044.2003.03193.x. [DOI] [PubMed] [Google Scholar]
- 32.Kazmaier S, Weyland A, Buhre W, et al. Effects of respiratory alkalosis and acidosis on myocardial blood flow and metabolism in patients with coronary artery disease. Anesthesiology. 1998;89:831–837. doi: 10.1097/00000542-199810000-00006. [DOI] [PubMed] [Google Scholar]
- 33.Walley KR, Lewis TH, Wood LD. Acute respiratory acidosis decreases left ventricular contractility but increases cardiac output in dogs. Circ Res. 1990;67:628–635. doi: 10.1161/01.res.67.3.628. [DOI] [PubMed] [Google Scholar]
- 34.Podgoreanu MV, Stout RG, El-Moalem HE, Silverman DG. Synchronous rhythmical vasomotion in the human cutaneous microvasculature during nonpulsatile cardiopulmonary bypass. Anesthesiology. 2002;97:1110–1117. doi: 10.1097/00000542-200211000-00012. [DOI] [PubMed] [Google Scholar]
- 35.Toda K, Tatsumi E, Taenaka Y, Masuzawa T, Takano H. Impact of systemic depulsation on tissue perfusion and sympathetic nerve activity. Ann Thorac Surg. 1996;62:1737–1742. doi: 10.1016/s0003-4975(96)00568-1. [DOI] [PubMed] [Google Scholar]
- 36.Lioy F, Blinkhorn MT, Garneau C. Regional hemodynamic effects of changes in PaCO2 in the vagotomized, sino-aortic de-afferented rat. J Auton Nerv Syst. 1985;12:301–313. doi: 10.1016/0165-1838(85)90045-1. [DOI] [PubMed] [Google Scholar]
- 37.Hoka S, Arimura H, Bosnjak ZJ, Kampine JP. Regional venous outflow, blood volume, and sympathetic nerve activity during hypercapnia and hypoxic hypercapnia. Can J Physiol Pharmacol. 1992;70:1032–1039. doi: 10.1139/y92-142. [DOI] [PubMed] [Google Scholar]
- 38.Ainslie PN, Ashmead JC, Ide K, Morgan BJ, Poulin MJ. Differential responses to CO2 and sympathetic stimulation in the cerebral and femoral circulations in humans. J Physiol. 2005;566:613–624. doi: 10.1113/jphysiol.2005.087320. [DOI] [PMC free article] [PubMed] [Google Scholar]
- 39.Kety S, Schmidt C. The effect of altered tensions of carbon dioxide and oxygen on cerebral blood flow and cerebral oxygen consumption of normal young men. Journal of Clinical Investigation. 1948;27:484–492. doi: 10.1172/JCI101995. [DOI] [PMC free article] [PubMed] [Google Scholar]
- 40.Rostrup E, Law I, Pott F, Ide K, Knudsen GM. Cerebral hemodynamics measured with simultaneous PET and near-infrared spectroscopy in humans. Brain Res. 2002;954:183–193. doi: 10.1016/s0006-8993(02)03246-8. [DOI] [PubMed] [Google Scholar]
- 41.Prough DS, Stump DA, Roy RC, et al. Response of cerebral blood flow to changes in carbon dioxide tension during hypothermic cardiopulmonary bypass. Anesthesiology. 1986;64:576–581. doi: 10.1097/00000542-198605000-00006. [DOI] [PubMed] [Google Scholar]
- 42.Prough DS, Rogers AT, Stump DA, et al. Hypercarbia depresses cerebral oxygen consumption during cardiopulmonary bypass. Stroke. 1990;21:1162–1166. doi: 10.1161/01.str.21.8.1162. [DOI] [PubMed] [Google Scholar]
- 43.Iadecola C, Pellegrino D, Moskowitz M, Lassen N. Nitric oxide synthase inhibition and cerebrovascular regulation. J Cereb Blood Flow Metab. 1994;14:175–192. doi: 10.1038/jcbfm.1994.25. [DOI] [PubMed] [Google Scholar]
- 44.Schmetterer L, Findl O, Strenn K, et al. Role of NO in the O2 and CO2 responsiveness of cerebral and ocular circulation in humans. Am J Physiol. 1997;273:R2005–R2012. doi: 10.1152/ajpregu.1997.273.6.R2005. [DOI] [PubMed] [Google Scholar]