Abstract
Measuring the quality of three-dimensional (3D) reconstructed biological macromolecules by transmission electron microscopy is still an open problem. In this article, we extend the applicability of the spectral signal-to-noise ratio (SSNR) to the evaluation of 3D volumes reconstructed with any reconstruction algorithm. The basis of the method is to measure the consistency between the data and a corresponding set of reprojections computed for the reconstructed 3D map. The idiosyncrasies of the reconstruction algorithm are taken explicitly into account by performing a noise-only reconstruction. This results in the definition of a 3D SSNR which provides an objective indicator of the quality of the 3D reconstruction. Furthermore, the information to build the SSNR can be used to produce a volumetric SSNR (VSSNR). Our method overcomes the need to divide the data set in two. It also provides a direct measure of the performance of the reconstruction algorithm itself; this latter information is typically not available with the standard resolution methods which are primarily focused on reproducibility alone.
1. Introduction
The three-dimensional (3D) reconstruction of biological macromolecules provides structural biologists with key information to fully understand the properties and functions of a given complex. 3D Electron Microscopy (3DEM) of single particles is one of the most useful imaging techniques since it allows the visualization of biological macromolecules nearly in their native state without any constraint of size or any need to crystallize (Baumeister and Steven, 2000; Ellis and Hebert, 2001; Frank, 2002; Ruprecht and Nield, 2001; Sali et al., 2003). The physical limits of 3DEM resolution have been discussed in terms of macromolecule size, microscope features, and number of images (Henderson, 1995). However, the assessment of the quality actually achieved by a 3D reconstruction is still an open problem (Grigorieff, 2000).
To the best of our knowledge, the measures available to assess the quality of 3D reconstructions in single-particle electron microscopy are: the Fourier shell correlation (FSC) (Harauz and van Heel, 1986; Saxton and Baumeister, 1982; van Heel, 1987), the Fourier ring phase residual (FRPR) (van Heel, 1987), the Q factor (Kessel et al., 1985; van Heel, 1980), and the spectral signal-to-noise ratio (SSNR) (Penczek, 2002; Unser et al., 1996).
By far, the most frequently used method to measure reconstruction quality is the FSC. However, the threshold at which the FSC defines the reconstruction resolution is still a questionable topic. Some classical thresholds are 0.8, 0.67, 0.5, 0.3, or 2 or 3 times the correlation with random noise (Penzcek, 1998). More recently, the new threshold 0.143 has appeared (Rosenthal and Henderson, 2003).
The main drawback of the FSC, as well as of the FRPR, is that they determine the 3D resolution by first computing two independent reconstructions and then by testing the concordance of their 3D Fourier transforms. This approach provides a fair assessment for the reproducibility of the experiment, but has also some basic limitations. First, it constrains us to produce reconstructions using subsets of the available data. Second, it does not explicitly test for the validity of the reconstruction algorithm itself—reproducibility alone is not a guarantee that the calculated density accurately represents the raw data. These problems are avoided in the method developed by Conway et al. (1993) which performs a FSC resolution assessment in the data domain using a reprojected version of the 3D reconstruction. This measure is also known in the literature as FRC3D. However, this non-standard way of using the FSC raises the difficulty of determining a resolution threshold that is sound, mainly because of the very different statistical properties of the images being compared (i.e., data versus reprojection).
Another more serious limitation of using FSC is that this correlation-based measure turns out to be invariant to any isotropic filtering of the entire data set. This is simply because such a global filtering will manifest itself by a radial rescaling of all spectral components both on the input (data) and on the output (3D reconstruction and reprojections). If the scaling is isotropic, the proportionality factor is the same for all spectral components at a given radial frequency with the result that the corresponding FSC value remains unchanged. Thus, we may very well perform lowpass filtering of the whole data set and still obtain the same FSC resolution estimate as before, which is obviously not satisfactory.
This motivated us to propose (Unser et al., 1996) an alternative criterion which is inspired from previous work in 2D (Unser et al., 1987). This criterion takes into account the whole chain of events in the reconstruction process and has a simple intuitive interpretation. This idea was further developed by Penczek (2002). However, this latter work is restricted to the class of algorithms that performs the reconstruction by interpolation in the Fourier space. In this paper, we extend the 3D use of the SSNR independently of the reconstruction algorithm. Computer simulations in a well-controlled environment, as well as results with real data, point out the validity of our extension. The image processing package Xmipp (Marabini et al., 1996) incorporates the resolution measure defined in this paper. The package can be found at http://www.cnb.uam.es/~bioinfo.
2. SSNR resolution assessment
2.1. Basic assumptions
Our data set consists of I independent projective views x(i)k,l, where the spatial location is indexed by (k,l). We make the standard assumption of an additive signal + noise model: X = S + ℕ, where S and ℕ denote the signal and noise components, respectively. Note that this assumption can also be treated as a definition: we may define the signal to be the explained portion of the data which is common to all measurements, and the noise to be the unexplained part (residue). Ideally, we would like the noise component to be due to random fluctuations only, but it can potentially also account for a whole variety of perturbing factors such as the presence of outliers and/or an incorrect estimation of the imaging geometry.
The second assumption is that the reconstruction process is linear in the sense that Rec{X} = Rec{S} + Rec{ℕ} (Rec{X} is the volume reconstructed from the data set X). We only require that this relation holds in the case when all the reconstruction parameters are the same. This is a quite reasonable hypothesis because the ray transform is a linear operator (Natterer and Wübbeling, 2001). Thus, any reasonable reconstruction algorithm that attempts to invert the ray operator should be linear as well.
2.2. Spectral signal-to-noise ratio
Our method estimates the relative energy contribution of the reconstructed signal and noise components (Rec{S} and Rec{ℕ}) by performing two independent computations. The first assesses the consistency between the input data and the 3D map produced by the tomographic reconstruction algorithm. The second deals exclusively with the effect of the algorithm on the noise component ℕ. Both types of estimates are combined into a global SSNR which characterizes the overall behavior of the system for the particular data set at hand.
2.2.1. Data consistency
Let , denote the 2D discrete Fourier transform of the input image . By convention, we use (K, L) as the spatial frequency indices. After determination of the relative orientations of the individual views, the tomographic reconstruction algorithm produces a 3D map of the underlying specimen. This 3D map (or model) is then used to generate a corresponding set of reprojected images with Fourier transforms ; these provide an estimate of the signal that is initially present in our data. By considering a region RΔω (ω) in Fourier space that corresponds to an annulus with central radial frequency ω and width Δω, we then calculate the input SSNR as
| (1) |
The numerator in (1) is an estimate of the signal power centered at frequency ω, while the denominator is a measure of the corresponding input noise energy (unexplained portion of the data). Thus, the ratio of both quantities yields an estimate of the SNR at the input of the system, that is, the SNR prior to 3D reconstruction.
2.2.2. Noise reduction factor
When I images are combined to yield a 3D reconstruction, there is some form of averaging involved which causes the noise to be reduced. To characterize this effect, we introduce the noise reduction factor of the algorithm, α(ω,Δω), which is typically not constant. The major difficulty here is that α(ω,Δω) depends on many application-specific parameters; for example, the type of tomographic algorithm used, the imaging parameters (angles), the type of symmetry (e.g., icosahedral), and the number of views. It is therefore very difficult in general to determine α(ω,Δω) analytically. Our solution is to estimate α(ω,Δω) empirically by injecting white Gaussian noise into the reconstruction algorithm with all parameters being the same as for X. Practically, this is equivalent to using the estimate
| (2) |
where ℕ now represents noise-only images, and where denotes the corresponding reprojection calculated from the noise-only 3D reconstruction map. It is important to use white noise at this step since the goal is to measure the attenuation introduced by the reconstruction algorithm. Therefore, all frequencies must be present in the same amount at the input of the system. Note that we have α(ω, Δω) ≈ ISSNR (ℕ; ω, Δω), except that there is no subtraction in the denominator because the underlying signal is zero by definition.
Unser et al. (1987) showed that the 2D SSNR in the absence of signal, which is the 2D analog of what in this paper is called α(ω,Δω), follows a central F-Snedecor distribution with r1 = nR and r2 = (I−1)nR degrees of freedom. There, nR is the number of elements participating in the annulus RΔω (ω). The variance of such a distribution is (Rade and Westergeren, 1999). Note that this variance tends to 2/r1 when the number of images tends to infinity, and to 0 when the number of points in the annulus tends to infinity. The statistical assumptions made for the derivation of this distribution are no longer valid in the 3D case and finding an analytical statistical distribution remains an open problem. However, these two cases are conceptually similar and one should still expect a smaller variance of α(ω, Δω) as the number of images or the annulus size increases.
2.2.3. SSNR estimate
Finally, we combine Eqs. (1) and (2) to obtain a measure of the true SSNR on the reconstructed signal
| (3) |
The main reason for subtracting 1 from the ratio is to produce an unbiased estimate. In particular, we want the SSNR to be zero when the data consists of noise only (i.e., X = ℕ). Note that (3) is the 3D extension of the 2D SSNR criterion for correlation averaging (Unser et al., 1987). In this former simpler case, α(ω, Δω) can be determined analytically; it is simply for any (ω, Δω).
As in this previous work, an operational resolution limit can be specified as the spatial frequency at which the SSNR falls below an acceptable baseline. Alternatively, we may also assess the quality of our 3D reconstruction by comparing the ISSNR curves for the two modalities: X (data = signal + noise) and ℕ (noise only).
2.3. Volumetric spectral signal-to-noise ratio
The 3D distribution of the SNR in the frequency space is strongly dependent on the angular distribution and might not be radially symmetric. An even angular distribution is a sufficient condition to guarantee a full coverage of the 3D Fourier space, although this condition is not necessary (Orlov, 1976). On the other extreme, experimental conditions might force an angular distribution with a strongly inhomogeneous frequency coverage. For instance, in random conical tilt (Radermacher, 1988), there is a region in Fourier space (missing cone) where no information is available. However, although in this region the SNR is zero, it is taken into account to compute the radial average implied by RΔω (ω).
Other parameters control the asymmetry of the SNR, like the number of projections from each direction. If a certain projection direction is more populated than others, then the resolution in this direction should be larger since more information is available.
The previous SSNR formulas can be applied to perform individual SSNR estimations specific to each projection image by simply setting RΔω (ω) = ω, instead of an annulus as was done in the previous section. In this way for each input projection x(i), we can associate an individual SSNR(i) defined as
| (4) |
where
Note that SSNR(i) is a real-valued image defined in Fourier space. The central-slice theorem (Natterer and Wübbeling, 2001) states that the 2D Fourier transform of a ray projection of a volume is one of the slices of the 3D Fourier transform of that volume. We make use of this theorem to fit the set of images {SSNR(i); i = 1,…,N} by a real-valued volume in Fourier space, VSSNR(ω). This volume provides an estimate of the SNR frequency distribution.
For the volumetric interpolation in Fourier space, we approximate the volume VSSNR by a finite series expansion of the form
| (5) |
where ω is the frequency at which this volume is approximated, ωj are fixed points distributed in a homogeneous grid, b is a basis function, and the cjs are the coefficients of the expansion. Following Matej and Lewitt (1995) and Matej and Lewitt (1996), we use generalized Kaiser–Bessel window functions as the basis function b distributed over a body-centered cubic grid (BCC). Criteria for the selection of the blob parameters are given in the Appendix A.
We find VSSNR(ω) as the solution of the equation system
| (6) |
where is the frequency in the 3D Fourier space of the sample (K,L) of the image SSNR(i). This frequency is given by the central-slice theorem.
Due to the huge dimensions of this equation system, we solve it in an iterative fashion using the Block Algebraic Reconstruction Technique (Herman, 1998), where each block is defined by the equations corresponding to the same image SSNR(i).
Penczek (2002) also proposed the use of this volumetric SSNR although its computation was restricted to the class of tomographic algorithms that reconstruct by explicit interpolation in Fourier space. In that work it was shown that anisotropic low-pass filters could be specifically tailored to the spectral distribution of the information. It was also proposed to use the 3D inertia matrix to determine the directions of maximal and minimal amount of information. These techniques are still applicable to our VSSNR(ω) volume.
3. Results
Several experiments were carried out to check the validity of our resolution measure. Computer simulations in a well-controlled environment were performed to show the applicability of the SSNR in relevant situations. Then, the SSNR was tested on experimental electron-microscopy data. In particular, we used the cryo-negative staining data of GroEL obtained by De Carlo et al. (2002) versus reprojection). This particle was selected because its atomic model is available; therefore, the quality of the reconstruction can also be established objectively.
3.1. Computer-simulated experiments
Computer-simulated experiments were carried out according to the following scheme: starting from a known volume called phantom, projection images are simulated. These images are input to a tomographic algorithm producing a 3D reconstruction. The quality of this reconstruction is assessed by comparison with the phantom.
The Halobacterium halobium bacteriorhodopsin trimer was taken as phantom from the Macromolecular Structure Database (Protein Quaternary Structure query, PQS, Boutselakis et al., 2003) (PQS entry: 1BRD, Henderson et al., 1986). ART + blobs (Marabini et al., 1998) was used as reconstruction algorithm. The threefold symmetry of the bacteriorhodopsin was not explicitly used during the reconstruction.
The computation of the FSC is performed by direct comparison of the phantom with the reconstruction. Since the ideal volume is available, this comparison is no longer a reproducibility measure but a true resolution estimation. From now on, we will refer to this measure as Reference FSC (FSCref). Furthermore, there is no need to split the experimental image set in two halves. The FSC between two independent reconstructions is referred to in this paper as FSC.
The sampling rate in Fourier space for all the simulated experiments was 0.005 Å−1. The width Δω of the annulus RΔω (ω) was taken as 0.020 Å−1.
3.1.1. Resolution estimation
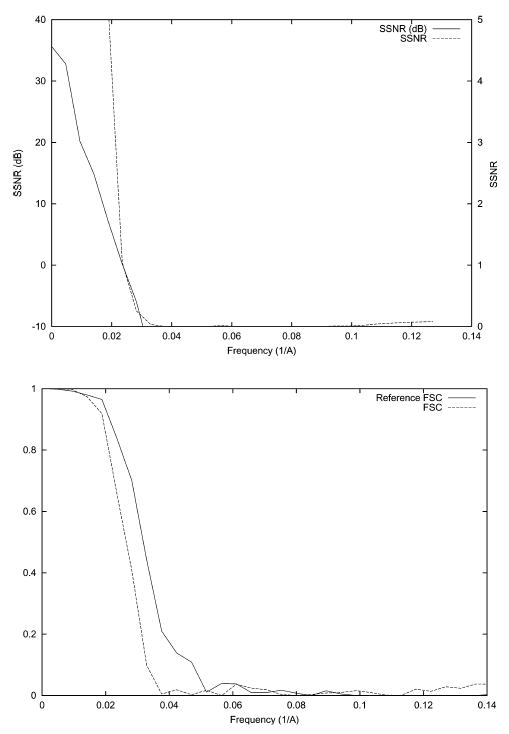
In this experiment, we test the ability of SSNR to establish the resolution of a reconstruction. A nearly even angular distribution with 1000 images (see Fig. 1) was simulated. White Gaussian noise was added to the ideal projection images to achieve an average SNR of approximately 1/3. The corresponding SSNR, FSC, and FSCref are represented in Fig. 2. Note that the magnitude of the FSC is substantially below that of the FSCref. The resolution at SNR = 1 as computed by SSNR is 1/25 Å−1. This frequency implies a threshold of 0.75 in the FSCref and 0.38 in the FSC. Common thresholds for the FSC are 0.5 which is known to be conservative, and 0.3 which is currently the most used. The resolution at a FSC threshold of 0.5 is 1/31 Å−1 and at a threshold of 0.3 is 1/22 Å−1. These resolutions are achieved by the SSNR curve at thresholds 1.82 (>1) and 0.63 (<1). These SSNR thresholds are in agreement with the fact that the FSC threshold 0.5 is conservative, although 0.3 seems to be a little bit optimistic.
Fig. 1.
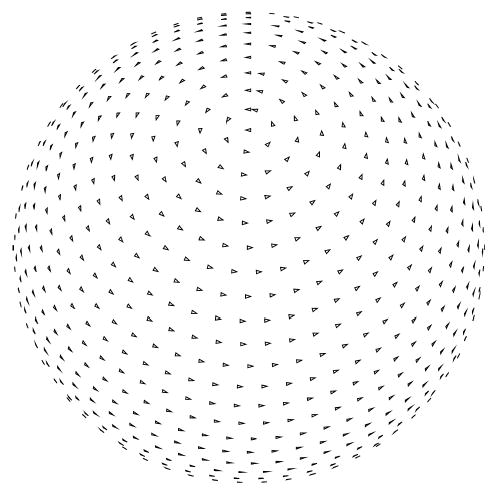
Nearly even angular distribution. A small triangle is placed at the tip of the unit vectors representing each projection direction. The in-plane rotation angle is represented by the relative rotation of each triangle. The separation between projections for this distribution is approximately 6°.
Fig. 2.
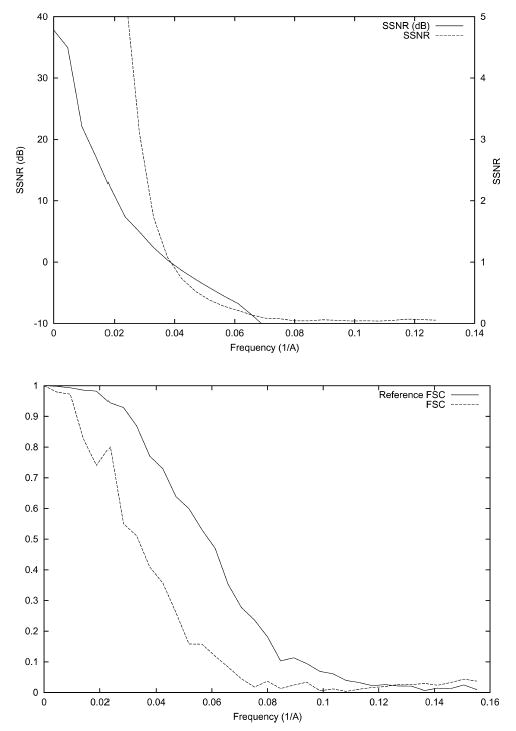
SSNR (top), FSC, and FSCref (bottom) of the reconstruction of the bacteriorhodopsin from simulated data with an even angular distribution. The SSNR is also shown in logarithmic scale (dB) according to the formula SSNR(dB) = 10log10 (SSNR).
We performed the same reconstruction using Weighted Back-Projection [WBP, Radermacher (1992)]. The estimated resolution using SSNR at SNR = 1 was 1/25 Å−1. At this frequency, the values of FSCref and FSC were 0.81 and 0.42, respectively. The resolution estimate for the cutoff value FSC = 0.5 was 1/28.6 Å−1. The threshold limit FSCref = 0.75 yields the value 1/22 Å−1. In both cases, the resolutions estimated by the SSNR and the FSC seem to be an under-estimation of the resolution computed by the FSCref.
3.1.2. Variability of SSNR
Our resolution measure uses an estimate of the attenuation factor at each frequency. This attenuation is established by injecting white Gaussian noise into the reconstruction algorithm while keeping the remaining parameters (angular distribution, reconstruction free parameters, …) the same. It is interesting to know whether this attenuation is reliably estimated. In this experiment, we compute the attenuation factor α(ω, Δω) for the previous experiment after injecting different noise realizations. Fig. 3 shows the plot of α(ω,Δω) versus frequency for 10 different noise realizations.
Fig. 3.
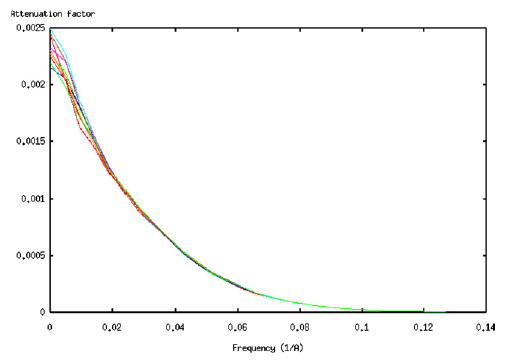
Different realizations of the attenuation factor for the angular distribution of Fig. 1.
3.1.3. Simulations with geometrical errors
Although image noise is one of the error sources in single particle EM, it is not the most limiting factor since its effect can be easily removed by the incorporation of more images into the reconstruction process. Geometrical errors coming from uncertainties in the projection direction and position of the image center severely affect the achievable resolution (Penczek et al., 1994). In this experiment, projection images are computed according to the even angular distribution shown in Fig. 1. However, we supply the reconstruction algorithm with noisy angular information. In particular, we add Gaussian noise with zero mean and a standard deviation of 5° to the Euler angles defining the projection directions. The perturbed angular distribution is shown in Fig. 4. The particle origin is also randomly shifted horizontally and vertically. The shift in both directions follows a normal distribution with zero mean and a standard deviation of 6.54 Å. White Gaussian noise was added to the ideal projection images to achieve an average SNR of approximately 1/3. The corresponding SSNR, FSC, and FSCref are shown in Fig. 5. The resolution at SNR = 1 as computed by SSNR is 1/42 Å−1. The reference resolution at FSCref = 0.75 is 1/38 Å−1. Finally, the resolution at FSC = 0.5 is 1/38 Å−1 and at FSC = 0.3 is 1/34 Å−1.
Fig. 4.
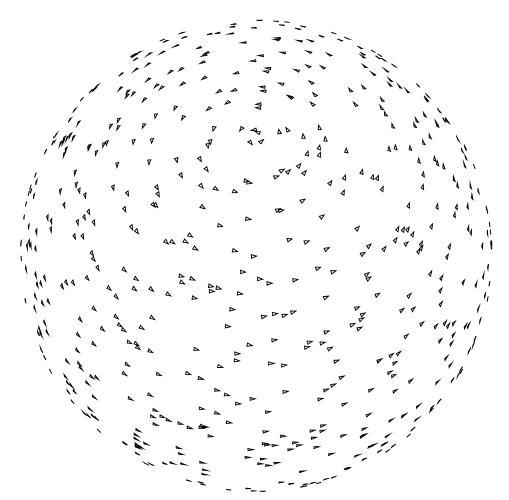
Even angular distribution perturbed by angular noise. A random number (normally distributed with zero mean and standard deviation 5°) is added to each of the three Euler angles describing the projection directions in Fig. 1.
Fig. 5.
SSNR (top), FSC, and FSCref (bottom) of the reconstruction of the bacteriorhodopsin from simulated data with a perturbed angular distribution. The SSNR is also shown in logarithmic scale (dB) according to the formula SSNR(dB) = 10log10 (SSNR).
3.1.4. Simulations with CTF
EM images are subjected to microscope aberrations that also affect the maximum resolution achievable (Frank, 2002). In this experiment, we consider the effect of the contrast transfer function (CTF) of the microscope. We have simulated a CTF with the following parameters: accelerating voltage = 200 kV, defocus = −2.8 μm, spherical aberration = 2 mm, convergence cone = 0.21 mrad (Velázquez-Muriel et al., 2003) (see Fig. 6). The angular distribution is even (see Fig. 1) and a SNR of 1/3 was simulated. The corresponding SSNR, FSC, and FSCref are shown in Fig. 7. The resolution at SNR = 1 as computed by SSNR is 1/31 Å−1. The reference resolution at FSCref = 0.75 is 1/30 Å−1 Finally, the resolution at FSC = 0.5 is 1/30 Å−1 and at FSC = 0.3 is 1/29 Å−1. The first zero of the CTF is at 1/27 Å−1.
Fig. 6.
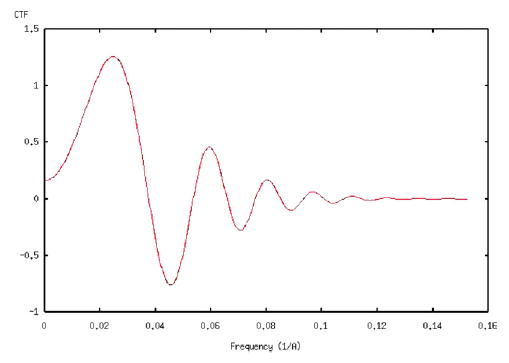
Radial profile of the contrast transfer function used for computer simulations.
Fig. 7.
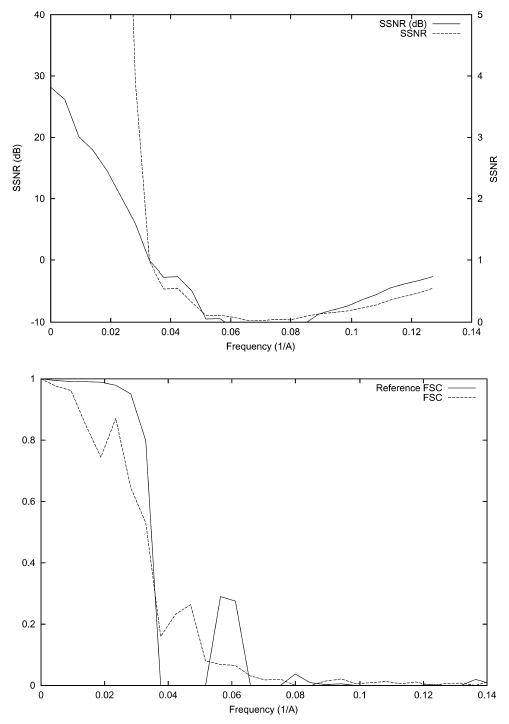
SSNR (top), FSC, and FSCref (bottom) of the reconstruction of the bacteriorhodopsin from simulated data with an even angular distribution when the microscope aberrations are simulated. The SSNR is also shown in logarithmic scale (dB) according to the formula SSNR(dB) = 10log10 (SSNR).
3.1.5. Volumetric SSNR
To check the usefulness of the volumetric SSNR, three experiments were carried out. They all simulate the CTF previously described and the SNR is 1/3. Three different angular distributions were used: even (Fig. 1), uneven (Fig. 8), and uneven distribution with a missing cone (Fig. 9). Each distribution has 1000 different projection directions. The blobs and grid used for the volumetric interpolation were those referred to as “standard blob” in Matej and Lewitt (1996). Its interpolating properties are described by Matej and Lewitt (1996) and Garduño and Herman (2001). The Appendix provides some guidelines for its use. Isosurfaces of the resulting volumetric SSNRs are shown in Fig. 10. Two isosurfaces are shown on each graph, one corresponding to SNR = 1 and another to SNR = 4. Notice the relationship between the SSNR isosurface shape and the angular distribution: the even distribution has a nearly isotropic SSNR (i.e., the resolution achieved in each direction is approximately the same), the uneven distribution shows larger SSNR in the plane perpendicular to the projection direction more populated (the resolution in the directions lying in the horizontal plane are larger than in other directions), and the uneven distribution with a missing cone shows a region of missing information aligned with the missing cone (very little resolution is achieved in those directions within the missing cone).
Fig. 8.
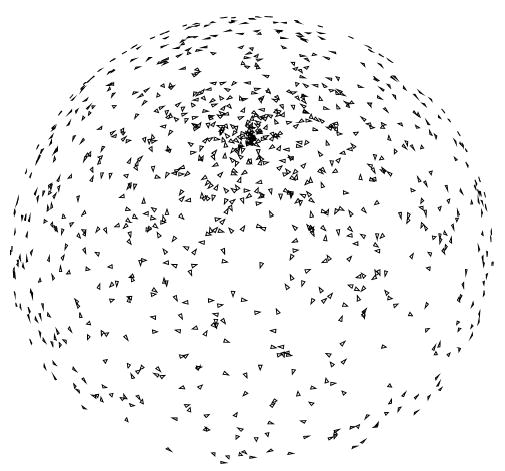
Uneven angular distribution. Projections are randomly distributed on the projection space although top views are more frequent than lateral ones.
Fig. 9.
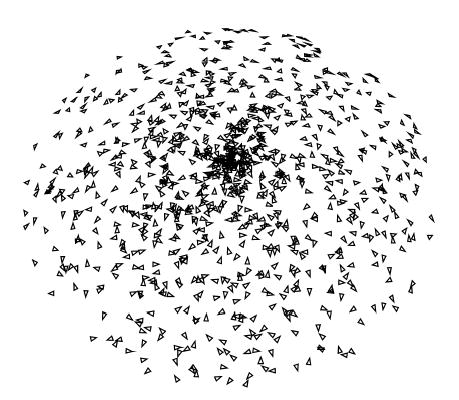
Uneven distribution with a missing cone. Projections are distributed randomly on the projection space. Top views are more frequent and no projection is taken with a tilt angle greater than 45°.
Fig. 10.
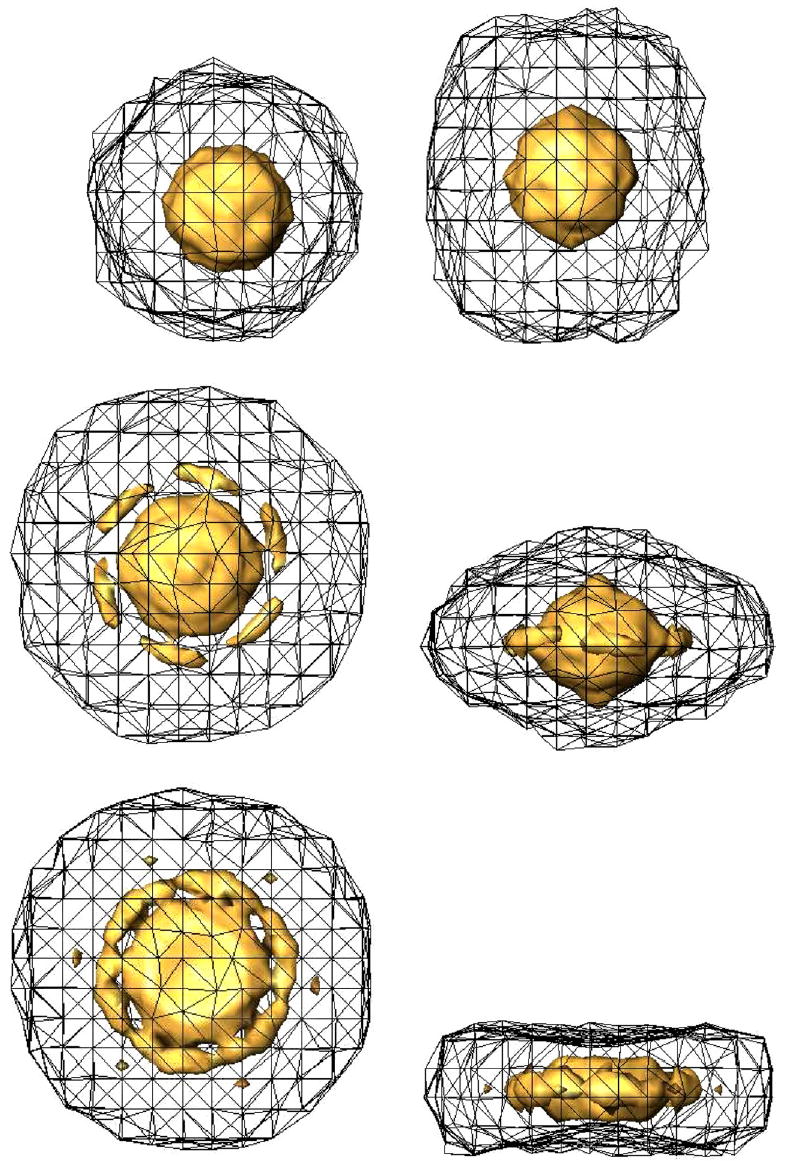
Top and side view of the volumetric SSNR for the reconstruction of bacteriorhodopsin from simulated data using an even (top), an uneven (middle), and an uneven distribution with a missing cone (bottom). The mesh corresponds to the isosurface of SSNR = 1. The solid isosurface corresponds to a SSNR = 4.
3.1.6. Tomographic experiment
An interesting question is whether this methodology can be applied to the reconstruction of a few projections. The question is important because it refers to electron tomography of non-repeatable structures like cells. To test this end, we simulated a cross-section slice of an organelle with small proteins inside in arbitrary positions and orientations (see Fig. 11). One hundred and twenty images were taken in a single-axis tilt series with tilt angles evenly distributed between −60° and 60°. Two iterations (over the whole data set) of ART + blobs were employed for this reconstruction with a relaxation factor of 0.2 and 0.1, respectively. The corresponding VSSNR is shown in Fig. 12. The missing wedge can be seen in the top view. A striking feature is that the resolution is strongly anisotropic. It has much higher resolution in the direction of the tilt axis than elsewhere. This is because the reconstructed volume shows a high level of details at the tilt axis (notice the sharp transition at the organelle wall). In fact, the sinc-like envelope observed in the side view stems from the organelle wall. The resolution in a direction perpendicular to the tilt axis is about 209 Å, while the resolution along the tilt axis can be as high as 7 Å (the sampling rate was set to 3.27 Å). Of course, this high resolution is only achieved in the tilt axis. This points out a disadvantage of the VSSNR methodology when applied to electron tomography: it does not show the local resolution. In fact, this is a drawback of any Fourier-based measure because of the tradeoff between spatial and frequency resolution (Mallat, 1999).
Fig. 11.
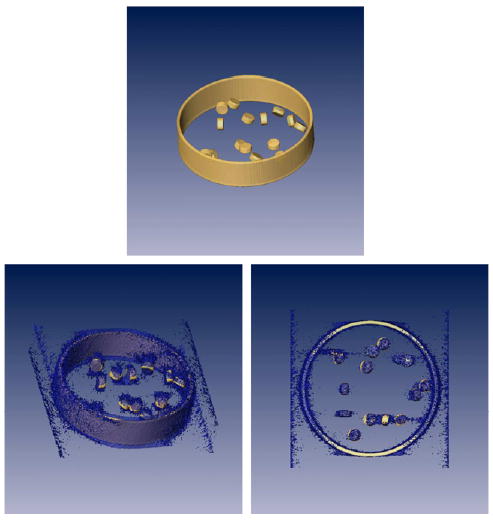
(Top) Isosurface of a phantom simulating a cross-section of an organelle with a set of proteins at random orientations. (Bottom) Tomographic reconstruction of the phantom at two different orientations. On the right image it can be seen that the organelle wall is very well defined along the tilt axis (vertical axis of this image) while there is a huge uncertainty along the perpendicular direction (horizontal axis of this image).
Fig. 12.
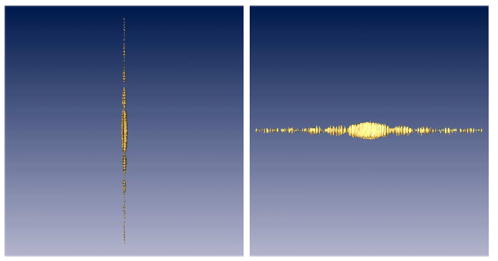
Top and side view of the volumetric SSNR for the tomographic reconstructions. The isosurface correspond to a SSNR = 1.
3.2. Results on experimental data
To test the applicability of the proposed resolution measure to experimental electron-microscopy data, the cryo-negative micrographs of GroEL taken by (De Carlo et al., 2002) were used. 2610 projection images were involved. The GroEL has two rotational symmetry axis: one of order 7 around the vertical axis and another one of order 2 around a lateral axis. This implies that every projection image is identical to other 13 (7 × 2 − 1) views. Symmetry was explicitly taken into account during the reconstruction process; thus, 36540 (2610 × 14) images were used. The reconstruction was performed with ART + blobs (Marabini et al., 1998) and was based on an angular assignment (Penczek, 2002) with a sampling step of 3°. The X-ray model of GroEL available in PDB [Berman et al. (2000), PDB entry: 1GRL, Braig et al. (1994, 1995)] was used as phantom for the computation of the FSCref. Fig. 13 shows the corresponding SSNR, the FSC, and FSCref. The resolution at SNR = 1 as computed by SSNR is 1/26 Å−1, while the resolution at FSCref = 0.75 is 1/36 Å−1. The resolution at a threshold of FSC = 0.5 is 1/22 Å−1 and at FSC = 0.3 is 1/17 Å−1. (The sampling rate in Fourier space is 0.004 Å−1 and the width Δω of the annulus RΔω (ω) was taken as 0.016 Å−1.) Finally, the volumetric SSNR was computed using the same blobs as for the computer-simulated experiments. The VSSNR is shown in Fig. 14. The non-uniform distribution of the volumetric SSNR can be explained by the uneven distribution of the tilt angle, see Fig. 15.
Fig. 13.
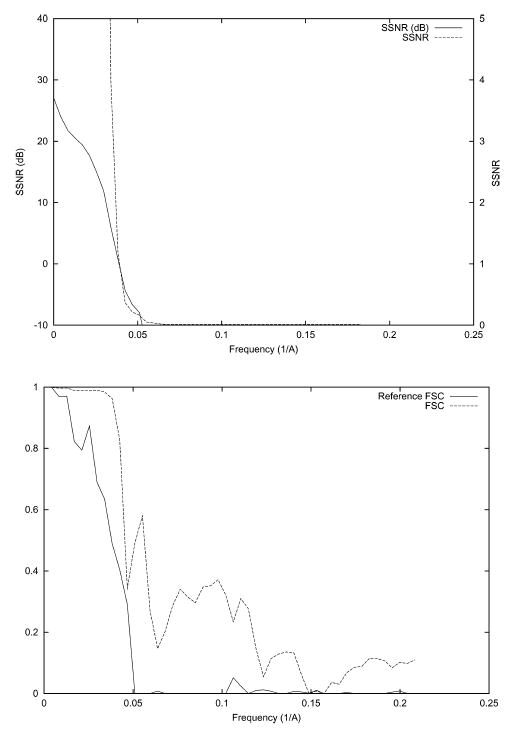
SSNR (top), FSC, and FSCref (bottom) of the reconstruction of GroEL using experimental cryo-microscopy data when compared with the X-ray model of GroEL. The SSNR is also shown in logarithmic scale (dB) according to the formula SSNR(dB) = 10log10 (SSNR).
Fig. 14.
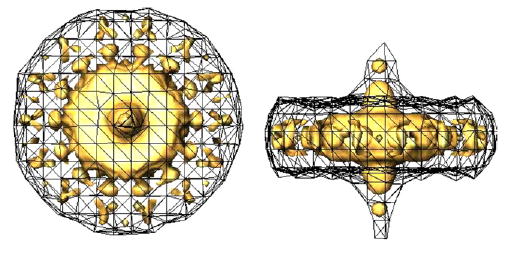
Top and side view of the volumetric SSNR for the reconstruction of GroEL using experimental cryo-microscopy data. The mesh corresponds to the isosurface of SSNR = 1. The solid isosurface corresponds to a SSNR = 4.
Fig. 15.
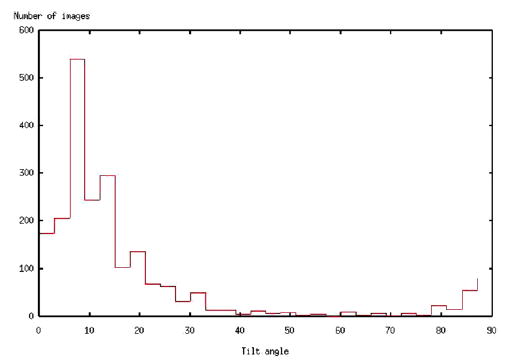
Histogram of the tilt angle of the 2160 GroEL experimental images.
4. Discussion
One of the most distinctive features of the proposed method of resolution assessment is that it explicitly takes into account the noise-reduction effect of the reconstruction algorithm. A very natural temptation would be to analytically derive such noise statistics from a mathematical description of the algorithm. Unfortunately, the chances of success of a deductive approach are extremely slim because there are far too many parameters involved. In addition, it is often very difficult for the end user to have a precise description of the algorithm that he/she is using. What we propose instead, is to perform a noise-only experiment to measure the performance of the algorithm in a given configuration. This is perhaps the simplest and most universal solution to the problem. It is applicable to any situation without requiring any knowledge of the inner working of the algorithm which is considered as a black box and which is assumed to be linear. Its only drawback is that it requires some more computer runs.
The basis for this method is to check for the consistency between the reconstructed map and the input data (note that for doing this the volume gray values must be such that the reprojected images have gray values in the same range as the experimental images). In this sense, the proposed criterion goes beyond the standard reproducibility tests which are commonly used in the field. It provides an objective assessment of the quality of the reconstruction algorithm itself by looking at the consistency between the result and the input data. Most iterative reconstruction methods are based on a similar consistency principle. Because the underlying problem is linear, they typically iterate by refining residues until convergence to a solution that minimizes the difference between the reprojected map and the input data.
The SSNR has a simple intuitive interpretation. It leads to a very natural threshold-based definition of the resolution limit. SSNR also provides us with a fine characterization of the quality of the reconstruction as a function of the radial frequency. The bottom line is that we will only trust those signal frequency components whose energy is above what would have been obtained if the algorithm was applied to noise only.
The SSNR allows one to use the full set of images to perform the reconstruction; there is no need to divide the data into two subsets with the subsequent lost of resolution.
Even though the computation is performed in 2D, the SSNR is easily interpreted in 3D as shown by the volumetric SSNR. In this extension to 3D, the anisotropy (dependency with the direction) of the angular distribution is explicitly taken into account so that projection directions with more views have a higher noise attenuation factor. In this way, the information provided by VSSNR volume is very helpful to understand the relationship between the angular distribution and the resolution achieved in each direction. (Some directions might have been better represented or completely ignored in the projection set.) This results in an uneven SSNR distribution that is easily detected by our measure. This anisotropy can be later used to build tailored lowpass filters as proposed by Penczek (2002).
The application of the VSSNR methodology to electron tomography data shows that it is possible to define a directional resolution measure for this kind of data. We found the VSSNR (and hence the resolution) to be maximal in the direction of the tilt axis, which is consistent with what our expectations. In principle, one would also expect the resolution along this axis to be the highest in the central region where the projection rays are the densest. Unfortunately, this cannot be assessed from the present spectral analysis since the Fourier transform has no spatial localization at all. Finding a way to estimate the resolution locally would be extremely valuable for electron tomography. This is an important open problem which will undoubtedly require some kind of compromise because of the fundamental limits imposed by the uncertainty principle.
In terms of computational effort, the computation of VSSNR amounts for two extra reconstructions. First, a reconstruction with pure noise under the very same conditions as the data must be performed. Then, the reconstruction from the experimental data and the noisy reconstruction are input into Eq. (4) that needs to perform one projection of each volume for each experimental image at hand. Finally, the interpolation indicated in Eq. (6) needs be performed.
The experiments showed that the resolution estimates obtained by SSNR are usually quite comparable to those obtained by FSCref with a threshold of 0.75 and a FSC threshold between 0.5 and 0.3 (the corresponding estimates are typically within a distance of 1 Fourier sample.) However, when the FSC is used as a consistency measure, very high FSC values can be expected as the number of projections taken into account grows (Grigorieff, 2000). The interpretation of these high values in terms of resolution is more difficult since standard thresholding rules do not hold and their application can be certainly misleading as shown in the experiment of Section 3.1. Furthermore, a priori knowledge such as molecule surface, mass, or symmetry, can be explicitly taken into account in current tomographic algorithms (Sorzano et al., 2002). This a priori information highly increases the consistency between two independent reconstructions. These two facts make it difficult to select a FSC threshold that defines the volume resolution. However, SSNR still maintains a clear meaning and the threshold can still be stated in terms of the desired SNR.
The discrepancy between the resolution for GroEL estimated by SSNR (1/26 Å−1) or FSC (1/22 Å−1) and the FSCref (1/36 Å−1) may be caused by the disagreement between the particle conformation when it is crystallized and when it is studied as a single particle. In any case, the previously reported resolution (1/14 Å−1) seems to be an overestimation; although the work’s main purpose was not the achievement of the highest resolution of GroEL in solution (De Carlo et al., 2002).
5. Conclusions
We extended the use of the 3D SSNR in single-particle electron microscopy. This measure was already introduced in 3D by Unser et al. (1996) and was further developed by Penczek (2002). We have generalized the class of tomographic algorithms to which it can be applied by following a black-box approach. This generalization easily allows the estimation of the frequency distribution of the signal-to-noise ratio, a piece of information that is very useful to structural biologists.
Acknowledgments
Partial support is acknowledged to the “Comunidad de Madrid” through project CAM-07B-0032-2002, the “Comisión Interministerial de Ciencia y Tecnología” of Spain through projects BIO2001-1237, BIO2001-4253-E, BIO2001-4339-E, BIO2002-10855-E, the Euro-pean Union through Grants QLK2-2000-00634, QLRI-2000-31237, QLRT-2000-0136, QLRI-2001-00015, and to the NIH through Grant 1R01HL67465-01. Partial support is also acknowledged to the “Universidad San Pablo-CEU” through project 17/02. The authors thank Dr. A.C. Steven for useful discussions during the early stages of the work and for comments on the manuscript.
Appendix A. Selection of a blob for a series expansion
A.1. Space series expansion
We shall study here what is the maximum signal frequency that can be safely reconstructed by a series expansion on a BCC grid using a particular blob.
A BCC grid can be represented (Herman, 1998) as the set of points
where g is the distance between two consecutive samples on the same axis. Let f(r), r ∈ ℝ3 be a three-dimensional function and let represent its samples on the lattice GBCC. Then the Fourier transform is formed by replicas of the Fourier transform of f at the points of the reciprocal lattice of GBCC. The reciprocal lattice of a BCC grid is a Face Centered Cubic grid (FCC) given by
Note that . The smallest distance between two replicas in the reciprocal grid is .
The samples are convolved with the blob function to build an approximation of the function to be reconstructed. Blobs are radial functions that are compactly supported and, therefore, infinitely extended in the Fourier domain. The Kaiser–Bessel window function (Kaiser, 1966), which is an approximation (van De Ville et al., 2002) of the zeroth order spheroidal wave function (Slepian and Pollak, 1961), has the property of maximally compacting the energy in Fourier space. For this reason, they can be thought of as “practically band-limited.” Let us call ωbmax the “effective” bandwidth of the blob function and ωmax the bandwidth of the signal f. Since the distance between two consecutive samples in the reciprocal space is then, to have an “effective” alias-free sampling, it must hold that .
In the particular case of using “standard blobs” (Matej and Lewitt, 1996), where Ts is the sampling rate of the images expressed in Å per pixel. For this blob we select ωbmax = 1/Ts since above this frequency, the signal is attenuated more than 70 dB; therefore, . This means that we cannot recover signals with details smaller than 1.37 Ts without aliasing.
A.2. Fourier series expansion
Following a similar reasoning, if we sample the Fourier space using blobs on a BCC grid, then must hold. In the previous formula Tmax is the maximum size of the particle being studied, G is the distance between two consecutive blobs in the same axis (this time in Fourier space), and Tbmax is the maximum size of the inverse Fourier transform of a blob located in the Fourier origin.
If we particularize for “standard blobs” then where TsF is the sampling rate in Fourier space. (For simplicity we assume that the sampling rate is the same in all directions.) On the other hand, TsF = 1/Ta where Ta is the space available for the volume, i.e., Ta = XdimTs where Ts is the sampling rate in the image space in Å per pixel and Xdim is the length in voxel units of the volume available to represent the particle at hand. Under these conditions , or what is the same, the particle diameter should not exceed the 74% of the available length in any of the directions.
References
- Baumeister W, Steven A. Macromolecular electron microscopy in the era of structural genomics. Trends Biochem Sci. 2000;25:624–631. doi: 10.1016/s0968-0004(00)01720-5. [DOI] [PubMed] [Google Scholar]
- Berman H, Westbrook J, Feng Z, Gilliland G, Bhat T, Weissig H, Shindyalov I, Bourne P. The protein data bank. Nucleic Acids Res. 2000;28:235–242. doi: 10.1093/nar/28.1.235. [DOI] [PMC free article] [PubMed] [Google Scholar]
- Boutselakis H, Dimitropoulos D, Fillon J, Golovin A, Henrick K, Hussain A, Ionides J, John M, Keller PA, Krissinel E, McNeil P, Naim A, Newman R, Oldfield T, Pineda J, Rachedi A, Copeland J, Sitnov A, Sobhany S, Suarez-Uruena A, Swaminathan J, Tagari M, Tate J, Tromm S, Velankar S, Vranken W. E-MSD: the european bioinformatics institute macromolecular structure database. Nucleic Acids Res. 2003;31:458–462. doi: 10.1093/nar/gkg065. [DOI] [PMC free article] [PubMed] [Google Scholar]
- Braig K, Adams PD, Brunger AT. Conformational variability in the refined structure of the chaperonin GroEL at 2.8 Å resolution. Nat Struct Biol. 1995;2:1083–1094. doi: 10.1038/nsb1295-1083. [DOI] [PubMed] [Google Scholar]
- Braig K, Otwinowski Z, Hegde R, Boisvert DC, Joachimiak A, Horwich AL, Sigler PB. The crystal structure of the bacterial chaperonin GroEL at 2.8 Å. Nature. 1994;371:578–586. doi: 10.1038/371578a0. [DOI] [PubMed] [Google Scholar]
- Conway JF, Trus BL, Booy FP, Newcomb WW, Brown JC, Steven AC. The effects of radiation damage on the structure of frozen hydrated hsv-1 capsids. J Struct Biol. 1993;111:222–233. doi: 10.1006/jsbi.1993.1052. [DOI] [PubMed] [Google Scholar]
- De Carlo S, El-Bez C, Alvarez-Rúa C, Borge J, Dubochet J. Cryo-Negative staining reduces electron-beam sensitivity of vitrified biological particles. J Struct Biol. 2002;138:216–226. doi: 10.1016/s1047-8477(02)00035-7. [DOI] [PubMed] [Google Scholar]
- Ellis M, Hebert H. Structure analysis of soluble proteins using electron crystallography. Micron. 2001;32:541–550. doi: 10.1016/s0968-4328(00)00049-4. [DOI] [PubMed] [Google Scholar]
- Frank J. Single-Particle imaging of macromolecules by cryo-electron microscopy. Ann Rev Biophys Biomol Struct. 2002;31:303–319. doi: 10.1146/annurev.biophys.31.082901.134202. [DOI] [PubMed] [Google Scholar]
- Garduño, E., Herman, G.T., 2001. Optimization of basis functions for both reconstruction and visualization. In: Sébastien Fourey, G.T.H., Kong, T.Y. (Eds.), Electronic Notes in Theoretical Computer Science, vol. 46. Elsevier Science, Amsterdam.
- Grigorieff N. Resolution measurement in structures derived from single particles. Acta Crystallogr D. 2000;56:1270–1277. doi: 10.1107/s0907444900009549. [DOI] [PubMed] [Google Scholar]
- Harauz G, van Heel M. Exact filters for general geometry three dimensional reconstruction. Optik. 1986;73:146–156. [Google Scholar]
- Henderson R. The potential and limitations of neutrons, electrons and x-rays for atomic resolution microscopy of unstained biological molecules. J Mol Biol. 1995;247:726–738. doi: 10.1017/s003358350000305x. [DOI] [PubMed] [Google Scholar]
- Henderson R, Baldwin JM, Downing K, Lepault J, Zemlin F. Structure of purple membrane from Halobacterium halobium: recording, measurement and evaluation of electron micrographs at 3.5 Å resolution. Ultramicroscopy. 1986;19:147–178. [Google Scholar]
- Herman, G.T., 1998. Algebraic reconstruction techniques in medical imaging. In: Leondes, C.T. (Ed.), Medical Imaging, Systems Techniques and Applications. Gordon and Breach Science Publishers, Amsterdam, pp. 1–42.
- Herman, G.T., 1998. Geometry of Digital Spaces. Birkhauser, Boston.
- Kaiser, J.F., 1966. Digital filters. In: Kuo, F.F., Kaiser, J.F. (Eds.), System Analysis by Digital Computers. Wiley, New York, pp. 218–285.
- Kessel M, Radermacher M, Frank J. The structure of the stalk layer of a brine pond microorganism: correlation averaging applied to a double layered structure. J Microsc. 1985;139:63–74. doi: 10.1111/j.1365-2818.1985.tb04662.x. [DOI] [PubMed] [Google Scholar]
- Mallat, S., 1999. A wavelet tour of signal processing. Academic Press, Amsterdam.
- Marabini R, Herman GT, Carazo JM. 3D reconstruction in electron microscopy using ART with smooth spherically symmetric volume elements (blobs) Ultramicroscopy. 1998;72:53–65. doi: 10.1016/s0304-3991(97)00127-7. [DOI] [PubMed] [Google Scholar]
- Marabini R, Masegosa IM, San Martín MC, Marco S, Fernández JJ, de la Fraga LG, Vaquerizo C, Carazo JM. Xmipp: an image processing package for electron microscopy. J Struct Biol. 1996;116:237–240. doi: 10.1006/jsbi.1996.0036. [DOI] [PubMed] [Google Scholar]
- Matej S, Lewitt RM. Efficient 3Dgrids for image reconstruction using spherically-symmetric volume elements. IEEE Trans Nucl Sci. 1995;42:1361–1370. doi: 10.1109/42.481442. [DOI] [PubMed] [Google Scholar]
- Matej S, Lewitt RM. Practical considerations for 3-Dimage reconstruction using spherically symmetric volume elements. IEEE Trans Med Imaging. 1996;15:68–78. doi: 10.1109/42.481442. [DOI] [PubMed] [Google Scholar]
- Natterer, F., Wübbeling, F., 2001. Mathematical methods in image reconstruction. SIAM, Philadelphia.
- Orlov S. Theory of three-dimensional reconstruction. Conditions for a complete set of projections. Sov Phys Crystallogr. 1976;20:312–314. [Google Scholar]
- Penczek P. Three-dimensional spectral signal-to-noise ratio for a class of reconstruction algorithms. J Struct Biol. 2002;138:34–46. doi: 10.1016/s1047-8477(02)00033-3. [DOI] [PubMed] [Google Scholar]
- Penczek PA, Grasucci RA, Frank J. The ribosome at improved resolution: new techniques for merging and orientation refinement in 3D cryo-electron microscopy of biological particles. Ultramicroscopy. 1994;53:251–270. doi: 10.1016/0304-3991(94)90038-8. [DOI] [PubMed] [Google Scholar]
- Penzcek P. Appendix: measures of resolution using Fourier shell correlation. J Mol Biol. 1998;280:115–116. [Google Scholar]
- Rade, L., Westergeren, B., 1999. Mathematics handbook for science and engineering, fourth ed. Springer-Verlag, Berlin.
- Radermacher M. Three-Dimensional reconstruction of single particles from random and nonrandom tilt series. J Electron Microsc Tech. 1988;9:359–394. doi: 10.1002/jemt.1060090405. [DOI] [PubMed] [Google Scholar]
- Radermacher, M., 1992. Weighted back-projection methods. In: Frank, J. (Ed.), Electron Tomography. Plenum, New York, pp. 91–115.
- Rosenthal PB, Henderson R. Optimal determination of particle orientation, absolute hand, and contrast loss in single particle electron-cryomicroscopy. J Mol Biol. 2003;333:721–745. doi: 10.1016/j.jmb.2003.07.013. [DOI] [PubMed] [Google Scholar]
- Ruprecht J, Nield J. Determining the structure of biological macromolecules by transmission electron microscopy, single particle analysis and 3D reconstruction. Prog Biophys Mol Biol. 2001;75:121–164. doi: 10.1016/s0079-6107(01)00004-9. [DOI] [PubMed] [Google Scholar]
- Sali A, Glaeser R, Earnest T, Baumeister W. From words to literature in structural proteomics. Nature. 2003;422:216–225. doi: 10.1038/nature01513. [DOI] [PubMed] [Google Scholar]
- Saxton WO, Baumeister W. The correlation averaging of a regularly arranged bacterial envelope protein. J Microsc. 1982;127:127–138. doi: 10.1111/j.1365-2818.1982.tb00405.x. [DOI] [PubMed] [Google Scholar]
- Slepian D, Pollak HO. Prolate spheroidal wave functions, Fourier analysis and uncertainty. I Bell Systems Tech J. 1961;40:43–64. [Google Scholar]
- Sorzano, C.O.S., Marabini, R., Herman, G.T., Carazo, J.M., 2002. Volumetric constraints in 3D tomography applied to electron microscopy. In: Proc. of the 1st International Symposium on Biomedical Imaging. Washington, USA, pp. 641–644.
- Unser M, Trus B, Steven A. A new resolution criterion based on spectral signal-to-noise ratio. Ultramicroscopy. 1987;23:39–52. doi: 10.1016/0304-3991(87)90225-7. [DOI] [PubMed] [Google Scholar]
- Unser, M., Vrhel, M.J., Conway, J.F., Gross, M., Thévenaz, P., Steven, A.C., Trus, B.L., 1996. Resolution assessment of 3D reconstructions by spectral signal-to-noise ratio. In: Proc. of the 11th European Congress on Microscopy (EUREM’96). Dublin, Eire, pp. 260–261.
- van De Ville D, Philips W, Lemahieu I. On the n-dimensional extension of the discrete prolate spheroidal window. IEEE Signal Process Lett. 2002;9:89–91. [Google Scholar]
- van Heel M. Similarity measures between images. Ultramicroscopy. 1987;21:95–100. [Google Scholar]
- van Heel, M., Hollenberg, J., 1980. The stretching of distorted images of two-dimensional crystals. In: Baumeister, W. (Ed.), Electron Microscopy at Molecular Dimensions. Springer, Berlin, pp. 256–260.
- Velázquez-Muriel JA, Sorzano COS, Fernández JJ, Carazo JM. A method for estimating the CTF in electron microscopy based on ARMA models and parameter adjusting. Ultramicroscopy. 2003;96:17–35. doi: 10.1016/S0304-3991(02)00377-7. [DOI] [PubMed] [Google Scholar]


