

Abstract
Recent evidence implicates the superior colliculus (SC) in cognitive processes, such as target selection and control of spatial attention, in addition to the execution of saccadic eye movements. We report here the presence of a cognitive response in some cells in the SC in a task that requires the long term association of spatial location with an arbitrary color. In this study, using a visual choice response task, we demonstrate that visuomotor neurons in the SC were activated by the appearance of a central symbolic cue delivered outside of the visual response fields of the recorded neurons. This procedure insures that cognitively generated activity in these SC cells is not confounded with modulation of activity from previous visual stimuli that appeared in the response field of the neurons. The experiments suggest that cognitive signals can activate SC cells by themselves instead of only being able to modulate activities already evoked by visual events. Furthermore, a substantial fraction of these cells accurately reflected cue aligned target selection in advance of saccade initiation. Our results add further support to other studies that have demonstrated that internally generated signals exist in SC cells.
Introduction
The superior colliculus (SC) has been clearly identified as a neural structure that generates motor commands for saccadic eye movements (Sparks and Hartwich-Young 1989). However, it is more frequently viewed as a structure in which a transformation takes place between visual input and motor output. Visual activity in the superficial layers - driven either directly by the retinotectal pathways or indirectly via visual cortices - is mapped in spatial register with movement-related activity in the deeper layers. The visual response field of most visuomotor cells is spatially congruent with their motor response field (Wurtz and Goldberg 1972). In this view the SC serves as a sensorimotor structure in which visual information coming to the SC via bottom-up processing may be directly funneled to downstream structures for evoking and guiding eye movements. As a corollary of this notion, cognitive signals observed in the SC may be regarded as secondary to visuomotor activity in the SC, in that they can exert an influence only by modulating rather than evoking the SC activity.
Several studies have reinforced this view of cognitive or internal processing that modulates visuomotor activity in the SC. Visual responses of SC neurons were enhanced when a stimulus in their response field would be the target of a saccade, indicating a top-down control of SC activity based on behavioral relevance of the visual stimulus (Goldberg and Wurtz 1972). Prior probability of a visual stimulus being selected as the target modulated the baseline activity of some SC cells prior to target selection (Basso and Wurtz 1997). The activity in some SC visuomotor cells was better correlated with target selection than saccade generation in a visual search paradigm (McPeek and Keller 2002). A common feature in all these studies and others involving delayed or memory-guided saccade generation was that a salient visual stimulus appeared in the response field of the neuron being studied. Thus, from these studies alone it is difficult to determine whether internally generated signals can activate SC cells by themselves, or do they have to always accompany activities evoked or primed by external visual stimuli.
In order to address this question a previous study used a gap paradigm in which the fixation point was turned off before the appearance of the target stimulus in the response field of the SC neuron (Dorris et al. 1997). These investigators found an early activation of some SC neurons that occurred during the gap period that was aligned on the time of disappearance of the fixation target. They interpreted this activity as a target location independent motor preparation signal since the location of the target was not known at this period of time. Two studies have used a symbolic cue delivered at the fovea (fixation point) to indicate the correct location of the saccade target without the previous appearance of a visual stimulus in the response field of the SC neuron being studied (Glimcher and Sparks 1992;Kustov and Robinson 1996). Each of these studies reported the presence of internally generated signals in some of the SC neurons that they studied. Additional studies used a symbolic cue presented at or near the fovea (Ignashchenkova et al. 2004;Horwitz et al. 2004), but the correct saccade vector, which was specified only after the cue was turned off, was outside the response field of the neuron being studied in contrast to the two studies cited above. Ignashchenkova et al. (2004) used a symbolic cue displaced slightly from the fovea in the direction in which an acuity test target (a Landolt C) would subsequently appear. The open side of the C pointed in the direction a saccade should be made to be rewarded. The C was located in the same or opposite direction of the response field of the SC neurons that were studied. They did not report cue-aligned responses, but the visual response to the appearance of the C in the response field of the cell was enhanced for valid cues.
In the present study we employed a novel color-cued choice response task in which we could separate internally generated activity from visual and motor events, and we examined SC activity during the performance of the task. The use of the choice task allowed us to achieve another motivation for the study, namely, to examine SC activities in the context of choice responses, as opposed to simple reactions. The distinction between the two types of behavior was well known since Donders’ pioneering work in which he introduced the concept that increments in response times could be taken as evidence for additional mental steps in the translation of the cue to a choice response (reference in Luce 1986, p. 212). Subsequent research further demonstrated differences in temporal characteristics between simple and choice responses. For instance, choice responses not only take longer in general than simple ones, but the variance is significantly larger as well (Luce 1986, pp.208–212 for a review). Choice response times increase as alternatives for the choice increase in number (Hick 1952), a feature not shared by simple reactions. These differences seem to reflect the need of stimulus-response translation in choice responses and the lack of it in simple reactions (Teichner and Krebs 1974). We have recently confirmed that the saccadic system obeys Hick’s law when the choice involves color-to-location translation (Lee et al. 2005). Thus, in the present study we take advantage of features of a choice response task, namely, 1) the large variance in response times and 2) the possibility of specifying a saccadic target without salient stimulation of the peripheral response field, for the purpose of examining internally-generated activities of SC neurons.
Materials and Methods
Subjects and surgical procedures
Two adult male rhesus monkeys (Macaca mulatta) weighing between 6 and 8 kg were used. Experimental procedures were approved by the Smith-Kettlewell Animal Care and Use Committee and were in compliance with the United States Public Health Service Guide for the Care and Use of Laboratory Animals.
A scleral eye coil and a head-restraint post were implanted under isoflurane anesthesia and sterile surgical conditions. A stainless steel recording chamber (15 mm ID), tilted 38º posterior from vertical, was positioned above a craniotomy centered on the midline and aimed at the SC. Antibiotics (Cefazolin) and analgesics (Buprenex) were administered as needed during the recovery period under the direction of a veterinarian.
Behavioral tasks
1) Delayed saccade task
While the monkey maintained fixation at a centrally located, gray fixation point, a gray target appeared at selected peripheral locations. The monkey was required to hold fixation until the fixation point was turned off. The offset of the fixation point signaled the animal to make a saccade to the peripheral target to receive a liquid reward. The delay between the target onset and the fixation point offset was fixed at 500 ms. The peripheral target was presented at locations of various eccentricity and direction, in order to map the response field of each neuron in terms of traditionally-defined visual and motor activities of the neuron.
2) Color-cued choice saccade task (Figure 1A)
Figure 1.

Color-cued choice response task and the activity of two exemplary SC cells. (A) The two-alternative (upper row) and one-alternative (lower row) color-cued choice response task is depicted. In the two-alternate version the animal was initially required to fixate a centrally located, gray target. After a random interval two potential targets were presented, one located at the center of the cell’s response field (RF) and the other at the opposite direction. The potential targets were red and green initially and turned gray after 400 ms. After a further delay, randomized between 400 and 800 ms, a cue was given at the central location of the fixation point. The color of the cue was picked at random between red and green, and thus, indicated the target to which a saccade would be rewarded (EM). The sequence of events in the single-alternative version was the same except that only a single peripheral target appeared either in the response field of the cell (red disk) or in the opposite direction (green, not shown): The colored target turned gray after 400 ms. After a further delay, randomized between 400 and 800 ms, a colored disk appeared central location of the fixation point. The color of this disk was the same as the former color of the single target and served as a go signal for a saccade (EM) to the single gray target. (B–C) The activity of two visuomotor cells in the SC for the two-alternative task is shown in spike rasters aligned on the target onset, cue onset, or saccade onset. The upper panels show trials in which a saccade was directed to the response field of the cell (IN trials) and the middle panels show trials in which a saccade was directed away from the response field (OUT trials). The black tic marks indicate the times of saccade onset in the cue-aligned panel and the times of cue onset in the saccade-aligned panels. The trials are sorted by saccade latency in all three raster panels. The average spike density functions are shown in the bottom panels, the red curves for IN trials and the green for OUT trials. The solid red bars below the spike density traces indicate the times where the average activity in the IN trials is significantly above base-line levels. See text concerning the timing of post-cue modulation for the details of how these times are computed.
At the beginning of a trial a gray fixation spot appeared at the center of the visual field. While the monkey was holding fixation on the spot, two colored potential targets (red and green) appeared, one in each hemifield, 180 degrees apart from each other. The red and green colors were shown for 400 ms, and then both stimuli turned gray so that they were no longer distinguishable by color. After a delay randomly chosen between 400 and 800 ms, the gray fixation spot changed into one of the two target colors, i.e., red or green. This color change at the fixation spot was a cue to make a saccade and indicated which target to choose: The animal had to saccade to the target location that previously had the same color as the cue. The animal was rewarded only if a saccade occurred within 1000 ms from the cue onset and the endpoint was within 2 degrees and +/− 15 degrees from the correct target in amplitude and direction, respectively.
In this task, visual, cognitive, and motor events are separated in time and in space, and the task is ideal for observing internally generated neural signals in isolation from the other events: 1) Since candidate targets appeared (a visual event) well in advance of the actual selection of a target (a cognitive event), the two events were separated in time. 2) The cognitive event and a motor event in the task were separated in space because the cue for target selection was given at the fovea while a saccade was directed to a peripheral target. In this regard, it is important to note that the foveal cue was given well outside of the visual response field of cells recorded in this study, and this was specifically checked for each cell. This was to preclude the possibility that the cell’s activity related to target choice be contaminated by visual responses evoked by the cue onset. Although we refer to a cognitive event, successful completion of the task involves at least two cognitive events: Accessing the associate memory of a particular color and spatial location and target selection or motor planning. Our task does not allow us to distinguish between these various cognitive events, but does produce a clear cue aligned modulation of activity in many SC cells.
Note also that, when the cue was given, both potential targets were identical and gray so that the choice decision had to be made by a recall of which of the two peripheral locations was associated with the color now presented in the cue, and not by a visual matching between cue and targets. Since the association of color and location of the targets was fixed within all blocks of trials for a particular cell, the monkey could perform the task relying on a long-term symbolic association between color and target location. In other words, even though the location of the two target colors were shown at the beginning of each trial, a visual working memory of target configuration was not crucial for performing the task.
In one monkey we examined cell activity in trials with a single alternative, in addition to the two-alternative choice trials (Fig. 1A, lower schematic). In this variation the trials started with the same, gray fixation point. One of the two, red or green, colored targets appeared in the periphery at the same location at which they appeared simultaneously in the two-alternative choice task. The red or green target was on for 400 ms, and then turned gray. After a delay randomly chosen between 400 and 800 ms, the gray fixation spot changed into the same color as the previously colored target. This change in color of the fixation spot served as a cue to make a saccade to the single target. Two-alternative and single-alternative tasks were run in separate blocks of trials in randomized order.
The fixation spot and potential targets were disks of one degree in diameter. When the target location was more than ten degrees from the fovea, larger disks of one and a half degrees in diameter were used as targets to enhance the visibility. The eccentricity of targets was set based on the location of the response field of the neuron being recorded. One of the potential targets was centered near the maximally responsive part of the field. The red, green and gray colors used for the targets and the fixation spot were chosen so that they were equiluminant, and the red and green were at the same distance in opposite direction from the gray in terms of CIE 1976 (L*a*b*) space, which is approximately uniform in perception of color difference (Wyszecki and Stiles 1982). A chromameter (CS-100, Minolta Photo Imaging USA, Mahwah, NJ) was used for measuring luminance and chromaticity of the colors. The luminance of all the visual stimuli was 1.24 cd/m2 presented against a background luminance of 0.12 cd/m2.
Single-cell recordings
Testing was performed in a dimly illuminated room. A custom real-time program running on a Macintosh G4 computer equipped with a National Instrument multi-channel IO board controlled experimental events and data collection. Visual targets were displayed on a video monitor at a distance of 35 cm from the animal’s eyes. Eye position and velocity were recorded with the magnetic search coil technique (Robinson 1963) and sampled at 1 kHz. Extracellular potentials were recorded using tungsten microelectrodes lowered through the recording chamber within a guide tube which penetrated the dura. When we began to encounter neurons with both visual- and motor-related activities based on on-line monitoring, we then recorded from every isolated neuron that exhibited both types of activity as the electrode was advanced. Based on previously published criteria, this suggests that all the neurons that we report here were located in the intermediate and deep layers of the SC (Munoz and Wurtz 1995;Anderson et al. 1998). A window discriminator detected neural discharges and the times were stored in temporal register with the eye movement data at a resolution of 1 kHz. Raw data from the microelectrode potential were recorded simultaneously at a sampling rate of 25 kHz. Raw records were also examined off-line to check the consistency of spike shape and amplitude, and to segregate, if present, spikes from different units using a template-matching algorithm.
Recording sites were located at caudal locations in the SC where the center of the visual and motor response fields were 7–15 degrees eccentric from the fovea. Once a neuron was isolated, we estimated the location of the visual stimulus in the visual field that produced the maximal saccade-related response using a delayed-saccade paradigm. The target array for the cued choice task was placed so that one of the two visual stimuli fell at the location with the maximal response for the neuron. We also used the delayed saccade paradigm to determine if the appearance of a visual target at a 2° eccentric location in the direction of the maximal response location evoked any response in the cell. None of the cells included in this report showed any response for this parafoveal stimulus. We conclude that the appearance of the cue, which was only 1° in visual angle, near the fovea did not produce a visual response.
Data analysis
To evaluate the relation between cell discharge and specific events present in the tasks, we constructed spike density curves by convolving spike rasters with a Gaussian kernel (sigma = 10 ms). A mean spike density function was then generated by averaging the individual spike density curves over trials with the same target condition, aligned with respect to the onset time of targets, the cue or the saccade. Only correct trials were included in our analysis. Both animals performed the tasks well during the recording sessions: Monkey M was correct in 98% of trials in the two-choice saccade task and monkey H was correct in 96%. Both monkeys scored close to 100% in the delayed saccade task.
1) Detection of activity increase
We determined the time when the post-cue activity for saccades made to the target in the response field (called IN responses) significantly increased from a baseline level for three groups of trials with the shortest, middle, and longest response latencies. At least seven trials were included in each group for statistical stability. We defined the baseline level of activity of each group as the mean firing rate between 100 ms before to 50 ms after the cue onset. We then asked, for each 10-ms bin beyond the 50-ms epoch up to 10 ms before the median response time (RT) of the trial group, how likely it was to observe the mean firing rate of the bin, assuming a Poisson spike generator with a mean equal to the baseline level. A probability less than 0.05 was regarded as evidence that the activity in the bin was significantly different from the baseline (Thompson et al. 1996). We marked only those bins where the activity was significantly higher than the baseline, and if five consecutive bins were marked, we took the beginning of the first bin as the onset of activity increase. In computing this time of significant activation the data was alternatively aligned on cue onset or saccade onset as explained in the next section.
2) Alignment indices
To quantitatively assess if significant activity modulation for IN trials was better aligned with the cue or the following saccade, we marked the deviation times of each cell’s activity (as explained above) for the three groups of trials with the shortest, middle, and longest RTs. We then took the slope of a linear regression between the median RT and deviation times as an alignment index for cue aligned data: AIcue. Since the trial group spike density functions may change depending on how the trials are aligned, we computed another alignment index from the same data aligned with respect to the saccade onset: AIsac. If the onset of a significant modulation in post-cue activity is better aligned with the cue onset, AIcue will be close to zero because the deviation times are constant with respect to the cue onset despite a variation in RT, while AIsac will be near minus one because the deviation times are more negative with respect to saccade onset in longer RT trials. On the other hand, if the cell’s activity is better aligned with the saccade onset, AIcue will be close to one because the deviation times are later with respect to the cue onset in longer RT trials, and AIsac is close to zero because the deviation times are constant with respect to the saccade onset despite a variation in RT. This analysis is similar in spirit to the analysis proposed by DiCarlo and Maunsell (2005) for using neuronal response latency to determine sensory-motor processing in reaction time tasks.
3) Relative activity modulation for IN and OUT trials near the onset of activity increase
After the onset time of activity increase was determined for trials with IN responses (see above, Detection of activity increase), we compared the amount of modulation around the activity onset between trials with a saccade directed toward the response field (IN trials) and those with a saccade away from the field (OUT trials). In order to select an equivalent time over which to compute the modulation of a cell for IN and OUT trials we paired each IN trial with an OUT trial and used the same time interval for OUT trials as that determined for IN trials. The activity during the 50-ms interval immediately preceding the activity onset was subtracted from the activity during the 50-ms interval following the onset. The difference was then divided by the mean pre-onset activity for all trials (both IN and OUT) to obtain a normalized percentage modulation. The normalized modulation was compared between IN and OUT trials. In all these measurements data were aligned on cue onset.
4) Target discrimination between IN and OUT trials
A receiver operating characteristic (ROC) analysis (Green and Swets 1966;Thompson et al. 1996) was done to determine whether, and at what time, a cell’s activity was significantly different between IN and OUT trials. A threshold of p < 0.05 by a bootstrap analysis with 2000 permuted samples was used for testing the significance (Efron 1982). This test was applied for the activities in successive 10-ms bins. When five consecutive bins were significant by this test, the beginning of the first bin was taken as the onset of target discrimination in the activity. Whether the discrimination time was better time-locked with respect to cue onset or saccade onset was examined by computing alignment indices, similarly to what was done for the onset of activity increase for IN trials. Alternative indices were computed from cue-aligned or saccade-aligned data.
Results
In the SC of two male rhesus monkeys we recorded from 54 single visuomotor (VM) neurons with eccentric response fields that did not include the area of the field covered by the fixation point or the cue. This fact was specifically checked for each neuron. The peak response region was typically located at 7 to 15 degrees in eccentricity, and each neuron showed changes of activity correlated with both visual and motor events in a delayed-saccade task (21 neurons from monkey M and 33 from monkey H). The cells were then recorded while the monkeys performed a color-cued choice task (Figure 1A). The positions of potential targets in the choice task were first determined by on-line monitoring of cell activity for various saccade vectors in a delayed-saccade task, so that one of the candidate targets appeared near the region of the cell’s response field where the visual- and saccade-related responses were maximal. Off-line mapping of the response field in the delayed-saccade task of each neuron confirmed that the potential target array placement was as intended for all cells.
The responses during the two-alternative choice task of two typical SC cells, one from each monkey, are shown in Fig. 1B & C. In all raster plots the trials are reordered so that trials are placed as a function of RT, longest at the top. In both cells there is a clear burst of activity near the onset of the saccade, but careful inspection of the raster plots shows that there is early activity in both cells for IN trials with longer saccadic latencies that begins in better alignment with the onset of the cue than the saccade. This can be seen on both the cue-aligned (middle) and saccade-aligned (right) rasters. Since burst cells (Fig. 1C) or buildup cells (Fig. 1B) (Munoz and Wurtz 1995) showed similar behavior with respect to the cue driven activity that we will describe next, we did not further distinguish these two classes of SC cells in the following analyses.
Timing of post-cue activity modulation with respect to the cue or the saccade
Given that there was no visual transient in the peripheral receptive field and that the cells did not respond to a visual target near the fovea in the delayed saccade task, the post-cue modulation of activity in VM neurons could not be visual, but might be cognitive or motor-related. In order to determine quantitatively whether the activity modulation was related to cognitive events associated with the cue or to the execution of the motor response, we examined the timing of the activity modulation with respect to these events (DiCarlo and Maunsell 2005 for a similar idea). We reasoned that, if the modulation in activity reflected cognitive processes prompted by the cue, it would occur at about the same time regardless of timing of the motor response. On the other hand, if it were related more to planning of the motor response, its timing would change trial by trial in correlation with the response latency. In this initial analysis we only considered the activity in trials where saccades were made into the response field of the neuron (i.e., the red traces for spike density in Figures 1B & C). In this case there was always a positive increase in activity at some point in the post-cue period.
In Figures 2A and B, the onset times of activity modulation were plotted on the ordinate with the median saccadic latencies on the abscissa. Each line in these plots represents results from one neuron. The location and slope of each line is determined by the linear regression of median activity modulation on median RT for three trial groups with the shortest, the middle, and the longest one-third of the response times for each cell. The slope was then defined as an alignment index, AIcue or AIsac, for data aligned on cue onset or saccade onset, respectively. The AIcue would be zero if the modulation of a cell’s post-cue activity began in alignment with the cue onset regardless of the saccade latency, and it would be one if a cell’s activity was aligned with saccade onset. A significant activity increase was observed in only one of the trial groups for four of the 54 VM cells, so that the slope could not be calculated for these four cells. As shown by the distribution of AIcue in Figure 2C (n = 50 cells), the slope was closer to zero than to one for a majority of cells (median 0.165), indicating that overall the activity onset was better correlated with the cue than with the response.
Figure 2.
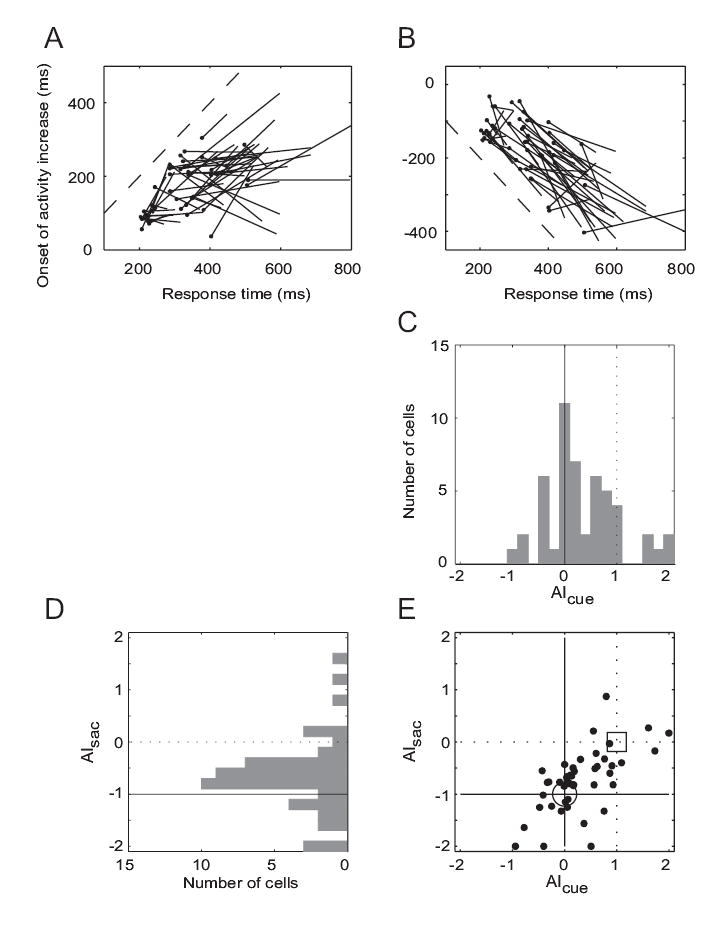
Timing of post-cue activity increase with respect to cue or saccade for IN trials. (A) Each line represents data from one cell. Spike rasters were aligned with respect to the cue onset, which occurred at time 0 on the ordinate. The response times (RTs) for each cell were divided into three trial groups (shortest, middle and longest RTs). Each line shows the linear regression of median activation times on median RTs for one cell. The filled circle at the end of each line is the end of the regression line for the shortest RT trial group. The dashed line has unity slope. (B) Results when the same rasters were aligned on saccade onset, which occurred at time 0 on the ordinate. Negative values indicate times prior to saccade onset. Each line shows the linear regression of median activation times on median RTs for one cell. Dashed line has a slope of negative one. (C and D) The distributions of alignment indices, AIcue and AIsac, computed from the plots in (A and B). AIcue denotes the slope of lines in (A), and AIsac those in (B). The distributions of the indices are shown in individual histograms. (E) In this X–Y plot, the large circle indicates where the joint distribution of indices would fall if the onset of a cell’s activity is time-locked to the cue, whereas the square indicates the location if the activity onset is time-locked to the saccade.
It is possible that the detection of the time of activity modulation may depend on which event is used for aligning spike rasters (Thompson et al. 1996). Therefore, we repeated the calculation after aligning the same data with respect to saccade onset (Figure 2B). The slope of lines in this plot was defined as another alignment index, AIsac. This index would be −1 if a cell had activity time-locked to the cue, and it would be zero if the activity was time-locked to the saccade. For six cells, a significant activity increase was observed in only one of the trial groups and the AIsac could not be calculated. For most of the remaining 48 cells where a significant activity increase was observed in two or more trial groups, the index was closer to −1 than zero (median −0.684), as shown in Figure 2D, confirming that the post-cue activity modulation was better correlated with the cue onset than with the saccade in a majority of the VM cells that we recorded.
To compare the two analyses that used different events for aligning the spike rasters, AIcue and AIsac were plotted as a joint distribution in Figure 2E. Both indices were available in 45 cells, and for the remaining nine cells, at least one of the indices could not be determined because the activity increase was not significant in at least two of the three trial groups defined by RT. In this plot (Fig. 2E) a data point would fall near the large open circle if the activity of a cell was better time-locked to the cue, while it would plot near the open square if the activity were time-locked to the saccade. For the majority of cells both indices were concordant in indicating that the activity modulation was better correlated with the cue regardless of which event was used to align the data: That the data points in Figure 2E were distributed closer to (0, −1) than to (1, 0) was confirmed by an F test on the ratio of sum of squared errors (SSE[(AIcue, AIsac)data − (0, −1)] / SSE[(AIcue, AIsac)data − (1, 0)] = 0.4897, d.f. = 44, p < 0.01). In twenty-three cells (23/45, 51.1%) data points were close to the large open circle in Fig. 2E, i.e., AIcue between −0.5 and 0.5 and AIsac between −1.5 and −0.5. In 8 cells (8/45, 17.7%) data points were close to the large open square, AIcue between 0.5 and 1.5 and AIsac between −0.5 and 0.5.
For all trials combined, the activity increase occurred at 187.6 +/− 67.3 ms (mean +/− sd, n = 50) after the cue onset - it was earlier in one monkey (M, 121.3 +/− 35.7 ms, n = 20) than the other (H, 218.8 +/− 54.9 ms, n = 30).
Target or response choice reflected in the cue-related activity modulation
We further analyzed the cue-aligned modulation of neuronal activity in order to determine whether this activity modulation reflected the target choice near the initial time of significant modulation in activity for IN trials. The relative amount of modulation was compared between trials with a saccade directed toward the response field (IN trials) and those with a saccade away from the field (OUT trials). The activity during the 50-ms interval immediately preceding the activity onset for IN trials was subtracted from the activity during the 50-ms interval following the onset. The difference was then divided by the mean pre-onset activity for all trials (both IN and OUT) to obtain a normalized percentage modulation. The normalized modulation is compared between IN and OUT trials in Figure 3. This comparison was performed on twenty-three cells for which the alignment indices clearly indicated that the activity modulation on IN trials was cue-driven (AIcue between −0.5 and 0.5 and AIsac between −1.5 and −0.5 in Figure 2E). The open circles in Figure 3 mark cells where the activity modulation was significantly different between the two trial types (p < 0.05 by a bootstrap test of ROC analysis), and the filled circles those without a significant difference. For most cells, the data points lay below the line with unity slope, indicating that the activity modulation was greater on IN trials than on OUT trials. The activity increase on IN trials was 90.0 % on average (confidence interval 69.3 to 110.7 %), whereas on OUT trials it did not differ significantly from zero (average 8.7 %, confidence interval −4.1 to 21.5 %).
Figure 3.
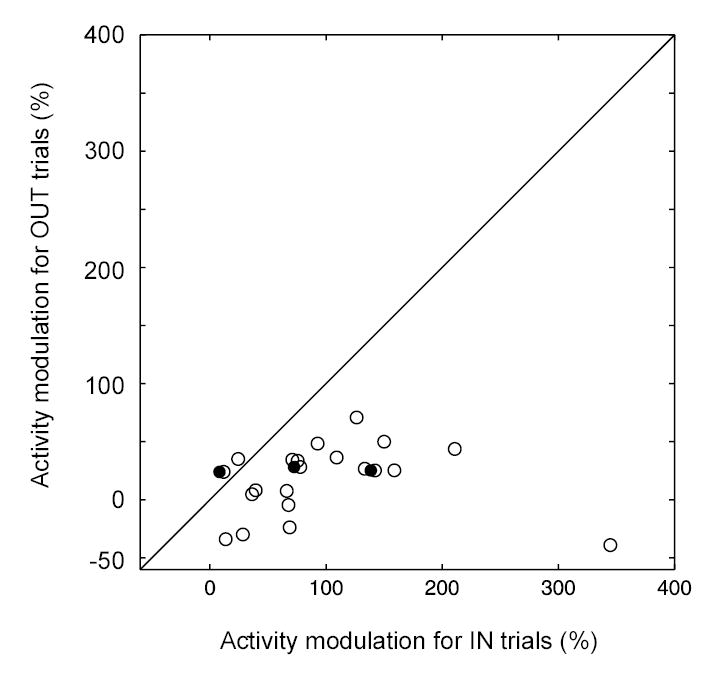
Relative activity modulation for IN and OUT trials. The activity of the 50-ms interval immediately preceding the activity onset was subtracted from the activity during the 50-ms interval following the onset. The difference was then divided by the mean pre-onset activity for all trials (both IN and OUT) to obtain a normalized percentage modulation. The normalized modulation was compared between IN and OUT trials. Data points falling below the diagonal line indicate that the activity modulation was greater for IN trials than for OUT trials. Negative values of modulation that obtain for some cells for OUT trials indicate that activity decreased for these trials over the time interval that activity increased for IN trials. The open circles indicate comparisons that were significant for individual cells (p < 0.05 by a permutated ROC test).
The analysis depicted in Figure 3 on the 23 cells with cue-driven activity modulation suggests that many collicular VM cells discriminate the correct target around the time of their initial post-cue modulation of discharge. However, it does not provide information about the precise time that the discrimination occurs, and whether this time was better aligned with the cue or the response. For this purpose, the timing of target discrimination between IN and OUT trials was analyzed for these cells using an ROC analysis. From the data for each cell, three trial groups were again identified based on RT, i.e., the shortest, middle, and longest RT groups, and then for each group, the time was determined at which the activity became significantly different between IN and OUT trials (p < 0.05 by a bootstrap test on 2000 permuted samples, with a requirement of five consecutive 10-ms bins being significant) (Efron 1982). A linear regression was then computed for the discrimination times vs. the median RTs of the groups. When spike rasters were aligned with respect to the cue (Fig. 4A), significant target discrimination was observed for at least two RT groups in 14 of the 23 cells during the post-cue period (14/23, 60.8%). When the same rasters were aligned with respect to the saccade (Fig. 4B), 17 cells were found to discriminate between target choices for at least two RT groups (17/23, 73.9%). As was done for the activity onset calculations (Fig. 2), the slopes of the lines in Figure 4A and B were taken as correlation indices with respect to the cue or the saccade. The distribution of slopes from (A) are shown in (C) and from (B) in (D). Figure 4E shows the 13 cells that had a significant discrimination for at least two of the RT groups and for both the two methods of raster alignment. Overall the indices shown in (C) were closer to zero than to one (median −0.018), and those in (D) closer to minus one than to zero (median −0.6467), both indicating the discrimination times were aligned better with the cue than with the saccade for a majority of cells. That data points in Figure 4E were closer to (0, −1) than to (1, 0) was confirmed by an F test on the ratio of sum of squared errors (i.e., SSE[(AIcue, AIsac)data − (0, −1)] / SSE[(AIcue, AIsac)data − (1, 0)] = 0.0612, d.f. = 12, p < 10−4).
Figure 4.
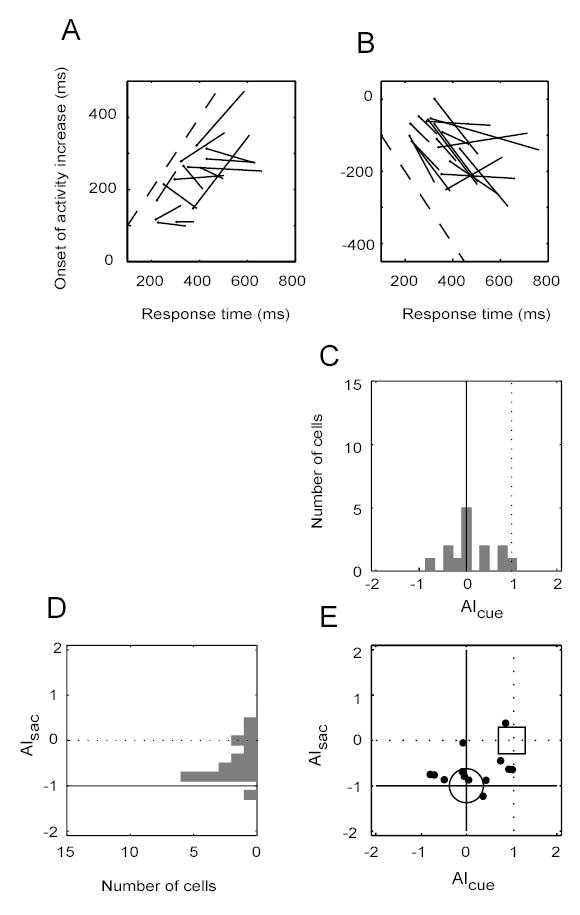
Timing of target discrimination (IN vs. OUT) in cell activity. (A) Data are aligned on cue onset. The response times (RTs) for each cell were divided into three trial groups (shortest, middle and longest RTs). Each line shows the linear regression of median activation times on median RTs for one cell. The filled circle at the end of each line is the end of the regression line for the shortest RT trial group. The dashed line has unity slope. Other details of the plot are the same as in Figure 2A. (B) Data are aligned on saccade onset. Otherwise the plot is the same as in (A). (C) The distribution of the line slopes in (A) is shown in a histogram. AIcue denotes the line slopes in (A). (D) The distribution of the line slopes in (B), or AIsac, is shown in a histogram. (E) An X–Y plot of the joint distributions from (C) and (D). The large circle indicates the expected location of the slopes if the timing of target discrimination in a cell’s activity is time-locked to the cue. The square indicates the location if the discrimination is time-locked to the saccade.
The cue-driven activity in the neural population
We also collected data during the choice task when only one alternative target location was presented in one of the monkeys (Monkey H, see Fig. 1A) in addition to two-alternative choice condition. The population neural response in the SC during the two-alternative condition for this monkey was obtained by pooling and averaging the spike density functions from all 33 VM neurons we recorded in this animal. Figures 5A and 5B show the data, where pooled activities in shortest and longest RT trial groups are shown by red and green curves, respectively. Solid curves represent activity for IN trials and broken ones for OUT trials. Thickened portion of the solid curves indicates when the activity was significantly increased for IN trials compared to the baseline (defined as the mean spike count between 100 ms before to 50 ms after the cue onset). The pair of red and green bars at the bottom of these figures show when the activity was significantly different between IN and OUT trials. The discrimination times for the population responses were determined with a permutation ROC analysis similar to that performed on the individual cell data (Figure 4).
Figure 5.
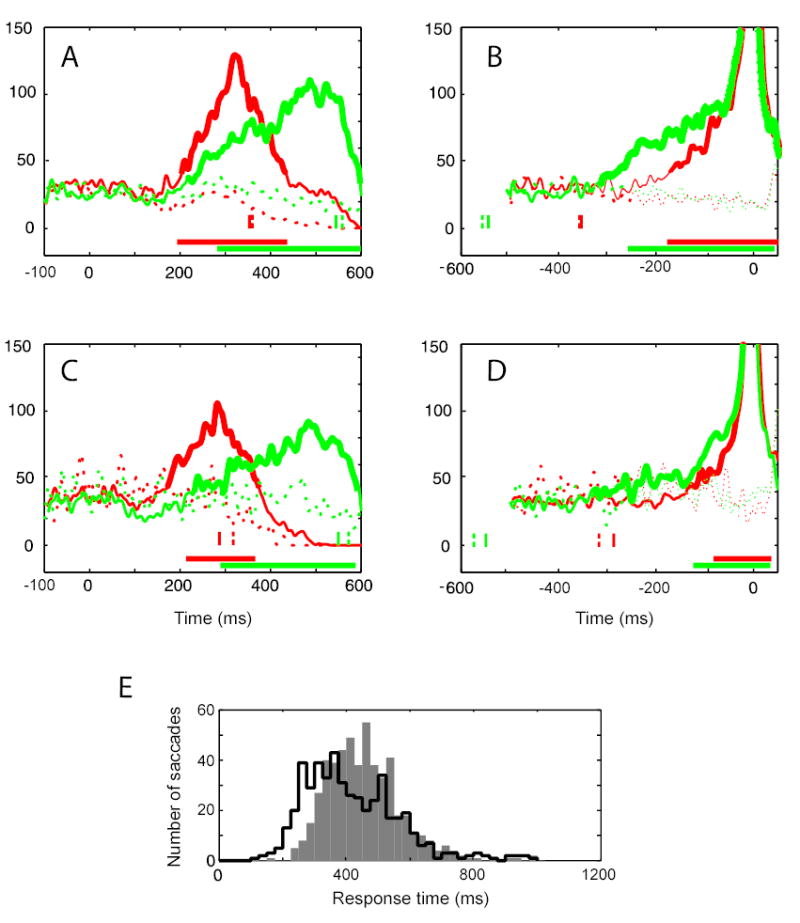
Population activity in the SC during choice response tasks. (A, B) show the activity during the two-choice task and (C, D) during the single-choice task, in monkey H. (A) Population activity aligned with respect to the cue onset (at zero on the abscissa). Red curves are the average activities recorded in the set of trials with the shortest RT and green curves for the set of trials with the longest RT. Solid curves indicate activity for IN trials, and broken curves for OUT trials. Vertical tic marks represent the median RT of the trial groups denoted by corresponding colors and line-styles. Thickened portion of the solid curves denotes that the activity was significantly higher than the baseline. The pair of horizontal bars at the bottom indicates when the activity was significantly different between IN and OUT trials for short (red bar) and long (green bar) RT trial groups. (B) The same data as in (A) aligned on saccade onset (at zero on the abscissa). (C) Population activity during the single-choice task in monkey H is plotted after alignment on the cue. (D) The same data as in (C) aligned on saccade onset (at zero on the abscissa). Other details of the plots in (B)–(D) are the same as in (A). (E) Histograms showing the distribution of saccade response time for the two-alternative choice condition (filled bars) and the single-choice condition (open bars) in Monkey H.
When data were aligned on the cue, the increase of neural activity became significant at 203 ms after the cue onset for the shortest RT trials and 211 ms for the longest RT trials (Figure 5A). Thus, the onset of activity increase occurred at about the same time, whereas there was a 187-ms difference in median RT between the trial groups (the median RT of 353 and 540 ms for the shortest and longest RT groups, respectively, as indicated by the solid red and green vertical tic marks in the figure). No significant increase in activity was observed in OUT trials (broken curves). The rate of rise in activity for IN trials once it went above background level was higher in the shortest RT trials (thick red curve) than in the longest RT trials (thick green curve).
For cue-aligned data, the discrimination between IN and OUT target conditions became significant (p< 0.05 by a permutation test on ROC analysis) at 193 ms and 282 ms after the cue onset for the shortest and longest RT trials, respectively, (the pair of red and green bars at the bottom of Figure 5A). This 89-ms time difference for target discrimination between the trial groups was larger than the 8-ms difference found for the onset times of the activity increase for IN trials, but it was still only about one-half of the 187-ms difference in RT for the two trial groups. We conclude from the cue-aligned population data that there is an increase in activity in the SC at the site representing IN-directed saccades, and that this activity is better correlated with cue onset than saccade onset. The time of discrimination between IN and OUT targets is more variable but is also better correlated with cue onset.
When the data were aligned on saccade onset, there appeared to be two discernable phases in the activity increase: an initial gradual rise, followed by a discrete inflection point and rapid rise of activity immediately before the saccade (Figure 5B). The activity increase for IN trials became significant at 310 ms before saccade onset for the longest RT trials and 173 ms before saccade onset for the shortest RT trials. The difference between long and short RT trials was 137 ms, a time comparable to the difference in the RTs of 187 ms. For saccade-aligned data, the discrimination of the target between IN and OUT target conditions became significant (p < 0.05, a permutation test on ROC analysis) at 177 ms and 258 ms before saccade onset for shortest and longest RT trials, respectively. This 81-ms time difference between the trial groups was also about one-half of the difference in median RTs of 187 ms for the two groups of trials. Thus, both cue-aligned and saccade-aligned population responses support the observation gained from the single-neuron analysis (Figure 2) that the population activity in SC showed an increase at an approximately fixed latency from cue onset, regardless of the RT, and that, while the activity discriminated between IN and OUT targets at about 250 ms after cue onset, the saccade did not occur for another 100 to 250 ms.
In monkey H, we also collected data when the animal performed a choice task with only one alternative target (Figures 5C and D). This task was similar to the delayed-saccade task, since the location of the target was known during the delay period before the cue was given (Fig. 1A). However, this one-alternative task differed from the delayed-saccade task in that the single target initially had a color that was dictated by the same color/location association that was present in the two-alternative choice trials instead of being gray, regardless of location, as it was in the delayed-saccade task. In the one-alternative choice task the color of the target then turned to gray while the fixation point remained on. Finally the fixation point changed to the same color as that previously present at the single-target location instead of going off (delayed-saccade task) as the cue to make a saccade to the one target. Our aim of adding this condition was to see whether the cue-driven activity modulation was dependent on the number of alternatives in such a way that it was present only in multiple-choice situations. Since only one target was present on each trial and the required saccade vector was known once it came on, one might assume that the monkeys would only use the cue as a go signal, just as the dimming of the fixation point in delayed-saccade task. If this were the case, we would expect that the early activity modulation aligned on the cue that we observed in the two-choice condition might disappear. The median RT was shorter in the single-alternative condition (384 ms on IN trials) than that observed in the two-alternative choice condition (454 ms), but longer than that in the delayed-saccade task (210 ms). The distributions of response times for the two-alternative choice task (solid bars) and the single-alternative task (open bars) are shown in Figure 5E. Both distributions show the typical shape reported for saccade latency distributions with skews toward longer response times. Interestingly, the shortening of the median RT in the one-alternative choice condition was mainly contributed by short RT trials: the median of the shortest RT group of IN trials was 287 ms for the single-choice condition, much shorter than the 353 ms of the equivalent RT group in the two-choice condition. In contrast, the median of the longest RT group of IN trials was 549 ms for single-choice trials, which was similar to the 540 ms measured for the longest RT trials in the two-choice condition.
As we observed for the two-alternative choice condition, there was an increase in population neural activity for IN-directed saccades in the single-choice condition (Figure 5C - cue aligned data). The increase of neural activity became significant at 172 ms after the cue onset for shortest RT trials and at 231 ms for longest RT trials, leading to a time difference of 59 ms between these activation times. Since there was a 262 ms difference in RT between the trial groups (median RT of 287 ms and 549 ms for the shortest and longest RT groups, respectively), the time difference found for activity onset between the shortest and longest trials was less than a quarter of the RT difference. The ratio of cue-aligned time difference in activity onset to RT difference (22.5%, 59 ms / 262ms) was larger than that observed in the two-choice condition (4.3%, 8 ms difference in activity onset over 187 ms difference in RT, shown in Figure 5A). The discrimination times where the activity for IN and OUT trials became significantly different (p < 0.05, permuted ROC test) was 213 and 289 ms for the shortest and longest trial groups, respectively (the pair of red and green bars at the bottom of Fig. 5C). The 76-ms difference in the onset of discrimination was 29.0% of the RT difference (262 ms), a proportion less than that observed in two-choice condition (47.6%, 89 ms/187 ms).
When the data were aligned on saccade onset (Figure 5D), the activity increase for IN trials became significant at 324 ms before saccade onset for the longest RT trials and 135 ms before saccade onset for short RT trials, a difference of 189 ms. The difference in median RT between the longest and shortest RT trials was 262 ms, a time very comparable to the difference in the times of activation onset.
For saccade-aligned data, discrimination of the target between IN and OUT target conditions became significant at 82 and 124 ms before saccade onset for the shortest and longest RT trials, respectively, (the pair of red and green bars at the bottom of Fig. 5D). This 42 ms time difference in discrimination between the trial groups was much shorter than the 262 ms difference in median RT. In addition, the pattern of activity rise in saccade-aligned data was more similar for the shortest and longest RT trials in the case of the single-choice task than in the two-choice task (compare Figs. 5B and D).
Discussion
Evidence that some neural activity in the SC may result from internally generated signals
We found a cue-aligned increase in activity in about one-half (23/45 = 51.1%) of the visuomotor (VM) collicular cells with peripheral response fields that we were able to analyze (Figure 2E). The cue was delivered at the fovea well outside the response fields of the cells. Only a neutral gray stimulus remained in the response fields of the cells at the time the cue was delivered. Any salient information in this stimulus had been removed well before target selection, response planning or saccade production. Thus, the activity was not a visual response in the traditional sense. Furthermore, the increase in SC activity was time-locked to the cue onset despite a wide variation in the time of the saccadic response suggesting that it could be interpreted as a signal reflective of the processing involved in the color perception to arbitrarily associated response location, a process required for successful completion of our choice response task. In a subset of these cue-responsive cells, the activity modulations discriminated between a potential targets IN and OUT from the response field. Based on these observations we argue that this cue-driven activity is internally generated.
Our results are consistent with several other recent studies that provided evidence that the functional role of the SC is not confined to the generation of a direct sensorimotor transformation of visual input to saccadic output, but may also encompass more cognitive processes. A subset of VM neurons in the SC show early activity related to target selection in a visual search paradigm (McPeek and Keller 2002). Furthermore, this activity reflects target selection whether the response is a saccadic or a pursuit movement (Krauzlis and Dill 2002). However, in these and other similar studies (Goldberg and Wurtz 1972;Basso and Wurtz 1997) a meaningful visual stimulus appeared in the response field of the neurons being studied, which possibly confounds a visually primed response with a internally generated signal.
In characterizing these neural modulations in the SC, only a few studies have used a paradigm where a saccade was generated without salient visual stimulation of the peripheral response field (Glimcher and Sparks 1992;Horwitz and Newsome 2001;Ratcliff et al. 2003). In one such study that utilized a central cue to indicate which of two spatially separate visual stimuli were to be the goal of a saccade, Glimcher and Sparks (1992) observed early selection-related activity as seen in the current study. They viewed this activity as reflecting a covert process of response selection that occurred early in the planning for a saccade. But it is unclear whether the activity reflected target selection or motor preparation, since they did not determine which of these two possibilities was better correlated with the activity. Specifically they did not align their data alternately on the cue or the saccadic response as we did in the present study. Furthermore, their task interposed a long delay between the cue that specified a target and the response, which precludes an assessment of correlation between cue-driven activities and response times. Given the important temporal features of choice responses in contradistinction to simple reactions, such as a large variability in response times and the obedience of Hick’s law, the cue onset and response should not be artificially separated if one aims at understanding neural mechanisms for choice decision making, and we believe our choice saccade task is an important improvement in this aspect. Horwitz and Newsome (2001) presented a random dot display at the fovea while recording from SC neurons with the response fields in the periphery. The motion in the display served as a cue for the target selection later on. Since the display was 7 degrees in diameter, the activity modulation they reported may have been at least partly due to stimulation of the peripheral visual field. In the experiment by Ratcliff et al. (2003), a cue was given at a point on the vertical meridian which prompted monkeys to make a choice saccade to one of two horizontal located targets illuminated throughout the whole trial. One of these potential response targets was located in the center of the response field of the collicular neuron being recorded. Their paradigm resembles our choice response task, but it differs in other important respects, since the prompting cue did not contain specific information for the correct response selection, as further discussed below.
The second experiment of the Ignashchenkova et al. study (2004), which showed that VM neurons in the SC are active during covert shifts of attention without overt eye movements, was similar in design to our experiments in that a symbolic cue was given near the fovea and outside of the cell’s response field. However, in contrast to our task the correct saccade vector was not specified by the cue, but instead this specification came later in the trial by the orientation of a Landolt C that was presented in or opposite to the response field of the neuron. Because they were most interested in the covert attention shifting mechanism that preceded the appearance of the acuity testing C they did not report whether the cue itself, presented near the fovea, gave rise to activity immediately following its onset. There was a 500-ms pause added following the 200-ms cue display, and the plot in their Figure 4 included only the last 200 ms of the pause period, so that no information was available on the activity in the immediate post-cue period where we found a significant modulation of cue-aligned activity in about one-half our cells. It would be of significant interest to know whether the cue-related activity observed in our study also occurs in association with covert shifts of attention directed to the response field, without actually making an eye movement toward it.
Horwitz et al. (2004) have recently used a novel visual motion direction discrimination task where a random-dot motion display shown in the center of the visual field provided information for choosing between two potential saccade vectors that were only shown well after the cue was turned off. Because neither choice of saccade vector was in the response field of the neuron being studied their task has the advantage over ours that any modulation that occurs cannot be related to specifically directed motor planning. In other words, because the targets appeared after the central display had been turned off, perceptual judgements based on the perceived direction of motion were temporally dissociated from preparation to execute a saccade. A small population (estimated at ~10%) of SC neurons were found that increased firing in response to the motion stimuli outside of their response field, well before the monkey could plan the saccade. The activity modulations predicted the future direction of the saccadic response, similarly to what we observed using our color-cued choice task. In our case more than 50% of the recorded cells showed a cue-aligned response. Presumably the activity modulation was driven by the motion stimuli shown in the center since the peripheral response fields of the cells were not directly stimulated. But the spatial relationship between the central display and the inner edge of the response fields was not reported in their experiment, leaving it a possibility that the activity change was at least partly a visual response to the large central display.
In another experiment, Kustov and Robinson (1996) recorded from buildup cells in the SC and used a symbolic cue delivered at the fixation point to indicate the hemifield of a peripheral visual target that would appear after a delay period. They observed an activity increase after the cue onset, which was smaller and later than that in response to a peripheral cue. However, precise timing of the cue responses was not reported, but the activity profile was shown in a figure with time bins as large as 50 or 100 ms. Judging from the figure (their Fig. 4b), the response rose above the baseline later than 200 ms after the onset of a symbolic cue. This was slightly longer than the mean 187.6 ms latency of the post-cue activity onset observed in our study (in the two-alternative condition, n=50), but we would consider these times as comparable, given the poor temporal resolution of the previous study. They only reported on a small sample of cells (n = 6), and their cue was described as a “large” colored disk. Since no measurements of the sizes or locations of the response fields of these buildup cells were given, it is not clear if their responses might not be partially caused by encroachment of the cue into their response fields.
The current study adds additional support to these previous studies using a paradigm that demonstrates that SC cells can be activated solely by internally generated signals, after any visual responses have died away and the only remaining eccentric visual stimuli are non-salient for completion of the task. Our results show that the cue-driven responses found in most SC neurons with peripheral response fields were temporally dissociable from saccade responses. This finding was facilitated by a large variability in RTs that the monkeys exhibited in performing the two-alternative choice response task, ranging between 117 and 912 ms in the two-alternative choice condition. These long and variable RT times are perhaps surprising, but we have found a similar effect in human subjects using the same choice responses task (Lee et al. 2005). These long and highly variable RTs associated with the choice paradigm contributed to our ability to determine whether the activity in SC was time-locked to the cue or the response. Also, we checked for possible visual responses at locations near the foveal cue (2 degrees in eccentricity) and in the same direction as the center of each cell’s response field and found no responses for any of the cells included in this report. This insured that the cue did not encroach on the inner border of the response fields.
The increased activity present in the discharge of SC cells for IN trials was time-locked to the cue-onset at the level of the population as well as in individual neurons (Figures 2 & 5A). However, while target discrimination in the longest RT trials was later than in the shortest RT trials, the delay was only about one-half of the median RT differences. This result is what would be expected if some of the cells showed a better correlation of discrimination time with the cue but others did not, as indicated by the variability in the alignment indices shown in Figure 4.
One additional feature of our paradigm was that the appearance of the cue provided not only the information necessary to make the remembered association to the correct target, and also served as the go signal for the saccade. The delays superimposed after the appearance of the cue and before the target appeared in all the other paradigms that used symbolic cues are somewhat artificial because in most natural situations, when information becomes available to specify a particular saccade, the system is also free to make that saccade. The character of discharge in SC cells can be changed by the inclusion of a delay period, e.g., burst cells with no pre-saccadic discharge when a delay is imposed before the appearance of the go signal can show extensive pre-saccadic discharge when the target and go signal are presented at the same time (McPeek and Keller 2002).
Because our task did not dissociate the go signal from the instruction that identifies the target, one might argue that the cue-aligned responses that we see are responses to the go portion of the cue alone and not cognitive in nature. Dorris and colleagues (1997) used a gap paradigm and reported an activation of buildup cells in the SC that was aligned on the disappearance of the fixation point. Since no target had yet been identified at this time, they interpreted this activation as a motor preparation signal, not a cognitive signal. However, in their results similar activations occurred for both directions of subsequent target presentation. In our paradigm a portion of the neurons showed an activation that was better aligned on the cue than the following saccade and this activation distinguished IN and OUT target situations. A similar set of responses was seen in the population activity in the choice response task. We argue that at least the cells with directional selective responses more likely reflect a cognitive verses a motor preparation signal.
Whether the signal is generated in the SC is a separate question that cannot be answered by neural recording studies alone. However, recent studies have suggested a causal role in target selection for the SC by using electrical stimulation or inactivation techniques (McPeek and Keller 2004;Carello and Krauzlis 2004). Similar techniques could be used in conjunction with our symbolic cueing task to further establish the functional meaning of the internally generated SC signals that we report here.
What is the functional role of the cue-driven activity?
While previous and the present studies that have demonstrated a correlation between activity in the SC and various cognitive signals do not establish a causal role, they do suggest that the SC is well-informed of what goes on in other parts of the brain, and is not merely a conduit for motor commands delivered from above to generate saccadic eye movements. The causal role of the SC in some types of cognitive behavior has begun to be established in other studies using reversible lesions (McPeek and Keller 2004) or electrical microstimulation (Carello and Krauzlis 2004). It remains to be determined if focal reversible lesions in the SC would effect target selection behaviour in a choice paradigm.
Relationship of our results to theoretical studies of choice reaction time
The following features in temporal profiles of SC population activity are notable in view of models on neural mechanisms of choice decision: 1) The activity has a constant latency from the onset of a cue, regardless of the timing of the actual response (Figure 5A). 2) The activity grows with an approximately constant slope once it starts. 3) The rate of the growth seemed correlated with how long it took to evoke a saccade, presumably by reaching a threshold. These features are consistent with some models on how stochastic sensory information is utilized to reach a decision. Carpenter and his colleagues have modelled the steady growth of the neural activity as a linear approach to threshold with ergodic rate (abbreviated as LATER), and considered it as a neural representation of accumulating evidence obtained from the visual cue (Carpenter and Williams 1995). In contrast, the growth of neural activity could be viewed as accumulation of information in a random-walk or diffusion process (Ratcliff 1978) or in competing Poisson counters (Townsend and Ashby 1983). Recently, Ratcliff and his colleagues compared SC neural activity with results of simulations using these models (Ratcliff et al. 2003), and claimed that SC activity during a two-choice task based on distance judgements better resembled simulated activity profiles of the diffusion model than those of the Poisson counters model. When the population activity profiles in our experiments are compared with their simulation results, the activity during our two-choice task (Figure 5A) appeared similar to the simulated profile of the Poisson counter model (Figure 13 of the Ratcliff et al. study (2003)) and that during single-choice task (Figure 5C) looked like the results based on the diffusion model (Figures 11 and 12 of the Ratcliff et al. study (2003)). While these apparent resemblances need confirmation by simulations with behavioural parameters obtained in our study, the difference in the SC activity between the Ratcliff et al. study and ours may be due to an important difference between the tasks used. They recorded during trials where a cue was ambiguous, falling in the middle of far and near distances, and thus the responses were based primarily on a guess. This is in clear contradistinction to our recorded trials, in which the cue was clearly informative in directing the saccade response. How information carried by a cue affects the activity profile in the SC is an extremely important question for future study, since it is the information extracted from the cue that drives temporal dynamics of choice decision.
Footnotes
Grants
This work was supported by The Smith-Kettlewell Eye Research Institute, a grant from Brain Research Center of the 21st Century Frontier Research Program funded by the Ministry of Science and Technology of Republic of Korea (K.M.L., M103KV010021-03K2201-02120), and NIH Grant EY08060 (E.L.K.).
References
- Anderson RW, Keller EL, Gandhi NJ, Das S. Two-dimensional saccade-related population activity in superior colliculus in monkey. JNeurophysiol. 1998;80:798–817. doi: 10.1152/jn.1998.80.2.798. [DOI] [PubMed] [Google Scholar]
- Basso MA, Wurtz RH. Modulation of neuronal activity by target uncertainty. Nature. 1997;389:66–69. doi: 10.1038/37975. [DOI] [PubMed] [Google Scholar]
- Carello CD, Krauzlis RJ. Manipulating intent: evidence for a causal role of the superior colliculus in target selection. Neuron. 2004;43:575–583. doi: 10.1016/j.neuron.2004.07.026. [DOI] [PubMed] [Google Scholar]
- Carpenter RHS, Williams MLL. Neural computation of log likelihood in control of saccadic eye movements. Nature. 1995;377:59–62. doi: 10.1038/377059a0. [DOI] [PubMed] [Google Scholar]
- DiCarlo JJ, Maunsell JH. Using neuronal latency to determine sensory-motor processing pathways in reaction time tasks. JNeurophysiol. 2005;93:2974–2986. doi: 10.1152/jn.00508.2004. [DOI] [PubMed] [Google Scholar]
- Dorris MC, Pare M, Munoz DP. Neuronal activity in monkey superior colliculus related to the initiation of saccadic eye movements. JNeurosci. 1997;17:8566–8579. doi: 10.1523/JNEUROSCI.17-21-08566.1997. [DOI] [PMC free article] [PubMed] [Google Scholar]
- Efron B The Jackknife, the Bootstrap and Other Resampling Plans. Philadelphia, Soc. for Industr. & Appl. Math. 1982, 75–87.
- Glimcher PW, Sparks DL. Movement selection in advance of action in the superior colliculus. Nature. 1992;355:542–545. doi: 10.1038/355542a0. [DOI] [PubMed] [Google Scholar]
- Goldberg ME, Wurtz RH. Activity of superior colliculus in behaving monkey: II. The effect of attention on neuronal responses. JNeurophysiol. 1972;35:560–574. doi: 10.1152/jn.1972.35.4.560. [DOI] [PubMed] [Google Scholar]
- Green DM and Swets JA Signal detection theory and psychophysics. New York, John Wiley and Sons. 1966.
- Hick WE. On the rate of gain of information. Quarterly Journal of Experimental Psychology. 1952;4:11–26. [Google Scholar]
- Horwitz GD, Batista AP, Newsome WT. Representation of an abstract perceptual decision in macaque superior colliculus. JNeurophysiol. 2004;91:2281–2296. doi: 10.1152/jn.00872.2003. [DOI] [PubMed] [Google Scholar]
- Horwitz GD, Newsome WT. Target selection for saccadic eye movements: direction-selective visual responses in the superior colliculus. JNeurophysiol. 2001;86:2527–2542. doi: 10.1152/jn.2001.86.5.2527. [DOI] [PubMed] [Google Scholar]
- Ignashchenkova A, Dicke PW, Haarmeier T, Thier P. Neuron-specific contribution of the superior colliculus to overt and covert shifts of attention. NatNeurosci. 2004;7:56–64. doi: 10.1038/nn1169. [DOI] [PubMed] [Google Scholar]
- Krauzlis RJ, Dill N. Neural correlates of target choice for pursuit and saccades in the primate superior colliculus. Neuron. 2002;35:355–363. doi: 10.1016/s0896-6273(02)00756-0. [DOI] [PubMed] [Google Scholar]
- Kustov AA, Robinson DL. Shared neural control of attentional shifts and eye movements. Nature. 1996;384:74–77. doi: 10.1038/384074a0. [DOI] [PubMed] [Google Scholar]
- Lee KM, Keller EL, Heinen SJ. Properties of saccades generated as a choice response. ExpBrain Res. 2005;162:278–286. doi: 10.1007/s00221-004-2186-5. [DOI] [PubMed] [Google Scholar]
- Luce RD Response times: their role in inferring elementary mental organization. New York, Oxford University Press. 1986.
- McPeek RM, Keller EL. Saccade target selection in the superior colliculus during a visual search task. JNeurophysiol. 2002;88:2019–2034. doi: 10.1152/jn.2002.88.4.2019. [DOI] [PubMed] [Google Scholar]
- McPeek RM, Keller EL. Deficits in saccade target selection after inacitvation of superior colliculus. Nature Neuroscience. 2004;7:757–763. doi: 10.1038/nn1269. [DOI] [PubMed] [Google Scholar]
- Munoz DP, Wurtz RH. Saccade-related activity in monkey superior colliculus. I. Characteristics of burst and buildup cells. JNeurophysiol. 1995;73:2313–2333. doi: 10.1152/jn.1995.73.6.2313. [DOI] [PubMed] [Google Scholar]
- Ratcliff R. A theory of memory retrieval. PsycholRev. 1978;85:59–108. [Google Scholar]
- Ratcliff R, Cherian A, Segraves M. A comparison of macaque behavior and superior colliculus neuronal activity to predictions from models of two-choice decisions. JNeurophysiol. 2003;90:1392–1407. doi: 10.1152/jn.01049.2002. [DOI] [PubMed] [Google Scholar]
- Robinson DA. A method of measuring eye movement using a scleral search coil in a magnetic field. IEEE TransBiomedEng. 1963;10:137–145. doi: 10.1109/tbmel.1963.4322822. [DOI] [PubMed] [Google Scholar]
- Sparks DL and Hartwich-Young R The deep layers of the superior colliculus. In Wurtz RH and Goldberg ME eds. The neurobiology of saccadic eye movements, Reviews of Oculomotor Research, Vol. III. Amsterdam, Elsevier. 1989, 213–256. [PubMed]
- Teichner WH, Krebs MJ. Laws of visual choice reaction time. PsycholRev. 1974;81:75–98. doi: 10.1037/h0035867. [DOI] [PubMed] [Google Scholar]
- Thompson KG, Hanes DP, Bichot NP, Schall JD. Perceptual and motor processing stages identified in the activity of macaque frontal eye field neurons during visual search. JNeurophysiol. 1996;76:4040–4055. doi: 10.1152/jn.1996.76.6.4040. [DOI] [PubMed] [Google Scholar]
- Townsend JT and Ashby FG Stochastic modeling of elementary psychological process. Cambridge, UK, Cambridge University Press. 1983.
- Wurtz RH, Goldberg ME. Activity of superior colliculus in behaving monkey. III. Cells discharging before eye movements. JNeurophysiol. 1972;35:575–586. doi: 10.1152/jn.1972.35.4.575. [DOI] [PubMed] [Google Scholar]
- Wyszecki G and Stiles WS Color Science: Concepts and Methods, Quantitative Data and Formulae. New York, NY, John Wiley & Sons, Inc. 1982, 164–169.