

Abstract
Several research groups have identified a network of regions of the adult cortex that are activated during social perception and cognition tasks. In this paper we focus on the development of components of this social brain network during early childhood and test aspects of a particular viewpoint on human functional brain development: “interactive specialization.” Specifically, we apply new data analysis techniques to a previously published data set of event-related potential (ERP) studies involving 3-, 4-, and 12-month-old infants viewing faces of different orientation and direction of eye gaze. Using source separation and localization methods, several likely generators of scalp recorded ERP are identified, and we describe how they are modulated by stimulus characteristics. We then review the results of a series of experiments concerned with perceiving and acting on eye gaze, before reporting on a new experiment involving young children with autism. Finally, we discuss predictions based on the atypical emergence of the social brain network.
One of the most important functions of the brain is to identify and make sense of the behavior of other humans. As adults, we have regions of the brain specialized for processing and integrating sensory information about the appearance, behavior, and intentions of other humans. Although a variety of regions can be activated by any complex perceptual or cognitive task, a subset of areas appear to be largely dedicated to computations on social stimuli, including the superior temporal sulcus (STS), the fusiform “face area” (FFA), and orbitofrontal cortex (for recent review, see Adolphs, 2003a). For the purposes of this paper, we will confine our discussion to regions involved in the visual perception and understanding of other humans. One of the central debates in cognitive neuroscience concerns the origins of this social brain network in humans, and theoretical arguments abound about the extent to which this is acquired through experience. Further, in several developmental disorders (e.g., autism, Williams syndrome) aspects of social cognition and perception appear to be impaired or deviant. Studying both typical and atypical development in the same tasks, and with the same methodology, can be both mutually informative, and can help reveal underlying mechanisms of developmental change (see Cicchetti, 1984, 1991; Urban, Carlson, Egeland, & Sroufe, 1991). In this paper we discuss and review evidence on how certain cortical regions develop their individual functionality, and become integrated components of the adult human social brain network, in both typical and atypical development.
Much of the research to date attempting to relate brain to behavioral development in humans has been from a “maturational” viewpoint in which the goal is to relate the maturation of particular regions of the brain, usually regions of cerebral cortex, to newly emerging sensory, motor, and cognitive functions. Evidence concerning the differential neuroanatomical development of brain regions can be used to determine an age when a particular region is likely to become functional. Success in a new behavioral task at this age may then be attributed to the maturation of a new brain region. By this view, human functional brain development can be viewed as the reverse of adult neuropsychology, with the difference that specific brain regions (and their corresponding computational modules) are added in instead of being damaged (see Johnson, 2001, 2005, for further discussion). In terms of the social brain network, one can imagine that although some modules are present from birth, other components come on-line at different postnatal ages. From this perspective, developmental deficits in the social brain involve the failure of particular computational modules.
Despite the intuitive appeal and attractive simplicity of the maturational approach, it does not successfully explain some aspects of human functional brain development. For example, recent evidence suggests that some of the regions that are slowest to develop by neuroanatomical criteria show activity from shortly after birth (Johnson, 2001, 2005). Further, where functional activity has been assessed by functional magnetic resonance imaging (fMRI) during a behavioral transition, multiple cortical and subcortical areas appear to change their response pattern (e.g., Luna, Thulborn, Munoz, Merriam, Garver, Minshew, Keshavan, Genovese, Eddy, & Sweeney, 2001), rather than one or two previously silent regions becoming functionally active (mature). Finally, hypotheses about associations between neural and cognitive changes based on age of onset are somewhat unconstrained due to the great variety of neuroanatomical and neurochemical measures that change at different times in different regions of the brain.
In contrast to the above approach, an alternative viewpoint, “interactive specialization” (IS), assumes that postnatal functional brain development, at least within cerebral cortex, involves a process of organizing patterns of interregional interactions (Johnson, 2001, 2005). According to this view, the response properties of a specific region are partly determined by its patterns of connectivity to other regions, and their patterns of activity. During postnatal development changes in the response properties of cortical regions occur as they interact and compete with each other to acquire their role in new computational abilities. From this perspective, some cortical regions may begin with poorly defined functions and are consequently partially activated in a wide range of different contexts and tasks. During development, activity-dependent interactions between regions sharpens the functions of regions such that their activity becomes restricted to a narrower set of circumstances (e.g., a region originally activated by a wide variety of visual objects, may come to confine its response to upright human faces). In other words, modularity (in the sense of regional specialization)is an outcome of postnatal brain development, and not a precursor to it. The onset of new behavioral competencies during infancy will therefore be associated with changes in activity over several regions, and not just by the onset of activity in one or more additional region(s). From this perspective, the social brain network is a product of development that can sometimes fail to emerge for a variety of reasons.
The IS approach: Assumptions and Predictions
Gottlieb (1992) distinguished between two approaches to the study of development, “deterministic epigenesis” in which it is assumed that there is a unidirectional causal path from genes to structural brain changes to psychological function, and “probabilistic epigenesis” in which interactions between genes, structural brain changes, and psychological function are viewed as bidirectional, dynamic, and emergent. It is a defining assumption of the maturational approach that it assumes deterministic epigenesis; region-specific gene expression is assumed to effect changes in intraregional connectivity that, in turn, allows new functions to emerge. A related assumption commonly made within the maturational approach is that there is a one–one mapping between brain and cortical regions and particular cognitive functions, such that specific computations come “on-line” following that maturation of circuitry intrinsic to the corresponding cortical region. In some respects, this view parallels “mosaic” development at the cellular level in which simple organisms (such as Caenorhabditis elegans) are constructed through cell lineages that are largely independent of each other (Elman, Bates, Johnson, Karmiloff–Smith, Parisi, & Plunkett, 1996). Similarly, different cortical regions are assumed to have different maturational timetables, thus enabling new cognitive functions to emerge at different ages relatively independently of each other.
IS (Johnson, 2000, 2001, 2005)has a number of different underlying assumptions. Specifically, a probabilistic epigenesis assumption is coupled with the view that cognitive functions are the emergent product of interactions between different brain regions, and between the whole brain and its external environment. With regard to the second of these assumptions, IS follows recent trends in adult functional neuroimaging. For example, Friston and Price (2001) point out that it may be an error to assume that particular computational functions can be localized within a certain cortical region. Rather, they suggest, the response properties of a cortical region are determined by its patterns of connectivity to other regions as well as by their current activity states. By this view, “the cortical infrastructure supporting a single function may involve many specialized areas whose union is mediated by the functional integration among them” (p. 276). Similarly, in discussing the design and interpretation of adult fMRI studies, Carpenter and collaborators have argued that: “In contrast to a localist assumption of a one–one mapping between cortical regions and cognitive operations, an alternative view is that cognitive task performance is subserved by large-scale cortical networks that consist of spatially separate computational components, each with its own set of relative specializations, that collaborate extensively to accomplish cognitive functions” (Carpenter, Just, Keller, Cherkassky, Roth, & Minshew, 2001, p. 360). Extending these ideas to development, the IS approach emphasizes activity-dependent changes in interregional connectivity, as opposed to the maturation of intraregional connectivity. Whereas the maturational approach may be analogous to mosaic cellular development, the IS view corresponds to the “regulatory” development seen in higher organisms in which cell–cell interactions are critical in determining developmental fate. Although mosaic development can be faster than regulatory, the latter has several advantages. Namely, regulatory development is more flexible and better able to respond to damage, and may be more efficient in terms of genetic coding since genes need only orchestrate cellular-level interactions to yield more complex structures (see Elman et al., 1996).
In addition to the mapping between structure and function at one age, we can also consider how this mapping might change during development. When discussing functional imaging of developmental disorders, Johnson, Halit, Grice, and Karmiloff–Smith (2002) point out that many laboratories have assumed that the relation between brain structure and cognitive function is unchanging during development. Specifically, in accordance with a maturational view, when new structures come on line, the existing (already mature) regions continue to support the same functions they did at earlier developmental stages. This “static assumption” is partly why it is acceptable to study developmental disorders in adulthood and then extrapolate back in time to early development. Contrary to this view, the IS approach suggests that when a new computation or skill is acquired, there is a reorganization of interactions between different cortical structures and regions. This reorganization process may even change how previously acquired cognitive functions are represented in the brain. Thus, the same behavior could potentially be supported by different neural substrates at different ages during development.
Stating that structure–function relations can change with development is all very well, but it lacks the specificity required to make all but the most general predictions. Fortunately, the view that there is competitive specialization of cortical regions during development gives rise to more specific predictions about the types of changes in structure–function relations that should be observed. Specifically, as regions become increasingly selective in their response properties during infancy the overall extent of cortical activation during a given task will decrease. This is because regions that previously responded to a range of different stimuli (e.g., complex animate and inanimate objects), come to confine their activity to a particular class of objects (e.g., upright human faces) and therefore do not respond in the task or stimulus contexts were they used to earlier in development. Evidence in support of this view will be discussed later.
A summary of the general predictions about the neurodevelopment of the social brain network generated from the IS perspective are the following:
During infancy the social brain network will not yet have clearly emerged from surrounding brain regions and networks. One consequence of this is that the distinction between animate and inanimate stimulus processing will be less clear than at older ages. A related consequence is that some “nonsocial” cortical regions will be activated in social tasks and vice versa.
During infancy and early childhood the social brain network will emerge as a whole, and not in a region by region (maturation of modules) manner. Contrary to the maturational view, we predict that even prefrontal cortical regions will be activated by social stimuli as early in development as other parts of the social brain network.
During later infancy and early childhood specialization within the social brain network will occur with different patterns of regional activation for different tasks (e.g., eye gaze processing may become partially distinct from general face processing).
Atypical development can result in a lack of specialization of, or within, the social brain network. The lack of specialization may account for some of the cognitive and behavioral symptoms observed in certain developmental disorders. Atypical development could also result in deviant patterns of specialization.
Although we will undertake a broader review of the available evidence later in this paper, we begin with a review and reanalysis of a series of event-related potential (ERP) studies conducted in our laboratory with typically developing infants. We then proceed to discuss a specific aspect of social brain function: perceiving and acting on eye gaze, and report a recent experiment with young autistic children.
ERPs and Face Processing
Within cognitive neuroscience one the best-studied aspects of the social brain is the visual processing of faces. Face processing is also a good starting point for our discussion, because it is a relatively simple function of the social brain network. Although there is considerable debate about the interpretation of adult functional imaging studies on face perception, there is good general agreement between laboratories on the important regions of cortex. Several cortical regions within the social brain network including regions of the fusiform gyrus, lateral occipital area, and STS (Adolphs, 2003b; Kanwisher, McDermott, & Chun, 1997)have all been implicated in neuroimaging studies as being face-sensitive regions involved in aspects of encoding/detecting facial information. From the IS perspective, there are particular patterns of regional activation within the social brain network that are associated with face processing. The stimulus specificity of response has been most extensively studied for the FFA, a region that is more activated by faces than by many other comparison stimuli including houses, textures, and hands (Kanwisher et al., 1997). Although the greater activation of the FFA to faces than other objects has led some to propose it is a face module (Kanwisher et al., 1997), others call this view into question. In particular, investigations demonstrating that (a) the distribution of response across ventral cortex may be more stimulus specific than the strength of response of a particular region such as FFA (Haxby, Gobbini, Furey, Ishai, Schouten, & Pietrini, 2001; Ishai, Ungerleider, Martin, Schouten, & Haxby, 1999; but see Spiridon & Kanwisher, 2002) and (b) activation of the FFA increases with increasing expertise in discriminating members of non-face categories (Gauthier, Tarr, Anderson, Skudlarski, & Gore, 1999) together suggest that the region may play a more general role in object processing. However, the observation remains that faces activate the FFA more than any other object, and that the distribution of activity over the ventral cortex for faces differs from other objects in that it is more focal and less influenced by attention (Haxby et al., 2001). Therefore, a major debate in the adult literature continues to concern whether the cortical specialization for face processing is a result of expertise with this class of stimulus, or whether cortical structures specialized for face processing result from pre-specified wiring patterns. Data from infants could be highly relevant for resolving this debate because they do not have the years of experience with faces necessary to acquire expertise. Unfortunately, however, for both technical and ethical reasons adult imaging methods are not easily applicable to healthy infants. For this reason, investigators have focused on ERP studies of face processing in infancy (see de Haan, Johnson, & Halit, 2003, for review).
Adults are slower and make more errors in processing inverted than upright faces, although they are often equally good at processing other objects in both orientations (e.g., Yin, 1969). This disruptive effective of inversion on face processing is also observable in ERPs recorded during passive viewing of faces (see later for method description of ERP). In adults and in children at least as young as 4 years, there is a “face-sensitive” negative deflection in the ERP, called the N170, that peaks at around 170 ms after stimulus onset and is most prominent over posterior temporal electrodes (e.g., Bentin, Allison, Puce, Perez, & McCarthy, 1996; Taylor, Edmonds, McCarthy, & Allison, 2001; Taylor, McCarthy, Saliba, & DeGiovanni, 1999). The N170 is of larger amplitude and longer latency to inverted compared to upright faces (Bentin et al., 1996; de Haan, Pascalis, & Johnson, 2002; Eimer, 2000; George, Evans, Fiori, Davidoff, & Renault, 1996; Rebai, Poiroux, Bernard, & Lalonde, 2001; Taylor et al., 2001). In contrast, there is no difference in amplitude or latency of the N170 elicited by upright compared to inverted animal faces (de Haan et al., 2002) or upright compared to inverted objects (Rebai et al., 2001; Rossion, Gauthier, Tarr, Despland, Bruyer, Linotte, & Crommelinck, 2000.). These results suggest that the N170 elicited by the human face is not simply a reaction to the basic configuration of eyes–nose–mouth (because this is also present in animal faces), but is tuned more specifically to characteristics of the upright, human face.
In infants as young as 6 months an ERP component is elicited that has a similar morphology to the adult N170 but with a longer peak latency and smaller amplitude: the N290 (de Haan et al., 2002; Halit, de Haan, & Johnson, 2003). Recent experiments have established that this component is likely a precursor to the adult N170 (Halit, Csibra, Volein, & Johnson, 2004; Halit et al., 2003). However, at 6 months and younger the N290 is not affected by face inversion. This is not because infants of this age cannot detect the difference between upright and inverted faces, as a longer latency ERP component (P400)is affected by orientation. It is not until 12 months of age that a more adultlike response is seen: like adults, 12-month-olds show a larger N170/290 for inverted than upright human faces but no difference in the N170/290 to inverted and upright monkey faces (Halit et al., 2003; see Figure 1). These results are consistent with the idea that the infants’ cortical processing of faces is initially relatively broad and poorly tuned, and only later in development becomes more specific to the upright human face. This type of change is consistent with expectations from the IS perspective on functional brain development. Further, this specialization process likely extends beyond infancy, as there are developmental changes in the characteristics of the N170 throughout childhood (Taylor et al., 1999, 2001).
Figure 1.
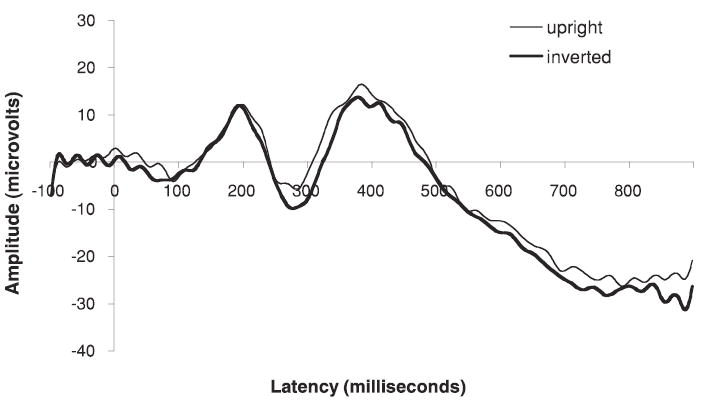
ERP waveforms illustrating the presence and modulation of the face-sensitive N290/N170 component.
Although the above ERP studies have allowed comparison with adult ERPs elicited by faces, without further analysis scalp-recorded potentials do not directly yield information about the underlying generators. In reviewing the use of ERPs with infants, we (Johnson, de Haan, Oliver, Smith, Hatzakis, Tucker, & Csibra, 2001; Richards, 2004) have argued that potentially the best localization of underlying generators will result from a two-stage analysis. In the first step statistically independent spatiotemporal sources could be derived using recently developed “independent component” (ICA) algorithms. In the second step these independent sources could be localized on an appropriate structural MRI. In the present study we apply this two-stage analysis to the following data sets: ERPs elicited by 3-, 4-, and 12-month-olds passively viewing upright and inverted faces (from Halit et al., 2003) and ERPs produced by differing direction of eye gaze (from Farroni, Csibra, Simion, & Johnson, 2002).
All ERP experiments used a similar procedure involving passive viewing of full color faces. ERPs were recorded using an EGI Geodesic Sensor Net (for general methods, see Johnson et al., 2001). We then applied a data analysis procedure described in Richards (2004, 2005; Reynolds & Richards, in press) that involved the following general steps:
ICA (DeLorme, Makeig, Fabre–Thorpe, & Sejnowski, 2002; Jung, Makeig, Westerfield, Townsend, Courchesne, & Sejnowski, 2001; Makeig, Bell, Jung, & Sejnowski, 1996; Makeig, Jung, Bell, Ghahremani, & Sejnowski, 1997) was done separately for each participant, using all the data from that participant in the ICA analysis and using the first 50 of the 62 possible components.
The ICA components were clustered according to the component loadings. These clusters resulted in about 50% of the components in distinct clusters (about 50% of the components could not be organized in a specific cluster).
Single-dipole equivalent current dipole (ECD) models were done on all ICA components. Those components that were clustered together were done by seeding the ECD analysis with a location coming from an ECD of the average components for that cluster. The ECD analysis was accepted only if the resulting dipole was in a location near the average cluster ECD. Those components that were not in a cluster were done with a seed from the each of the clusters, and the best-fitting ECD model was chosen for that component.
After the ECD analysis, the components that had good-fitting ECD models were reviewed by plotting the component topographical maps and confirming visually the component was similar to the average component map. Thus, the final component clusters were topographically similar (Step 2) and had similar ECD dipole locations (Step 3).
The ICA activations of the component clusters were examined in relation to experimental events, that is, the experiment conditions and temporal relation to experimental events.
The first step above involved applying ICA following the procedures outlined by Makeig, Sejnowski, and their associates (DeLorme et al., 2002; Jung et al., 2001; Makeig et al., 1996, 1997). ICA allows the separation of statistically independent spatiotemporal sources. The analysis was done on the “raw EEG” data, that is, not on ERP averages. All EEG segments from a single participant were concatenated. One advantage of this approach is that the activations may be viewed on single trials for single participants, and related to participant characteristics (i.e., age) or experimental conditions (i.e., upright or inverted; direct or averted gaze). The variables for the analysis were the 62 electrode sites, leading to the estimation of 62 components (DeLorme et al., 2002; Jung et al., 2001). The weights were calculated using the extended-ICA algorithm of Lee, Girolami, and Sejnowski (1999), using sphering of the input matrix to aid in convergence, with an initial learning rate of .003. The extended ICA algorithm was originally programmed in Matlab by Scott Makeig and others, and we used the publicly available C++ program from the Matlab versions by Sigurd Enghoff (March, 2000; see www.cnl.salk.edu/~enghoff/). The variance of the projection from each component was calculated, and the 50 components with the largest projection variance were used for the analyses. The first 50 components accounted for over 90% of the variance in EEG for all participants, and more than 95% of the variance in most participants.
The ICA analysis results in loading weights and activations for each component. The inverse of the component weights represents the scoring matrix against which the activations would be multiplied to restore the raw data. These weights represent the topographically coordinated activity in the EEG data. Topographical plots represent the spatial organization of the components (Makeig et al., 1996, 1997), and these weights may be analyzed with cortical source analysis. The component activation has the temporal information in the component. Thus, the temporal morphology of the components was analyzed by examining the component activation for each component along each point in the temporal sequence of the ERP segments. These were analyzed with factorial designs in relation to the experimental factors.
The second step we employed involved component clustering. Specifically, a clustering procedure was done to identify similar ICA components across participants. The ICAs were done separately for each participant. The 50 components from each participant with the largest projection variance were used in the analysis. The clustering of the components followed the procedure used by Richards (2004). The components from two participants from each age were chosen to “seed” the clusters. These ICA components were clustered, with clusters being defined as the minimum distance between clusters. The components from the rest of the participants were then assigned to the clusters initially based on the minimum distance between the cluster centroid and the ICA. These clusters were visually reviewed and were modified to reassign components to clusters and to remove obvious outliers.
The third step involved dipole localization analysis in which we took our statistically independent spatiotemporal components and tried to identify the brain generators that gave rise to these patterns of activity recorded at the scalp. Specifically, the ICA components were analyzed with cortical source analysis (“brain electrical source analysis,” “ECD analysis;” Scherg, 1992; Scherg & Picton, 1991). The ICA component loadings were analyzed with ECD models to determine the fit between the weights describing the component and scalp current generated by hypothetical dipoles (DeLorme et al., 2002; Jung et al., 2001). Cortical source analysis hypothesizes a (a set of ) dipole(s) that generates an electrical current on the scalp. This forward solution may be compared with the component weights, and the dipole location and magnitude is modified to minimize the difference between the generated current map and the component weights. The components that had been assigned to clusters were analyzed with single-dipole models. These analyses were seeded with a location coming from an ECD analysis of the average component from that cluster. The ECD analysis was accepted only if the resulting dipole was in a location near the average component for that cluster. The components that had not been assigned to clusters were analyzed with single-dipole models with a dipole seed from each of the clusters. The ECD analysis of these components were accepted for the best-fitting ECD model and only if the location of the ECD was within 2 standard deviations of the average distance of the clustered ECD models. The EMSE computer program (Source Signal Imaging, San Diego, CA) was used for the ECD analysis.
Several aspects of the cortical source analysis relied on calculating the head shapes of individual participants (Richards, 2004). A structural MR recording was made for a 12-year-old participant and skull/scalp landmarks were measured. An electrode placement map was generated for this individual based on these head measurements and the known locations of the EGI electrodes. The same external head measurements were made for each participant in the present study and electrode placement maps were generated for the participant by transforming the placement map from the individual with the MR recording according to the head measurements of the infant participant. The individualized placement map was used for the individual participant’s ECD analysis. This constrained the locations of the dipoles to a realistic topography based on individual participant data. The locations were then translated into saggital, coronal, and axial coordinates in the Talairach (Talairach & Tournoux, 1988)coordinate system. These coordinates provide a standardized coordinate system for the dipoles across the participants. The MR Viewer (Signal Source Imaging, Inc.)was used to identify the Talairach locations and the mm locations for the individual and to view the MRIs.
In the fourth step of the analysis, topographical plots were made of the ERP averages and the ICA component loadings. The ERP scalp potential maps show the distribution of the scalp potentials at a specific point in time and are useful in visualizing the ERP data shown in figures. The ICA components weights display the spatial organization of the ICA components (Makeig et al., 1996, 1997). The topographical maps consisted of a spherical spline interpolation (Perrin, Pernier, Bertrand, & Echallier, 1989) shown in a radial projection (Perrin, Bertrand, & Pernier, 1987). The EMSE computer program was used for the topographical plots. The fifth and final step our analysis was to relate the results to the experimental conditions, something that we do in the next section.
Cortical Generators and ERP Face Processing Studies in Infants
We used the above analysis to address a number of specific issues (beyond the previously reported ERP results) relating to the IS and maturational viewpoints on the typical development of the social brain network. The primary issue we investigated was whether the majority of the social brain network is (partially) active from early on (consistent with the IS view), or rather, is there a maturational onset of functional regions on the social brain network between 3 and 12 months (consistent with the maturational view)? One secondary issue is whether regions outside the typical adult social brain network are activated by face processing in younger infants but not older ones (as predicted by the IS view). Another issue is whether eye gaze processing activates different cortical regions from general face perception in 4-month-old infants (consistent with the maturational view), or are their still common patterns of activation at this young age (consistent with a process of specialization and the IS view)?
To investigate these hypotheses, we defined a number of regions that have been identified as part of the social brain network in adults. Due to uncertainty about the degree of spatial resolution our methods allow, we included surrounding regions in some cases. The areas selected included relevant parts of prefrontal cortex (PFC), the STS, and surrounding temporal lobe regions, the FFA and surrounding regions, and the lateral occipital area.
The lateral occipital area
As reviewed earlier, this area has been identified as active during face processing in a number of imaging studies. Generators in this area were identified at all ages and in all conditions (see Figure 2). In both left and right hemispheres, at 3 and 12 months these generators discriminated upright from inverted faces, particularly around 250–500 ms after stimulus onset. No clear difference with direction of gaze was observed.
Figure 2.
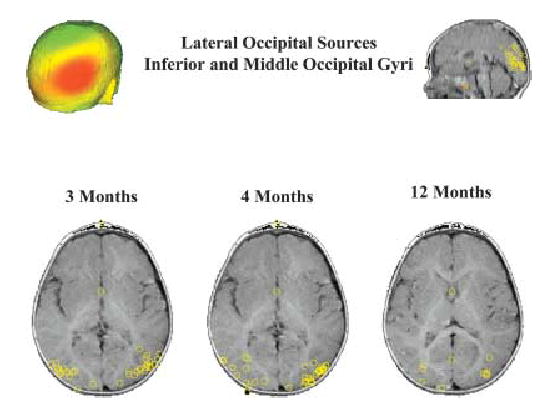
A scalp surface map and generator locations for lateral occipital sources at the three ages.
Temporal lobe areas
Our initial analysis combined several temporal lobe clusters of generators (see Figure 3). These generators in the right hemisphere were more active to upright than to inverted faces at all ages, particularly in the period between 200–500 ms after onset (including the N290). The same was true in two older age groups for left fusiform generators. No clear differences with direction of eye gaze were detected with this overall temporal lobe generator analysis.
Figure 3.
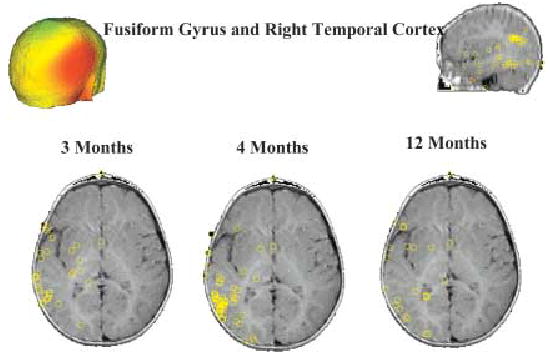
A scalp surface map and generator locations for right temporal cortex sources at the three ages.
In an attempt to examine the functionality of more specific regions within the temporal lobe, we conducted a priori ECDs analysis on specific temporal lobe areas. This analysis revealed that the right STS contributed strongly to the N290 component at all ages and discriminated upright and inverted faces at this latency. Right fusiform generators also appeared to contribute to the N290, and discriminate between upright and inverted faces around this latency. Responses from the left STS and fusiform were less consistent. With regard to eye gaze direction, contrary to results in adults, the fusiform generators discriminated gaze direction more than STS and contributed to the N290 effect discussed earlier. However, we note that both regions showed a longer latency effect (>500 ms) to averted gaze.
PFC
A general analysis of all frontal clusters, excluding only those localizable to eye movement artifact, revealed a general increase in activity from 3 to 12 months. However, frontal clusters were obtained, and generators localized to prefrontal areas, even from our youngest group. Frontal clusters could be further dissociated into dorsolateral PFC, frontal pole, and lateral frontal. Prefrontal areas thought to be part of the social brain network include left frontal operculum) and bilateral orbitofrontal cortex (mainly Brodmann areas 10, 11, and 47). In Figure 4 we illustrate the presence of anterior frontal generators in all three age groups. These anterior frontal generators included some located in orbitofrontal cortex. Although these anterior frontal generators did not respond differently to upright and inverted faces, in the right hemisphere their responses discriminated direct from averted gaze in upright faces. This pattern of response was not seen with other PFC generators.
Figure 4.
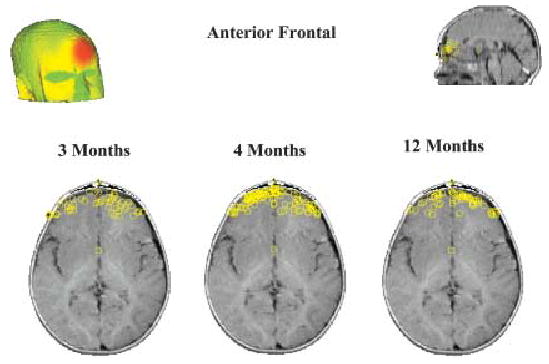
A scalp surface map and generator locations for anterior frontal sources at the three ages.
Our analyses revealed that all of the regions implicated in the adult social brain showed evidence of generators in our source localization analysis at 3, 4, and 12 months. In particular, the right STS and surrounding temporal lobe areas contributed to the N290 at all ages. Although prefrontal and left parietal and temporal generators increased in strength with age, we observed that even from 3 months of age prefrontal regions were activated during face processing (see Figure 4). It is important to note that we do not suggest that the activation of these regions reflects the same computations as occurs in the adult brain, but rather that these regions are partially activated and may have poorly specialized functionality.
The modulation of the N290 by eye gaze direction was associated with several possible neural generators including right temporal regions and right and left FFG (see Figure 3). All of these regions were also associated with the processing of faces in general (difference between upright and inverted faces) at 3 and 12 months. In addition to the N290 effect previously reported, our source localization analysis revealed that some prefrontal regions showed consistently greater activation to faces with direct gaze.
It is important to note that the conclusions above are dependent on the assumptions underlying our source separation and localization analyses. For example, ICA assumes that brain generators are static within the cortex, and region of interest analyses are always subject to the caveat that areas not studied could be effected by the same stimulus or task differences as the regions of interest themselves. Nevertheless, the results from the source localization analysis partially confirmed some of the predictions from the IS approach. Specifically, most of the regions associated with the adult social brain showed generators from the youngest age studied, 3 months. In particular, and contrary to some prevailing views, prefrontal areas were identified from 3 months (although it should be noted that their contribution to the ERP increased with age). Thus, our analysis revealed evidence of the partial activation of most regions of the social brain network from at least 3 months.
ERP Generators and the Typical Social Brain Network: Discussion
Our finding that the whole social brain network is partially active from at least 3 months stands contrary to the view that modules for higher social cognitive functions are silent until coming on-line in later infancy and childhood. Nevertheless, our findings are consistent with the small literature on the social brain network in infancy and childhood. For example, Tzourio–Mazoyer, de Schonen, Crivello, Reutter, Aujard, and Mazoyer (2002) conducted a positron emission tomography (PET) study on six 2-month-old infants from an intensive care unit. The infants were imaged while they watched a static face or a dynamic visual array of moving dots. The patterns of brain activation from the latter were subtracted from the former, to reveal candidate face-sensitive processing areas. In general, Tzourio–Mazoyer and colleagues reported activation of a network of regions similar to those observed in adult face processing tasks, but with some additional regions active. Specifically, regions corresponding to the FFA (in the right hemisphere)and lateral occipital face area were differentially activated by faces. In addition, parietal, left temporal and prefrontal areas were significantly more activated by faces in the infants. The authors suggest that the left (superior temporal) activation is due to automatic activation of speech processing on the presentation of a face. Although the activation of regions of PFC, including bilateral orbitofrontal cortex, is not discussed by these authors, it is consistent with our observations, and with the idea that parts of the PFC involved in the adult social brain are activated by faces even in the first months. Activation of parts of PFC to social stimuli in infants is also consistent with fMRI studies of speech perception in young infants (Dehaene–Lambertz, Dehaene, & Hertz–Pannier, 2002) and possibly even while still in utero (Moore, Vadeyar, Fulford, Tyler, Gribben, Baker, James, & Gowland, 2001). Interestingly, however, our analysis revealed an increase in prefrontal cortical generators with age, whereas in some other tasks decreases in prefrontal activation with age have been reported (see Johnson, 2005, for review).
One region of the adult social brain that was not activated in the Tzourio–Mazoyer et al. (2002) study, but was represented in our analysis is STS. However, as acknowledged by Tzourio–Mazoyer and colleagues this apparent lack of activation could be due to the fact that the face stimuli they used were static, while the subtracted stimulus was dynamic. Given the role of the STS in facial and other biological movement, it is not surprising that the static faces may not have activated the region more than the control stimulus. Further, although STS is not normally activated by non-biological movement in adults, its breadth of response pattern earlier in development is not known. Indeed, on the basis of indirect evidence we have already proposed (Johnson & Farroni, 2003) that it may be activated by a broader range of biological and nonbiological motion. Thus, in infants, the region may have been activated by the control stimulus used in the Tzourio–Mazoyer et al. (2002) study.
Currently, the only developmental fMRI study of face processing that we are aware of compared children (10–12 years old) and adults in a face-matching task (Passarotti, Paul, Bussiere, Buxton, Wong, & Stiles, 2003). Although not all areas of the social brain network were examined in this study, children generally showed a more distributed pattern of activation to faces than did adults. For example, children but not adults showed bilateral middle temporal gyrus activation in response to faces and activated larger areas around the fusiform (face) region.
The functional imaging studies discussed above provide evidence that regions not normally associated with the adult social brain were active in the infants, and possibly also children. Given the limitations of our localization methods this was harder to conclusively ascertain from our ERP studies. In addition, as stated above, our region of interest analysis did not inform us about the activation of outside the social brain network.
With regard to one of the secondary issues that we investigated, the neural generators contributing the processing of direct and averted gaze appeared to be less dissociable in 4 months olds than reports from adult fMRI and ERP studies would suggest, in that the generators that contributed to the N290 effect for eye gaze were the same as those activated during general face processing. Although the STS, a region some have suggested is specifically involved in eye gaze processing in adults, showed greater activation in response to direct than to averted gaze, most of the other components of the social brain also showed modulation by gaze direction (e.g., other parts of the right temporal lobe). In the next section we discuss this issue in more detail.
Perceiving and Acting on the Eyes
In the last section we discussed evidence pertaining to the emergence of the social brain network, and suggested, based on the existing evidence, that this cortical network gradually becomes increasingly encapsulated from other cortical networks. In this section we turn to specialization within the social brain network, and focus on the processing of information about the eyes of other humans. Rather than a single region being attributed a single function, from an IS viewpoint, specialization within a cortical network concerns differential patterns of activation of regions.
The advent of functional imaging has allowed the study of the neural basis of eye gaze processing in adults. Using these methods several authors have established that the STS is activated during eye gaze perception in humans (see Allison, Puce, & McCarthy, 2000, for review). The STS region is defined as being the regions of adjacent cortex on the surface of the superior and middle temporal gyri and adjacent cortex on the surface of the angular gyrus.
Functional imaging studies have also revealed that a network of other cortical areas is activated during the processing of eye gaze. Because the perception of eye gaze involves the detection of movement, one issue is the extent of overlap between structures involved in motion perception, and those engaged by eye gaze processing. For example, the “eye regions” of STS are very close to the MT/V5 area, a structure known to be important for the perception of motion in general. To examine the responses of this latter region, Puce, Allison, Bentin, Gore, and McCarthy (1998) ran a fMRI experiment in which adult participants viewed moving eyes, moving mouths, or movements of checkerboard patterns. The results of this study showed that while all three conditions activated the motion area MT/V5, only moving eyes and mouths activated the STS. These results suggest that the STS is preferentially involved in the perception of gaze direction and mouth movements, but not to nonbiological motion. A magnetic encephalography study by Watanabe, Kakigi, and Puce (2001) found similar results.
Because eyes always occur within the context of a face, another issue is the extent of overlap between the brain basis of eye gaze perception and the regions activated by face processing in general. To address this question Wicker, Michel, Henaff, and Decety (1998) used PET to study the pattern of cortical activation resulting from direct (mutual) eye gaze in adults. They contrasted four experimental conditions; a face with neutral gaze, a face with averted gaze (to the right or left), a face with direction of gaze not visible, and a control condition in which participants kept their own eyes closed. The results were that in all three experimental conditions, regardless of direction of gaze, areas related to face processing were activated. These areas included the occipital pole (striate and extrastriate visual cortex) and the occipitotemporal areas, particularly in the right hemisphere. In addition to these regions, other brain regions were differentially activated by processing direction of gaze, including the occipital part of the fusiform gyrus, the right parietal lobule, the right inferior temporal gyrus, and the middle temporal gyrus in both hemispheres. At the subcortical level there was activation in the right amygdala, the right pulvinar and bilaterally in the middle dorsal thalamic nucleus. These results indicate that the processing of eye gaze is accompanied by a different pattern of activation of regions within the social brain network from the general processing of faces.
One way to investigate the above issues during development is to examine whether the face-sensitive ERP component, the N170/N290, is modulated by the direction of gaze of a face. If the N170/N290 is modulated by direction of gaze, then we can assume that common neural substrates are being activated. If the N170/N290 is not modulated by eye gaze, then we can assume that at least this computational step of face processing is independent of eye gaze direction processing. As discussed above, the face-sensitive ERP component is modulated by gaze direction in 4-month-old infants, but not in adults. This developmental pattern is consistent with infants having merged processing that later separates into two different specialized streams of processing. In other words, face and eye gaze processing originally share common patterns of activation, but with development they partially dissociate. If this is the case, it is possible that some cases of atypical development, such as autism, may be characterized by a lack of, or deviant, specialization within the social brain network.
To investigate this issue, Grice, Halit, Farroni, Baron–Cohen, Bolton, and Johnson (2005) conducted the same eye gaze perception experiment as previously described for typically developing 4-month-olds, but with young children diagnosed with autistic spectrum disorder (ASD) ages 2–5. Although a group of age-matched typically developing control participants and a group of typical adults showed no modulation of their N170 by eye gaze direction, the ASD group showed the same pattern as we had observed in the group of 4-month-olds in that their N290/170 was significantly enhanced when viewing faces with direct gaze. One interpretation of this pattern of results consistent with adult fMRI data is that in adults’ eye direction processing is partially independent of general face processing (structural encoding). In other words, there are different patterns of regional activation within the social brain network for the two tasks. If this specialization occurs during development then, according to the IS view, we may expect to see an earlier stage at which similar patterns of activation occur for the two tasks. In this event general face processing (as indexed by the N170/N290) will be modulated by eye gaze direction. If this specialization process does not occur, or is delayed, then modulation of the N170/N290 by gaze direction may persist into childhood or later. This is the pattern of data observed in young children with autism. Of course, further work will be required in the future to establish the accuracy of this interpretation of our results from children with autism.
Gaze Cueing
Aside from the detection of direct gaze, it is also important to be able to detect the direction of another’s gaze to direct your own attention to the same object or spatial location. Perception of averted gaze can elicit an automatic shift of attention in the same direction in adults (Driver, Davis, Ricciardelli, Kidd, Maxwell, & Baron–Cohen, 1999), allowing the establishment of “joint attention” (Butterworth & Jarrett, 1991). Joint attention to objects is thought to be crucial for a number of aspects of cognitive and social development, including word learning.
Several studies have demonstrated that gaze cues are able to trigger an automatic and rapid shifting of the focus of the adult viewer’s visual attention (Driver et al., 1999; Friesen & Kingstone, 1998; Langton & Bruce, 1999). All these studies used variants of Posner’s “spatial cueing” paradigm (e.g., Posner, 1980), where a central or peripheral cue directs the attention to one of the peripheral locations. When the target appears in the same location where the cue was directed (the congruent position), the participant is faster to look at that target compared to another target at an incongruent position relative to the previous cue. Using this paradigm Schuller and Rossion (2001) presented a face on the screen that was first looking to the subject and then either to the right or the left. Then a target appeared that could be in the same position where the face was looking, or in the opposite position. The results were that facilitation of visual processing by spatial attention is reflected by enhanced early visual evoked potentials (P1 and N1). Reflexive attention increases visual activity and speeds up the processing of visual attention. Probably, in addition to the areas discussed before, eye-gaze tasks activate regions that have been associated with Posner’s “posterior attention network” (Posner, 1980).
When does the ability to use eye-gaze direction as an attentional cue start? Previous work with human infants indicates that they start to discriminate and follow adults’ direction of attention at the age of 3 or 4 months (Hood, Willen, & Driver, 1998; Vecera & Johnson, 1995). In our studies we examined further the visual properties of the eyes that enable infants to follow the direction of the gaze. We tested 4-month-olds using a cueing paradigm adapted from Hood et al. (1998). Each trial begins with the stimulus face eyes blinking (to attract attention), before the pupils shift to either the right or the left for a period of 1500 ms (see Figure 5). A target stimulus was then presented either in the same position where the stimulus face eyes were looking (congruent position)or in a location incongruent with the direction of gaze. By measuring the saccadic reaction time (RT) of infants to orient to the target we demonstrated that the infants were faster to look at the location congruent with the direction of gaze of the face.
Figure 5.
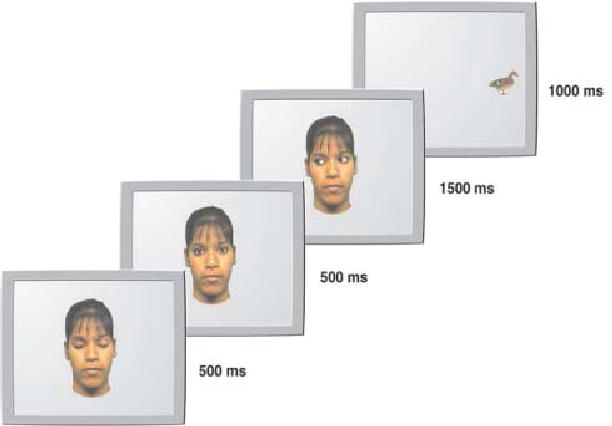
An example of the edited video image illustrating the stimulus sequence for Experiment 1 in Farroni et al. (2000). In this trial the stimulus target (the duck) appears on an incongruent side. From “Infant’s Use of Gaze Direction to Cue Attention: The Importance of Perceived Motion,” by T. Farroni, M. H. Johnson, M. Brockbank, and F. Simion, 2000, Visual Cognition, 7. Copyright 2000 by Psychology Press (www.psypress.co.uk/journals.asp). Reprinted with permission.
In the second experiment of this series, we manipulated the stimulus face so that the whole face was shifted to one side (right or left) while the pupils remained fixed. In this case the infants were faster to look in the direction in which the whole face was shifted, and not the direction where the pupils were directed. Therefore, the infants actually followed the biggest object with lateral motion (i.e., the face) and not the eyes. In a third experiment, we used the same paradigm as in the first experiment, but this time when the eyes were opened the pupils were already oriented to the left or right, and the infants were not able to perceive the movement of the pupils. In this case the cueing effect disappeared. Up to this point, the results suggested that the critical feature for eye gaze cue in infants is the movement of the pupils, and not the final direction of the pupils (Farroni, Johnson, Brockbank, & Simion, 2000).
To try to understand this cueing effect better, we did three further variants of the same procedure (Farroni, Mansfield, Lai, & Johnson, 2003). In the first of these we examined the effect of inverting the face on cueing. If infants are merely cued by motion, then an inverted face should produce the same cueing as an upright one. To our surprise, the results showed that there was no significant cueing effect, suggesting that the context of an upright face may be important. In the next study we presented infants with a face that was initially presented with averted gaze but that then shifted to the center. If infants are responding just to the motion of elements they should be cued in the direction opposite to that initially presented. Again, no cueing effect was observed. These results did not support the hypothesis that directed motion of elements is the only determining factor for the cueing effects.
In the last experiment, a more complex gaze shift sequence allowed us to analyze the importance of beginning with a period of mutual gaze: the eyes shifted from center to averted, and then back to center. Here we did observe a significant cueing effect. Taken together, these results suggest that it is only following a period of mutual gaze with an upright face that cueing effects are observed. In other words, mutual gaze (eye contact) with an upright face may engage mechanisms of attention such that the viewer is more likely to be cued by subsequent motion. In summary, the critical features for eye gaze cueing in infants are (a) lateral motion of elements and (b) a brief preceding period of eye contact with an upright face.
There is evidence from functional neuroimaging that indicates that a network of cortical and subcortical regions are engaged in eye gaze processing in adults (see earlier discussion). This network of structures overlaps with, but does not completely duplicate, the patterns of activation seen in the perception of motion, and the perception of faces in general. Although it may be important to activate the whole network for eye gaze processing, as we discussed earlier one region in particular, the “eye area” of the STS, appears to be critical. The finding that infants are as effectively cued by non-eye motion provides tentative evidence that their STS may be less specialized (finely tuned) than in adults.
Gaze Cueing in Autism
Earlier we speculated that children with autism may have a lack of regional specialization within their social brain network. This suggestion is consistent with the general idea that they are not impaired on the most basic aspects social stimulus processing, such as general face processing and gaze detection, but do suffer difficulties in more challenging aspects of social cognition such as shared or “joint attention” and aspects of “theory of mind” (Baron–Cohen, 1995). There is a large body of evidence in support of early deficits in joint attention in autism (Baron–Cohen, 1989; Charman, Baron–Cohen, Swettenham, Cox, Baird, & Drew, 1998; Sigman, Mundy, Sherman, & Ungerer, 1986) and of delays in the acquisition of a theory of mind (Baron–Cohen, Jolliffe, Mortimore, & Robertson, 1997; Baron–Cohen, Leslie, & Frith, 1985; Baron–Cohen, O’Riordan, Jones, Stone, & Plaisted, 1999; Frith, 2003; Happe, 1994).
To assess whether children with autism show the gaze cueing effect, we used the same task as that described above to study young children with autism. Our sample included 2-to 5-year-old children with autism (ASD group) who were formally diagnosed using DSM-IV criteria and confirmed using the Childhood Autism Rating Scale (CARS, N = 9)and chronologically age-matched groups of typically developing children (N = 15) and children with language delay (LD group), defined as being below cutoff on the CARS and assessed by the Oxford Communicative Development Inventory (Hamilton, Plunkett, & Schafer, 2000; N = 13). Details of populations and their nonverbal mental age are provided in Table 1. Children were recruited from the Cambridge Autism Research Centre and local clinics. Full parental consent was obtained.
Table 1.
Participant information
| Mean Age(months) | SD (months) | Range (months) | |
|---|---|---|---|
| Participants | |||
| Autism spectrum | 33.44 | 5.876 | 29– 46 |
| Language delay | 34.69 | 7.488 | 26–52 |
| Typically developing | 36.17 | 7.469 | 24– 47 |
| Nonverbal mental age | |||
| Autism spectrum conditions | 30.94 | 8.0 | 17– 43 |
| Language delay | 30.61 | 6.04 | 15.5–38.5 |
| Typically developing | 35.41 | 10.07 | 25–56.5 |
Note: Nonverbal mental ages were calculated from scores on the motor and daily living skills subscales from the Vineland Adaptive Behavior Scales (Sparrow, Balla, & Cicchetti, 1984).
The gaze cueing experiment we report here was one of a series of experiments conducted over a several visit to the laboratory. After a period of free play, the children were invited to watch some movies. The children sat in a chair, either alone or accompanied by a parent (whichever they preferred) 70 cm way from a Sony 25-in. high-resolution monitor on which the stimulus items were displayed. The chair was adjusted so that the children’s eye levels were aligned with the center of the monitor. The chair and monitor were enclosed in a small dark area (approximately 3.5 × 7 ft.) with sound attenuation and black drapery around the monitor and along the walls. The children’s eye movements were recorded by a remote-controlled, infrared video camera, positioned below the monitor and facing upward toward the participants. Two speakers were placed out of site, behind the drapery on each side of the monitor.
The stimulus items and sequence were the same as those used in the earlier experiments (Farroni et al., 2000). The video image depicted a women’s face (see Figure 4) whose eyelids opened and closed every 500 ms, giving the appearance of blinking. The side of the face on which the targets appeared was pseudorandom, with an equal number of targets appearing on each side. A target would not appear on the same side on more than three consecutive trials, and the direction of eye gaze independently varied to each side. This results in half the trials constituting a congruent condition (eye gaze and target to the same side) and half constituting an incongruent condition (eye gaze and target to opposite sides).
When the children were properly situated in the chair, an attractor stimulus appeared on the monitor. This was triggered by an experimenter who could see the children through a video monitor. The experimenter then initiated a trial as soon as the child fixated on the stimulus. The trials began with the video image of a female face with eyes blinking. Once the experimenter determined that the child was fixated on the face, a computer key was pressed and the pupils shifted (either to the left or the right), remaining in that position for 1500 ms. There was a 200-ms interval with the eyes open (lids up) immediately preceding each shift of gaze. The face disappeared after the 1500 ms of averted gaze and the target appeared, for 1000 ms (see Figure 5). The blinking face then returned, beginning a new trial. Depending on how much interest in the stimuli the child showed, up to 40 trials were run.
All trials were recorded onto videotape and coded by a researcher blind to the groups and conditions. The latency (RT) variable was the time interval between the target onset and when the child’s saccade reached the target. A time-code generator imprinted times on the videotape during the testing procedure, facilitating the coding process. Trials were included in the analysis only if the child was looking directly at the eyes when they shifted, and only if the children produced a saccade toward the target. A second experimenter reviewed any ambiguous cases. Ambiguous cases that could not be resolved were excluded from the analysis.
Average saccadic RTs were calculated for each subject in both conditions (congruent vs. incongruent) and are presented in Table 2. Planned paired t tests were carried out for each group. The congruent condition produced significantly faster fixation times for the TD group, t (14) = −2.250, p = .02, one tailed, and the LD group, t (12) = −2.630, p = .01, one tailed, but not for the ASD group, t (8) = 1.212, p = .13, one tailed.
Table 2.
Mean reaction times for gaze cueing
| Descriptive Statistics Group | Mean | SD | N |
|---|---|---|---|
| Congruent | |||
| Autism spectrum | 207.8 | 32.7 | 9 |
| Language delayed | 213.6 | 34.2 | 13 |
| Typical development | 240.0 | 26.3 | 15 |
| Total | 222.9 | 33.3 | 37 |
| Incongruent | |||
| Autism spectrum | 203.3 | 34.6 | 9 |
| Language delayed | 223.9 | 43.1 | 13 |
| Typical development | 252.4 | 31.1 | 15 |
| Total | 230.5 | 40.8 | 37 |
A two-way analysis of variance (ANOVA) with repeated measures on trial type revealed a main effect of group, F (2, 34) = 4.92, p = .013, and trial type, F (1, 34) = 4.562, p = .04; and the Group × Trial type interaction approached significance, F (2, 34) = 3.04, p = .06.
The results from our experiment indicated that young children with autism do not show evidence of gaze cueing. This is despite the fact that they were interested in the task and generally quicker than other groups to respond to the targets. This result is consistent with the a lack of neural specialization for eye gaze processing, especially when taken together with the earlier ERP results on eye gaze direction. However, before further discussion of this hypothesis, we need to consider our gaze cueing results in the context of other similar studies.
Senju, Tojo, Dairoku, and Hasegawa (2003) conducted an eye-gaze cueing study similar to that describe above with 10- to 12-year-old children with autism and age-matched controls. In two experiments, the authors compared eye-gaze cueing to arrow cueing and varied the predictability of the cues in relation to the target locations. With a 50% (random) association between cue and target location (as in our experiment) both groups were of children where cued by both eye and arrows. However, when the cues predicted the location on only 20% of trials, the arrow cues were no longer effective in the typically developing children. In contrast, the children with Autism were still cued by both social and non-social cues. The authors concluded that children with autism fail to show the differential sensitivity to social (eye gaze) shown in the typical age-matched controls. In a very similar experiment, Kylliäinen and Hietanen (2004) assessed eye gaze cueing in a group of high functioning children with autism and found no difference from a control group of typical children. However, these authors did acknowledge that the successful performance of the group with autism could have been achieved through the use of different mechanisms.
Although both of the above studies involved children with autism substantially older than those that we studied, in a groundbreaking study Chawarska, Klin, and Volkmar (2003) examined eye gaze cueing with a group of 2-year-old children. In common with our experiment, but unlike the two studies described above, Chawarska and colleagues used saccadic RT as the response measure, and not the time to make a button press. Although Chawarska and colleagues concluded from an analysis of their eye gaze cueing data that their group of children with autism were not impaired in gaze cueing, this was done on the basis of failing to find a significant Trial Type (congruent vs. incongruent) × Group (autism vs. control) interaction (with repeated measures on the former). The independent main effects of group and trial type supported the authors’ conclusion that, although the toddlers with autism showed overall faster RTs, they did not show an impairment in gaze cueing. Although we are inclined to a different conclusion than these authors, our results are actually somewhat similar. We also found that our toddlers with autism were significantly faster in their RTs, and we only observed a borderline significant Group × Trial Type interaction in a two-way ANOVA. Nevertheless, our planned comparisons revealed that while both of our control groups showed significantly faster RTs to congruent targets, the group with autism did not. In fact, this appears largely consistent with the data from Chawarska et al.’s work (see their figure 2).
Because we did not conduct a nonsocial attentional cueing condition, we cannot yet conclude that the deficit we observed is specific to social attention (gaze cueing). One possibility is that a core deficit in ASD is in disengaging or switching attention (e.g., Allen & Courchesne, 2001; Landry & Bryson, 2004). Although the most comparable study to ours (Chawarska et al., 2003) involved a nonsocial cueing condition, both ASD and typical toddlers failed to show cueing with these stimuli. However, with older children Senju et al. (2003) found that the ASD group performed very similarly to the control population suggesting that their deficit could be specific to social attention. Another line of explanation of these results relates to the significantly faster RTs to orient to the targets found in several studies (see also Leekam, Lopez, & Moore, 2000). In general, faster RTs reflect a decreased attentional load (Lavie, Ro, & Russell, 2003). It is important to note that gaze-cueing effects are not found using this paradigm if the face is not extinguished when the peripheral targets appear. The processing demands and hence attentional load of a centrally presented face appear to be too high for this subtle yet reliable effect to become manifest in saccadic behavior. The effect found with toddlers with autism, on the other hand, appears be just the opposite. If the centrally presented face is not being processed as fully or deeply as it is in typically developing populations, additional resources would be available for rapid attention to the peripheral targets.
Most of the above studies agree that gaze cueing in children with autism probably engages different mechanisms from those in typical developing children. Specifically, it is possible that autistic children engage the same mechanisms for eye cueing as for nonsocial stimulus cueing (such as arrow cueing). At the youngest ages tested this shared mechanism may result in poor or absent gaze cueing. In older children the shared mechanisms of biological and nonbiological stimulus cueing may be indicative of a lack of specialization of, or within, the social brain network. In other words, eyes and arrows undergo the same processing in the autistic brain, while only the former stimulus engages the social brain network following typical development.
Conclusions and Future Prospects
We discussed evidence on the aspects of the development of the social brain network in relation to different perspectives on human functional brain development. In the relatively well-studied case of face perception, when evidence from several developmental ages is taken into account, we argued that the IS view can best account for the generators of ERP data. In the less well-studied case of eye-gaze processing, the evidence obtained thus far is also consistent with the IS approach (without ruling out alternatives). From this perspective atypical development can involve a failure of specialization of, and within, the social brain network. Preliminary evidence relating to this hypothesis from young children with autism was presented and discussed. General symptoms of such a failure will include applying general stimulus processing to social stimuli, and partial or complete failure to develop the modular organization characteristic of adult social cognition. Future work on the typical and atypical development of the human social brain network will require the application of noninvasive brain imaging to more complex aspects of social cognition such as the perception of action and predicting the actions of others. Finally, we believe that it is only through studying both typical and atypical development with the same tasks and methods that progress in developmental psychopathology will be made.
Footnotes
This work was funded by UK Medical Research Council Programme Grants (G9901005 and G9715587) to M.H.J. and S.B.C. T.F. was supported by a Wellcome Trust Research Fellowship (073985/Z/03/Z).
References
- Adolphs R. Cognitive neuroscience of human social behaviour. Nature Reviews: Neuroscience. 2003a;4:165–178. doi: 10.1038/nrn1056. [DOI] [PubMed] [Google Scholar]
- Adolphs R. Investigating the cognitive neuroscience of social behavior. Neuropsychologia. 2003b;41:119–126. doi: 10.1016/s0028-3932(02)00142-2. [DOI] [PubMed] [Google Scholar]
- Allen G, Courchesne E. Attention function and dysfunction in autism. Frontiers in Bioscience. 2001;6:105–119. doi: 10.2741/allen. [DOI] [PubMed] [Google Scholar]
- Allison T, Puce A, McCarthy G. Social perception from visual cues: Role of STS region. Trends in Cognitive Sciences. 2000;4:267–278. doi: 10.1016/s1364-6613(00)01501-1. [DOI] [PubMed] [Google Scholar]
- Baron–Cohen S. Joint attention deficits in autism: Towards a cognitive analysis. Development and Psychopathology. 1989;1:185–189. [Google Scholar]
- Baron–Cohen, S. (1995). Mindblindness: An essay on autism and theory of mind Cambridge, MA: MIT Press.
- Baron–Cohen S, Jolliffe T, Mortimore C, Robertson M. Another advanced test of theory of mind: Evidence from very high functioning adults with autism or Asperger syndrome. Journal of Child Psychology and Psychiatry. 1997;38:813–822. doi: 10.1111/j.1469-7610.1997.tb01599.x. [DOI] [PubMed] [Google Scholar]
- Baron–Cohen S, Leslie AM, Frith U. Does the autistic child have a “theory of mind”? Cognition. 1985;21:37– 46. doi: 10.1016/0010-0277(85)90022-8. [DOI] [PubMed] [Google Scholar]
- Baron–Cohen S, O’Riordan M, Jones R, Stone V, Plaisted K. A new test of social sensitivity: Detection of faux pas in normal children and children with Asperger syndrome. Journal of Autism and Developmental Disorders. 1999;29:407– 418. doi: 10.1023/a:1023035012436. [DOI] [PubMed] [Google Scholar]
- Bentin S, Allison T, Puce A, Perez E, McCarthy G. Electrophysiological studies of face perception in humans. Journal of Cognitive Neuroscience. 1996;8:551–565. doi: 10.1162/jocn.1996.8.6.551. [DOI] [PMC free article] [PubMed] [Google Scholar]
- Butterworth G, Jarrett N. What minds have in common is space: Spatial mechanisms serving joint visual attention in infancy. British Journal of Developmental Psychology. 1991;9:55–72. [Google Scholar]
- Carpenter, P. A., Just, M. A., Keller, T., Cherkassky, V., Roth, J. K., & Minshew, N. (2001). Dynamic cortical systems subserving cognition: fMRI studies with typical and atypical individuals. In J. L. McClelland & R. S. Siegler (Eds.), Mechanisms of cognitive development (pp. 353–386). Mahwah, NJ: Erlbaum.
- Charman T, Baron–Cohen S, Swettenham J, Cox A, Baird G, Drew A. An experimental investigation of social–cognitive abilities in infants with autism: Clinical implications. Infant Mental Health Journal. 1998;19:260–275. [Google Scholar]
- Chawarska K, Klin A, Volkmar F. Automatic attention cueing through eye movement in 2-year-old children with autism. Child Development. 2003;74:1108–1122. doi: 10.1111/1467-8624.00595. [DOI] [PubMed] [Google Scholar]
- Cicchetti D. The emergence of developmental psychopathology. Child Development. 1984;55:1–7. [PubMed] [Google Scholar]
- Cicchetti D. Fractures in the crystal: Developmental psychopathology and the emergence of the self. Developmental Review. 1991;11:271–287. [Google Scholar]
- de Haan M, Johnson MH, Halit H. Development of face-sensitive event-related potential components during infancy. International Journal of Psychophysiology. 2003;51:45–58. doi: 10.1016/s0167-8760(03)00152-1. [DOI] [PubMed] [Google Scholar]
- de Haan M, Pascalis O, Johnson MH. Specialization of neural mechanisms underlying face recognition in human infants. Journal of Cognitive Neuroscience. 2002;14:199–209. doi: 10.1162/089892902317236849. [DOI] [PubMed] [Google Scholar]
- Dehaene–Lambertz G, Dehaene S, Hertz–Pannier L. Functional neuroimaging of speech perception in infants. Science. 2002;298:2013–2015. doi: 10.1126/science.1077066. [DOI] [PubMed] [Google Scholar]
- DeLorme A, Makeig S, Fabre–Thorpe M, Sejnowski T. From single-trial EEG to brain area dynamics. Neurocomputing. 2002;44–46:1057–1064. [Google Scholar]
- Driver J, Davis G, Ricciardelli P, Kidd P, Maxwell E, Baron–Cohen S. Gaze perception triggers reflexive visuo-spatial orienting. Visual Cognition. 1999;6:509–540. [Google Scholar]
- Eimer M. Effects of face inversion on the structural encoding and recognition of faces: Evidence from event-related brain potentials. Cognitive Brain Research. 2000;10:145–158. doi: 10.1016/s0926-6410(00)00038-0. [DOI] [PubMed] [Google Scholar]
- Elman, J., Bates, E., Johnson, M. H., Karmiloff–Smith, A., Parisi, D., & Plunkett, K. (1996). Rethinking innateness: A connectionist perspective on development Cambridge, MA: MIT Press.
- Farroni T, Csibra G, Simion F, Johnson MH. Eye contact detection in humans from birth. Proceedings of the National Academy of Sciences USA. 2002;99:9602–9605. doi: 10.1073/pnas.152159999. [DOI] [PMC free article] [PubMed] [Google Scholar]
- Farroni T, Johnson MH, Brockbank M, Simion F. Infant’s use of gaze direction to cue attention: The importance of perceived motion. Visual Cognition. 2000;7:705–718. [Google Scholar]
- Farroni T, Mansfield EM, Lai C, Johnson MH. Motion and mutual gaze in directing infants’spatial attention. Journal of Experimental Child Psychology. 2003;85:199–212. doi: 10.1016/s0022-0965(03)00022-5. [DOI] [PubMed] [Google Scholar]
- Friesen CK, Kingstone A. The eyes have it! Reflexive orienting is triggered by nonpredictive gaze. Psychonomic Bulletin and Review. 1998;5:490– 495. [Google Scholar]
- Friston KJ, Price CJ. Dynamic representation and generative models of brain function. Brain Research Bulletin. 2001;54:275–285. doi: 10.1016/s0361-9230(00)00436-6. [DOI] [PubMed] [Google Scholar]
- Frith, U. (2003). Autism: Explaining the Enigma (2nd ed.). Oxford: Blackwell.
- Gauthier I, Tarr MJ, Anderson AW, Skudlarski P, Gore JC. Activation of the middle fusiform “face area” increases with expertise in recognizing novel objects. Nature Neuroscience. 1999;2:568–573. doi: 10.1038/9224. [DOI] [PubMed] [Google Scholar]
- George N, Evans J, Fiori N, Davidoff J, Renault B. Brain events related to normal and moderately scrambled faces. Cognitive Brain Research. 1996;4:65–76. doi: 10.1016/0926-6410(95)00045-3. [DOI] [PubMed] [Google Scholar]
- Gottlieb, G. (1992). Individual development and evolution New York: Oxford University Press.
- Grice SJ, Halit H, Farroni T, Baron–Cohen S, Bolton P, Johnson MH. Neural correlates of eye-gaze detection in young children with autism. Cortex. 2005;41:342–353. doi: 10.1016/s0010-9452(08)70271-5. [DOI] [PubMed] [Google Scholar]
- Halit H, Csibra G, Volein Á, Johnson MH. Face-sensitive cortical processing in early infancy. Journal of Child Psychology and Psychiatry. 2004;45:1228–1234. doi: 10.1111/j.1469-7610.2004.00321.x. [DOI] [PubMed] [Google Scholar]
- Halit H, de Haan M, Johnson MH. Cortical specialisation for face processing: Face-sensitive event-related potential components in 3 and 12 month-old infants. NeuroImage. 2003;19:1180–1193. doi: 10.1016/s1053-8119(03)00076-4. [DOI] [PubMed] [Google Scholar]
- Hamilton A, Plunkett K, Schafer G. Infant vocabulary development assessed with a British Communicative Development Inventory: Lower score in the UK than in the USA. Journal of Child Language. 2000;27:689–705. doi: 10.1017/s0305000900004414. [DOI] [PubMed] [Google Scholar]
- Happe, F. (1994). Autism: An introduction to psychological theory London: UCL Press.
- Haxby JV, Gobbini MI, Furey ML, Ishai A, Schouten JL, Pietrini P. Distributed and overlapping representations of faces and objects in ventral temporal cortex. Science. 2001;293:2425–2430. doi: 10.1126/science.1063736. [DOI] [PubMed] [Google Scholar]
- Hood BM, Willen JD, Driver J. Adult’s eyes trigger shifts of visual attention in human infants. Psychological Science. 1998;9:131–134. [Google Scholar]
- Ishai A, Ungerleider LG, Martin A, Schouten JL, Haxby JV. Distributed representation of objects in the human ventral visual pathway. Proceedings of the National Academy of Science USA. 1999;96:9379–9384. doi: 10.1073/pnas.96.16.9379. [DOI] [PMC free article] [PubMed] [Google Scholar]
- Johnson MH. Functional brain development in infants: Elements of an interactive specialization framework. Child Development. 2000;71:75–81. doi: 10.1111/1467-8624.00120. [DOI] [PubMed] [Google Scholar]
- Johnson MH. Functional brain development in humans. Nature Reviews: Neuroscience. 2001;2:475– 483. doi: 10.1038/35081509. [DOI] [PubMed] [Google Scholar]
- Johnson, M. H. (2005). Developmental cognitive neuroscience: An introduction (2nd ed.). Oxford: Blackwell.
- Johnson MH, de Haan M, Oliver A, Smith W, Hatzakis H, Tucker LA, Csibra G. Recording and analyzing high-density event-related potentials with infants using the Geodesic Sensor Net. Developmental Neuropsychology. 2001;19:295–323. doi: 10.1207/S15326942DN1903_4. [DOI] [PubMed] [Google Scholar]
- Johnson, M. H., & Farroni, T. (2003). Perceiving and acting on the eyes: The development and neural basis of eye gaze perception. In O. Pascalis & A. Slater (Eds.), The development of face processing in infancy and early childhood: Current perspectives (pp. 155–168). New York: Nova Science Publishers.
- Johnson MH, Halit H, Grice S, Karmiloff–Smith A. Neuroimaging of typical and atypical development: A perspective from multiple levels of analysis. Development and Psychopathology. 2002;14:521–536. doi: 10.1017/s0954579402003073. [DOI] [PubMed] [Google Scholar]
- Jung TP, Makeig S, Westerfield M, Townsend J, Courchesne E, Sejnowski T. Analysis and visualization of single-trial event-related potentials. Human Brain Mapping. 2001;14:166–185. doi: 10.1002/hbm.1050. [DOI] [PMC free article] [PubMed] [Google Scholar]
- Kanwisher N, McDermott J, Chun MM. The fusiform face area: A module in human extrastriate cortex specialized for face perception. The Journal of Neuroscience. 1997;17:4302– 4311. doi: 10.1523/JNEUROSCI.17-11-04302.1997. [DOI] [PMC free article] [PubMed] [Google Scholar]
- Kylliäinen A, Hietanen JK. Attention orienting by another’s gaze direction in children with autism. Journal of Child Psychology and Psychiatry. 2004;45:435. doi: 10.1111/j.1469-7610.2004.00235.x. [DOI] [PubMed] [Google Scholar]
- Landry R, Bryson SE. Impaired disengagement of attention in young children with autism. Journal of Child Psychology and Psychiatry. 2004;45:1115–1122. doi: 10.1111/j.1469-7610.2004.00304.x. [DOI] [PubMed] [Google Scholar]
- Langton SRH, Bruce V. Reflexive visual orienting in response to the social attention of others. Visual Cognition. 1999;6:541–567. [Google Scholar]
- Lavie N, Ro T, Russell C. The role of perceptual load in processing distractor faces. Psychological Science. 2003;14:510–515. doi: 10.1111/1467-9280.03453. [DOI] [PubMed] [Google Scholar]
- Lee TW, Girolami M, Sejnowski TJ. Independent component analysis using an extended infomax algorithm for mixed sub-Gaussian and super-Gaussian Sources. Neural Computation. 1999;11:417– 441. doi: 10.1162/089976699300016719. [DOI] [PubMed] [Google Scholar]
- Leekam SR, Lopez B, Moore C. Attention and joint attention in preschool children with autism. Developmental Psychology. 2000;36:261–273. doi: 10.1037//0012-1649.36.2.261. [DOI] [PubMed] [Google Scholar]
- Luna B, Thulborn KR, Munoz DP, Merriam EP, Garver KE, Minshew NJ, Keshavan MS, Genovese CR, Eddy WF, Sweeney JA. Maturation of widely distributed brain function subserves cognitive development. NeuroImage. 2001;13:786–793. doi: 10.1006/nimg.2000.0743. [DOI] [PubMed] [Google Scholar]
- Makeig S, Bell AJ, Jung TP, Sejnowski T. Independent component analysis of electroencephalographic data. Advances in Neural Information Processing Systems. 1996;8:145–151. [Google Scholar]
- Makeig S, Jung TP, Bell AJ, Ghahremani D, Sejnowski TJ. Blind separation of event-related brain responses into independent components. Proceedings of the National Academy of Sciences USA. 1997;94:10979–10984. doi: 10.1073/pnas.94.20.10979. [DOI] [PMC free article] [PubMed] [Google Scholar]
- Moore RJ, Vadeyar SH, Fulford J, Tyler DJ, Gribben C, Baker PN, James DK, Gowland PA. Antenatal determination of fetal brain activity in response to an acoustic stimulus using functional magnetic resonance imaging. Human Brain Mapping. 2001;12:94–99. doi: 10.1002/1097-0193(200102)12:2<94::AID-HBM1006>3.0.CO;2-E. [DOI] [PMC free article] [PubMed] [Google Scholar]
- Passarotti AM, Paul BM, Bussiere JR, Buxton RB, Wong EC, Stiles J. The development of face and location processing: An fMRI study. Developmental Science. 2003;6:100–117. [Google Scholar]
- Perrin F, Bertrand O, Pernier J. Scalp current density mapping: Value and estimation from potential data. IEEE Transactions on Biomedical Engineering. 1987;34:283–288. doi: 10.1109/tbme.1987.326089. [DOI] [PubMed] [Google Scholar]
- Perrin F, Pernier J, Bertrand O, Echallier JF. Spherical splines for scalp potential and current density mapping. Electroencephalography and Clinical Neurophysiology. 1989;72:184–187. doi: 10.1016/0013-4694(89)90180-6. [DOI] [PubMed] [Google Scholar]
- Posner MI. Orienting of attention. Quarterly Journal of Experimental Psychology. 1980;32:3–25. doi: 10.1080/00335558008248231. [DOI] [PubMed] [Google Scholar]
- Puce A, Allison T, Bentin S, Gore JC, McCarthy G. Temporal cortex activation in human viewing eye and mouth movements. Journal of Neuroscience. 1998;18:2188–2199. doi: 10.1523/JNEUROSCI.18-06-02188.1998. [DOI] [PMC free article] [PubMed] [Google Scholar]
- Rebai M, Poiroux S, Bernard C, Lalonde R. Event-related potentials for category-specific information during passive viewing of faces and objects. International Journal of Neuroscience. 2001;106:209–226. doi: 10.3109/00207450109149750. [DOI] [PubMed] [Google Scholar]
- Reynolds, G. D., & Richards, J. E. (in press). Familiarization, attention, and recognition memory in infancy: An ERP and cortical source localization study. Developmental Psychology [DOI] [PMC free article] [PubMed]
- Richards JE. Recovering cortical dipole sources from scalp-recorded event-related-potentials using component analysis: Principal component analysis and independent component analysis. International Journal of Psychophysiology. 2004;54:201–220. doi: 10.1016/j.ijpsycho.2004.03.009. [DOI] [PubMed] [Google Scholar]
- Richards JE. Localizing cortical sources of event-related potentials in infants’ covert orienting. Developmental Science. 2005;8:255–278. doi: 10.1111/j.1467-7687.2005.00414.x. [DOI] [PMC free article] [PubMed] [Google Scholar]
- Rossion B, Gauthier I, Tarr MJ, Despland P, Bruyer R, Linotte S, Crommelinck M. The N170 occipito-temporal component is delayed and enhanced to inverted faces but not to inverted objects: An electrophysiological account of face-specific processes in the human brain. NeuroReport. 2000;11:69–74. doi: 10.1097/00001756-200001170-00014. [DOI] [PubMed] [Google Scholar]
- Scherg M. Functional imaging and localization of electromagnetic brain activity. Brain Topography. 1992;5:103–111. doi: 10.1007/BF01129037. [DOI] [PubMed] [Google Scholar]
- Scherg M, Picton TW. Separation and identification of event-related potential components by brain electric source analysis. Electroencephalography & Clinical Neurophysiology. 1991;42(Suppl):24–37. [PubMed] [Google Scholar]
- Schuller AM, Rossion B. Spatial attention triggered by eye gaze increases and speeds up early visual activity. NeuroReport. 2001;12:2381–2386. doi: 10.1097/00001756-200108080-00019. [DOI] [PubMed] [Google Scholar]
- Senju A, Tojo Y, Dairoku H, Hasegawa T. Reflexive orienting in response to eye gaze and an arrow in children with and without autism. Journal of Child Psychology and Psychiatry. 2003;44:1–14. doi: 10.1111/j.1469-7610.2004.00236.x. [DOI] [PubMed] [Google Scholar]
- Sigman M, Mundy P, Sherman T, Ungerer J. Social interactions of autistic, mentally retarded and normal children and their caregivers. Journal of Child Psychology and Psychiatry. 1986;5:647– 655. doi: 10.1111/j.1469-7610.1986.tb00189.x. [DOI] [PubMed] [Google Scholar]
- Sparrow, S., Balla, D., & Cicchetti, D. (1984). Vineland Adaptive Behavior Scales (interview edition) Circle Pines, MN: American Guidance Service.
- Spiridon M, Kanwisher N. How distributed is visual category information in human occipital–temporal cortex? An fMRI study. Neuron. 2002;35:1157–1165. doi: 10.1016/s0896-6273(02)00877-2. [DOI] [PubMed] [Google Scholar]
- Talairach, J., & Tournoux, P. (1988). Co-planar stereotactic atlas of the human brain New York: Thieme Medical Publishers.
- Taylor MJ, Edmonds GE, McCarthy G, Allison T. Eyes first! Eye processing develops before face processing in children. NeuroReport. 2001;12:1671–1676. doi: 10.1097/00001756-200106130-00031. [DOI] [PubMed] [Google Scholar]
- Taylor MJ, McCarthy G, Saliba E, DeGiovanni E. ERP evidence of developmental changes in processing of faces. Clinical Neurophysiology. 1999;110:910–915. doi: 10.1016/s1388-2457(99)00006-1. [DOI] [PubMed] [Google Scholar]
- Tzourio–Mazoyer N, de Schonen S, Crivello F, Reutter B, Aujard Y, Mazoyer B. Neural correlates of woman face processing by 2-month-old infants. NeuroImage. 2002;15:454– 461. doi: 10.1006/nimg.2001.0979. [DOI] [PubMed] [Google Scholar]
- Urban J, Carlson EA, Egeland B, Sroufe LA. Patterns of individual adaptation across childhood. Development and Psychopathology. 1991;3:445–560. [Google Scholar]
- Vecera SP, Johnson MH. Eye gaze detection and the cortical processing of faces: Evidence from infants and adults. Visual Cognition. 1995;2:101–129. [Google Scholar]
- Watanabe S, Kakigi R, Puce A. Occipito-temporal activity elicited by viewing eye movements: A magnetoencephalographic study. NeuroImage. 2001;13:351–363. doi: 10.1006/nimg.2000.0682. [DOI] [PubMed] [Google Scholar]
- Wicker B, Michel F, Henaff MA, Decety J. Brain regions involved in the perception of gaze: A PET study. NeuroImage. 1998;8:221–227. doi: 10.1006/nimg.1998.0357. [DOI] [PubMed] [Google Scholar]
- Yin RK. Looking at upside down faces. Journal of Experimental Psychology. 1969;81:141–145. [Google Scholar]