

Abstract
This study used cortical source analysis to locate potential cortical sources of event-related potentials (ERPs) during covert orienting in infants aged 14 and 20 weeks. The infants were tested in a spatial cueing procedure. The reaction time to localize the target showed response facilitation for valid trials relative to invalid or neutral trials. High-density EEG (126 channels) was recorded during the task, and independent component analysis and equivalent current dipole analysis was used to estimate the cortical sources of the EEG during the task. There was a larger P1 ERP component on the valid trials than the other trials (P1 validity effect). The cortical source analysis suggested that this occurred due to activity in Brodmann’s areas 18 and 19. A presaccadic ERP component occurred over the frontal scalp areas (−65 ms) and was larger to a target in a cued location than in uncued locations. A potential cortical source for this ERP component was the superior frontal gyrus on the inferior portion of the prefrontal cortex. Increases from 14 to 20 weeks in amplitude of the P1 validity effect and the presaccadic ERP could be modeled by an increase in activation in the corresponding cortical areas.
Infants can shift their attention to different regions of space by covertly moving attention without moving the eyes. Several studies with young infants have studied covert orienting in young infants with a spatial cueing procedure. The cueing procedure used in infant work (e.g. Hood, 1993, 1995; Hood & Atkinson, 1991; Richards, 2000a, 2000b, 2001, 2003a, 2004b) presents a central visual stimulus to engage fixation. A peripheral stimulus of relatively short duration is added to the display (‘cue’) and infants will continue to direct fixation to the central stimulus. If the peripheral stimulus is then presented by itself (‘target’) at a short delay after all stimuli are turned off, the infant will shift fixation more quickly to a target presented in the same location (‘valid’ trial) than a target appearing in a location that was not previously cued (‘invalid’ or ‘neutral’ trials). This speeding of reaction time has been termed ‘facilitation’. Alternatively, if the delay between the cue and target is longer, the shift of fixation to the target will be slower on valid than on other trials, ‘inhibition of return’. The modification of reaction time by the cue-target spatial relation implies that the infants shifted attention toward the cued location without an overt eye movement. Two recent studies used scalp-recorded event-related potentials (ERPs) in this spatial cueing task (Richards, 2000a, 2001). Those studies found an ERP component associated with the onset of a valid target and an ERP component associated with the saccade toward a target in the cued location. The current study used high-density EEG recording, independent component analysis (ICA), and cortical source analysis to examine the cortical areas involved in infant covert shifts of attention.
Most researchers have a neurophysiological component for their explanation of covert attention and researchers studying infants’ covert attention have adopted this perspective. Facilitation of reaction time is attributed to an enhancement of the brain area involved in the early stages of visual information processing. This enhancement results in increased efficiency of processing information in the attended location (Eimer, 1996, 1997; Hillyard, Mangun, Woldroff & Luck, 1995; Posner, 1980). The inhibition of return effect is thought to be mediated by the superior colliculus (see review by Rafal, 1998) and additional cortical structures that inhibit the reflexive saccadic movements toward the cue. The enhancement and inhibition processes are hypothesized to be controlled by a ‘posterior attention network’ involving the parietal cortex, regions of the thalamus projecting to the parietal cortex (e.g. pulvinar), frontal eye fields, and the superior colliculus (Posner, 1995; Posner & Petersen, 1990). This neurophysiological perspective has been adopted by researchers studying infants in the spatial cueing procedure (Hood, 1993, 1995; Hood, Atkinson & Braddick, 1998; Johnson, Posner & Rothbart, 1994; Johnson, Gilmore & Csibra, 1998; Richards, 2000a Richards, 1996; Johnson & Tucker, 2000b, 2001b, 2003a, 2004b). A generally accepted view in this area is that inhibition of return following covert orienting does not reliably occur in infants before 6 months of age (e.g. Richards, 2000a). The emergence of inhibition of return is hypothesized to be due to increases in the cortical control of eye movements, perhaps in developmental changes in the parietal cortex. Alternatively, the facilitation of reaction time following brief stimulus-onset-asynchronies has been reported in 3- and 4-month-old infants (Johnson & Tucker, 1996; Richards, 2000a, 2000b, 2001). This implies that the enhancement of the brain areas leading to facilitation emerges at an earlier age than do brain processes supporting inhibition of return.
One difficulty with the neurophysiological interpretations of infant covert orienting is that most studies of infant covert orienting to date have inferred brain development from the changes in the overtly measured reaction times (Richards & Hunter, 2002). Two recent studies have used ERP measures in a preliminary attempt to localize the cortical areas that may be involved in infant covert orienting (Richards, 2000a, 2001). Both studies reported a presaccadic ERP component that occurred on the trials on which the target was in the same location as the cue. This presaccadic activity was a small positive component occurring about 50 ms before the onset of the saccade to the target in the cued location. This component did not occur, or was smaller, for saccades toward a target that appeared in a different location than the cue (or with no cue), and for saccades that occurred to the cued location when the target was not present. The presaccadic ERP component was hypothesized to reflect cortically based saccade planning (Csibra, Johnson & Tucker, 1997; Csibra, Tucker & Johnson, 1998, 2001; Richards, 2000a Richards, 1998; Johnson et al., 2001). A second finding in those studies was activity occurring in relation to target onset. At about 150 ms following the onset of a target on the valid trials, there was a large positive ERP component. This component was smaller on the invalid and neutral trials. This finding was similar to the ‘P1 validity effect’ reported in adult studies where the P1 ERP component, occurring about 80–100 ms following target onset, was greater on the valid than on invalid or neutral trials (Eimer, 1996, 1997; Harter, Miller, Price, LaLonde & Keyes, 1989; Hillyard, Luck & Mangun, 1994; Hopfinger & Mangun, 1998; Mangun & Hillyard, 1991). These two studies made some progress in identifying the cortical areas involved in infants’ covert shifts of attention. However, these ERP changes reflect scalp electrical activity and the underlying cortical sources of such activity cannot be inferred directly from ERP studies.
The primary goal of the current study was to use cortical source analysis of EEG to infer the cortical sources underlying covert orienting in young infants. This was done by using high-density EEG recording (126 channels) during a spatial cueing task, using ICA to estimate temporal-spatial components in the EEG, and estimating cortical sources of the EEG with equivalent current dipole (ECD) analysis. A spatial ICA was done in which the variables were the EEG channels and the observations were the ms intervals for which the EEG was sampled. The component weights resulting from the ICA represent the topographical information in the EEG and are similar to a set of topographic scalp maps (Johnson, de Haan, Oliver, Smith, Hatzakis, Tucker & Csibra, 2001; Jung, Makeig, Humphries, Lee, McKeown, Iragui & Sejnowski, 2000a; Jung, Makeig, Lee, McKeown, Brown, Bell & Sejnowski, 2000b; Jung, Makeig, McKeown, Bell, Lee & Sejnowski, 2001a; Jung, Makeig, Westerfield, Townsend, Courchesne & Sejnowski, 2001b; Richards, 2002, 2004a). These component weights can then be used with cortical source analysis (e.g. Scherg, 1990, 1992; Scherg & Picton, 1991; Huizenga & Molenaar, 1994). Cortical source analysis estimates a (set of) dipole(s) located in the cortex representing a current source that generates the observed scalp-recorded electrical activity. A recent use of ICA has applied it to single-trial EEG data, extracted components, and estimated equivalent current dipoles from the resulting component weights (DeLorme, Makeig, Fabre-Thorpe & Sejnowski, 2002; Jung et al., 2000b, 2001b; Reynolds & Richards, in press; Richards, 2002). Principal components analysis (PCA) also has been used for such cortical source analysis (Dien, 1999; Richards, 2003b).
This study used a spatial cueing procedure (Hood, 1995; Hood & Atkinson, 1991; Richards, 2000a, 2000b, 2001, 2003a, 2004b) to produce covert orienting of attention in 14- and 20-week-old infants, and ICA and cortical source analysis to examine the cortical sources of the EEG activity occurring during this task. The procedure of the study duplicated that of Richards (2000a, 2000b, 2001). A visual stimulus was presented for 2 seconds and then a peripheral stimulus (‘cue’) was presented in addition to the central stimulus. After the stimuli were turned off, at a stimulus-onset-asynchrony of 450 ms the same peripheral stimulus was presented on the same side as the cue (valid trial), on the opposite side (invalid trial), following no cue (neutral trial), or no target was presented (no-target control trial). This procedure has resulted in facilitation of reaction time in infants in this age range (Richards, 2000a, 2000b, 2001). High-density EEG (126 channels; cf. 20 channels in Richards, 2000a, and 40 channels in Richards, 2001) was recorded during the presentations and EEG segments were analyzed following cue onset, target onset, or around the saccade toward the target location. The ICA was done on the raw EEG segments, and cortical source analysis was done on clusters of ICA components. The ICA activations for cue onset were analyzed for trials on which a cue was presented (valid, invalid, no-target control trials) or was not (neutral trial). The ICA activations for the target onset were analyzed for the valid, invalid, and neutral trials, subtracting from each the activation pattern when no target occurred (no-target control trial; Richards, 2000a). The ICA activations for the presaccade data were analyzed for ‘cued-exogenous’ saccades (to target on valid trials), ‘uncued-exogenous’ saccades (to target on invalid or neutral trials), and ‘endogenous’ saccades (before target was presented, saccades to cued side on invalid trials or no-target control trials) (see rationale for saccade types in Richards, 2001). The 14-and 20-week-old infants were used because the P1 validity effect and the presaccadic ERP component were found in 20-week-olds but not in 14-week-old infants (Richards, 2000a).
Method
Participants
The participants were infants recruited from birth notices published in a Columbia, South Carolina newspaper. The infants were full term, defined as having birth weight greater than 2500 grams and gestational age of 38 weeks or greater based on the mother’s report of her last menstrual cycle. A cross-sectional design was used to sample 22 infants at 14 weeks (N = 11, M = 97.7 days, SD = 2.54, 7 male, 4 female) or 20 weeks (N = 11, M = 140.9 days, SD = 3.52, 6 male, 5 female). Five additional infants were tested who became fussy or sleepy during the testing session (3 at 14 weeks, 2 at 20 weeks) and six infants were tested for whom not enough data were collected or equipment problems occurred.
Apparatus
Each infant was held on a parent’s lap approximately 55 cm from a 29″ color video computer monitor (NEC Multisync XM29) displaying at 1280 horizontal and 1024 vertical pixels, and the parent could see the monitor. A neutral color material covered the surrounding area. A video camera was above the TV and in an adjacent room an observer judged the participant’s fixations on a TV monitor for controlling the experimental presentations. The video signal was digitized and stored in computer AVI files for later fixation judgments, and the frame numbers of the video recording at the experimental events were recorded.
A blinking dot was used to attract fixation to the central position on the computer monitor. Stimuli were presented in a 10° square area in the focal visual field that were known to elicit attention in infants, including dynamic, black and white computer-generated geometric patterns, or a recording of a ‘Sesame Street’ movie. The peripheral stimulus (cue and target) was a 2° × 6° rectangle shape that changed dynamically, and was presented at 18° from the center of the monitor. A ‘Sesame Street’ movie was presented on the full screen every four trials to take a break from the experimental trials.
Procedure
The parent sat in a chair in the viewing area with the infant on the parent’s lap facing the television monitor. Testing was done only if the subjects maintained an alert, awake state during the procedure (eyes open, no fussing or crying, responding to the protocol). If the infant became fussy a short break was taken and the presentations were paused and then restarted.
The study used a spatial cueing procedure (Hood, 1995; Hood & Atkinson, 1991; also see Richards, 2000, 2001, and Figure 6 in Richards, 2003a). The experimental trials consisted of the focal stimulus presentation, and cue and target presentations. A small blinking square was presented to attract fixation to the center of the computer monitor and then a focal stimulus was presented for 2 seconds. After 2 seconds, the peripheral stimulus was presented for 300 ms (‘cue’) while the focal stimulus remained on, and then the stimuli were turned off. At a delay of 150 ms (450-ms stimulus-onset-asynchrony) the rectangle was presented (‘target’) and remained on until the infant looked away from the center location (toward or away from the target). If the infant looked toward the peripheral stimulus it remained on for an additional 1s, followed by a 2.5-s intertrial interval.
Figure 6.
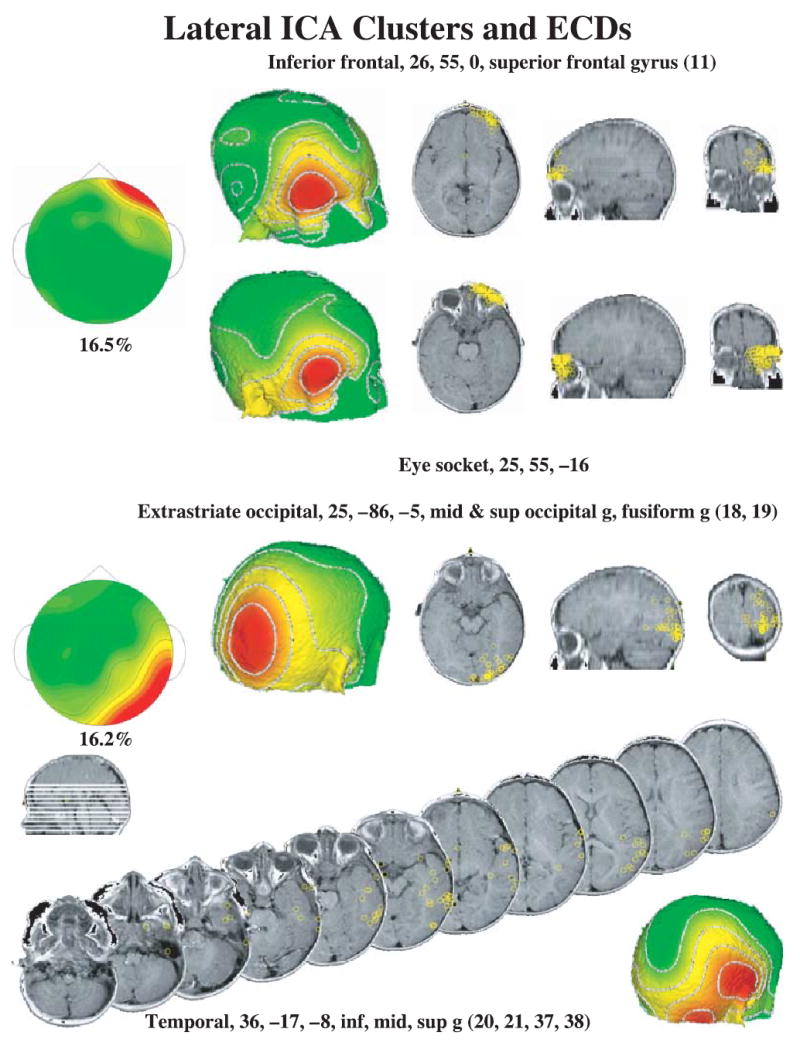
The lateral ICA component clusters and ECD locations. The lateral frontal clusters (right and left combined in figure) had high loadings for electrodes around the eye and the far anterior electrodes, and ECDs were distributed either in the inferior frontal cortex (superior frontal gyrus, top right panels) or in the eye socket (second row right panels). The lateral occipital clusters (right and left combined in figure) had high loadings for occipital and temporal electrodes. The ECDs were separated into locations in the occipital cortex (third row panels) and temporal cortex (bottom series of MRIs).
There were four trial types defined by the cue and target presentations. Valid: the cue and the target were presented in the same location. Invalid: the cue and the target were on opposite sides. Neutral: no cue presentation but a target was presented. No-target control: the cue was presented without a target presentation. These four trial types were presented randomly, without replacement, in 4-trial blocks. The session was continued as long as the infants were not fussy in order to obtain as many trials as possible.
Peripheral stimulus localization judgments
Each session was judged offline by a single observer. The frame in the AVI file corresponding to the experimental events was used to judge if the infant was looking toward the focal stimulus when it was presented, looking at the focal stimulus during the presentation of the cue, and looked toward the target when it was presented. Trials were used only if the infant was looking at the focal stimulus during its presentation (onset through cue offset) and looked toward the target or cue location during the target onset time. Localizations were defined as the observer judging that a look toward the cue or target side occurred, and the electrooculogram (EOG) showed a saccade of the appropriate magnitude and in the same direction as the visual judgment. Localization latency was defined as the difference between the onset of the target and the onset of the saccade.
Recording of EEG and segmenting of EEG
The electroencephalogram (EEG) was recorded with the EGI (Electrical Geodesics Incorporated, Eugene, OR) 128-channel EEG recording system (Johnson et al., 2001; Tucker, 1993; Tucker, Liotti, Potts, Russell & Posner, 1994). Figure 1 shows a schematic diagram of the sensor net used in the experiment, along with the locations of the electrodes in the 10–20 system and electrodes for EOG and blinks. Sensor nets of different sizes were used, using one that most closely corresponded to the infant’s head circumference. The two EEG sensors below the infant’s eye were not used, resulting in 126-channel recordings. The EEG signal was referenced to the vertex, recorded with 20K amplification, at a sampling rate 250 Hz (4-ms samples) with band-pass filters set at 0.1 to 100 Hz, and with 100 Ω impedance.1 The vertex-referenced EEG was algebraically recomputed to an average reference. The placement of the net took about 5–10 min, during which a second experimenter entertained the infants with toys, a child ‘busy box’, clown faces, etc. Since the EGI system uses an electrolyte- and sponge-based application, the scalp was not abraded, making this a non-critical recording situation for human subject concerns (Pivik, Broughton, Coppola, Davidson, Fox & Nuwer, 1993; Putnam, Johnson & Roth, 1992).
Figure 1.
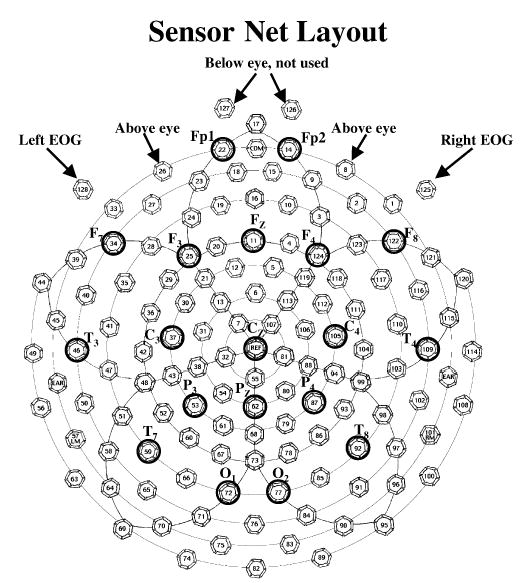
The recording layout of the EGI sensor net. The locations of the 10–20 recording montage are marked on the map. The two electrodes on the outside of the eyes (125, 128) were used for EOG. These two electrodes, and the two electrodes above the eye (8, 26), were used to detect blinks.
The EEG recordings were inspected for artifacts, poor recordings, or blinks, and individual channels or locations within trials were eliminated from the analyses if these occurred. Blinks were defined based on a difference between the two electrodes on the outside canthii of the eye (125, 128; Figure 1) and the two electrodes above the eye (8, 26; Figure 1), and were defined if EOG changes > 150 μV in the vertical direction. Blinks and large EEG changes (> 100 μV) were detected and eliminated by computer algorithms.
The segmenting of the EEG was done with respect to cue onset, target onset, and saccade onset, from the 4-ms interval (250 Hz) EEG recordings after artifacts were removed. The cue onset segments were from 50 ms before the cue and throughout the cue (350 ms total). Cue onset segments were not used if a blink or saccade occurred. The target onset segments were from 50 ms before the target through 1s following target onset, but only until a saccade occurred. Thus target onset segments differed in length depending on the presence and latency of a saccade. Target onset segments were not used if a blink occurred. The presaccadic EEG segments were from 700 ms prior to saccade onset through 100 ms following saccade onset. For these segments, the electrooculogram (EOG) was defined as the difference between electrical potential at two electrodes near the outer canthii of eyes (125, 128; see Figure 1). Saccades were identified in the EOG recording with an algorithm based on a third-order differentiation of the raw EOG signal (Matsuoka & Harato, 1983; Matsuoka & Ueda, 1986; Richards, 2000a, 2001; Richards & Hunter, 1997) and each identified saccade was visually inspected. For the cue onset and target onset analyses, EEG segments were included only if there was no saccade preceding the onset of the cue or target (still looking in the center location). For the presaccadic EEG segments, EEG segments were included only if the first saccade occurred toward the target (exogenous) or toward the cue side when the target was not present (endogenous).
Quantitative analyses of EEG and ERP
The analysis procedure will be briefly described, followed by more detailed sections for the ICA, clustering, and source analysis. Two general procedures were done. First, ERP averages were done to create ERP plots and topographical maps. These averages were made from the appropriate EEG segments. The averages were made for target onset and presaccadic ERP. Averages were made across experimental conditions and scalp locations in order to demonstrate effects found previously with 20-and 40-channel ERPs (Richards, 2000a, 2001). The ERP averages were made for demonstration purposes and were not analyzed with statistical procedures.
Second, the ICA and source analyses were done. These were done for EEG segments from cue onset, target onset, and saccade EEG segments. The following steps were done. (1) ICA analyses were done separately for each participant, using all the data from that participant in the ICA analysis, and using the 50 components with the largest projection variances of the 126 possible components. The 50 components with the largest projection variances were used assuming that a substantial proportion of the variance in the EEG signal would be accounted for by these components. (2) The ICA components were clustered according to the component loadings. These clusters resulted in about 50% of the components in distinct clusters, and about 50% of the components could not be organized in a specific cluster. (3) Single-dipole ECD models were done on all ICA components. Those components that were clustered together were done by seeding the ECD analysis with a location coming from an ECD of the average components for that cluster. The ECD analysis was accepted only if the resulting dipole was in a location near the average cluster ECD. Single-dipole ECD models also were done on the unclustered components by using a seed from each of the clusters, and the best-fitting ECD model was chosen for that component. (4) After the ECD analysis, the components that had good-fitting ECD models were reviewed by plotting the component topographical maps and confirming visually that the component was similar to the average component map. Thus, the final component clusters were topographically similar (step 2, 4) and had similar ECD dipole locations (step 3). (5) The ICA activations of the component clusters were examined in relation to experimental events, i.e. the experiment conditions and temporal relation to experimental events.
Independent component analysis
An independent component analysis (ICA) was done following the procedures outlined by Makeig, Sejnowski, and their associates (DeLorme et al., 2002; Jung et al., 2001a; Makeig, Bell, Jung & Sejnowski, 1996; Makeig, Jung, Bell, Ghahremani & Sejnowski, 1997; also see Richards, 2004a). The analysis was done on the ‘raw EEG’ data, i.e. no ERP averages were studied. All EEG segments from a single participant were concatenated. One advantage of this approach is that the activations may be viewed on single trials for single participants, and related to participant characteristics (i.e. age) or experimental conditions (i.e. valid or invalid trials, targeted or reflexive saccades). The variables for the analysis were the 126 electrode sites, leading to the estimation of 126 components (DeLorme et al., 2002; Jung et al., 2001a). The weights were calculated using the extended-ICA algorithm of Lee, Girolami and Sejnowski (1999), using sphering of the input matrix to aid in convergence, with an initial learning rate of .003. The extended-ICA algorithm was originally programmed in Matlab by Scott Makeig and others, and I used the publicly available program done in C++ from the Matlab versions by Sigurd Enghoff (March, 2000; see http://www.cnl.salk.edu/~enghoff/). The variance of the projection from each component was calculated, and the 50 components with the largest projection variance were used for the analyses.
The ICA analysis results in component weights and activations for each component. The inverse of the component weights represents the scoring matrix against which the activations would be multiplied to restore the raw data. These weights represent the topographically coordinated activity in the EEG data. Topographical plots represent the spatial organization of the components (Makeig et al., 1996, 1997), and these weights may be analyzed with cortical source analysis. The component activation has the temporal information in the component. Thus, the temporal morphology of the components was analyzed by examining the component activation for each component along each point in the temporal sequence of the EEG segments. These were analyzed with factorial designs in relation to the experimental factors (age, validity). The ICA quantification used raw EEG segments from trials containing left and right stimuli, or left and right saccades. The activations for lateralized clusters were analyzed by combining clusters from different sides by identifying the cluster as ipsilateral or contralateral to the cue or target side or eye movement, and averaging/plotting ipsilateral and contralateral component activity. The activations were multiplied by the standard deviation of the component loadings to standardize variance of the activations similar to that of the projections.
Component clustering
A clustering procedure was done to identify similar ICA components across participants. The ICAs were done separately for each participant. The 50 components from each participant with the largest projection variance were used in the analysis. The clustering of the components followed the procedure used by Richards (2003b; cf. Reynolds & Richards, in press). The components were normed to +/−1.0 during the clustering procedure to equate clusters with different magnitude loading weights. The components from two participants from each age were chosen to ‘seed’ the clusters. The ICA components were clustered according to a minimum distance criterion. The component weights of an ICA component were inverted if the inverse weights best fit the cluster, and the overall appearance of the clusters was of positive loadings. The components from the rest of the participants were then assigned to the clusters initially based on the minimum distance between the cluster centroid and the ICA. These clusters were visually reviewed and were modified to reassign components to clusters and to remove obvious outliers. The unnormed loading weights were then used for the rest of the analyses. The sign of the original component loadings was retained so that activations would be properly oriented for components that were inverted during the clustering.
Cortical source analysis
The ICA components were analyzed with cortical source analysis (‘brain electrical source analysis’, ‘equivalent current dipole analysis’; Scherg, 1990, 1992; Scherg & Picton, 1991; Huizenga & Molenaar, 1994). The ICA component loadings were analyzed with ECD models to determine the fit between the weights describing the component and scalp current generated by hypothetical dipoles (DeLorme et al., 2002; Jung et al., 2001a). Cortical source analysis hypothesizes a (set of) dipole(s) that generates an electrical current on the scalp. This forward solution may be compared with the component weights, and the dipole location and magnitude is modified to minimize the difference between the generated current map and the component weights. The components that had been assigned to clusters were analyzed with single-dipole models. These analyses were seeded with a location coming from an ECD analysis of the average component from that cluster. The ECD analysis was accepted only if the resulting dipole was in a location near the average component for that cluster. The components that had not been assigned to clusters were analyzed with single-dipole models with a dipole seed from each of the clusters. The ECD analysis of these components was accepted for the best-fitting ECD model and only if the location of the ECD was within 2 standard deviations of the average distance of the clustered ECD models. The EMSE computer program (Source Signal Imaging, San Diego, CA) was used for the ECD analysis.
Several aspects of the cortical source analysis relied on calculating the head shapes of individual participants (Richards, 2003b). A structural MRI recording was made for a 6-month-old participant and skull/scalp landmarks were measured. An electrode placement map was generated for this individual based on these head measurements and the known locations of the EGI electrodes. The same external head measurements were made for each participant in the present study and electrode placement maps were generated for the participant by transforming the placement map from the individual with the MRI recording according to the head measurements of the infant participant. The individualized placement map was used for the individual participant’s ECD analysis. This constrained the locations of the dipoles to a realistic topography based on individual participant data. The coordinates of the ECDs for each participant were translated into the coordinate space of the MRI recording for the 6-month-old, and MRI plots were based on these coordinates. The locations also were translated into saggital, coronal, and axial coordinates in the Talairach (Talairach & Tournoux, 1988) coordinate system. The MR Viewer (Signal Source Imaging, Inc.) was used for the MRI displays.
Topographical plots
Topographical plots were made of the ERP averages and the ICA component loadings. The ERP scalp potential maps show the distribution of the scalp potentials at a specific point in time and are useful in visualizing the ERP data shown in figures. The ICA components weights display the spatial organization of the ICA components (Makeig et al., 1996, 1997). The topographical maps consisted of a spherical spline interpolation (Perrin, Pernier, Bertrand & Echallier, 1989) shown in a radial projection (Perrin, Bertrand & Pernier, 1987). The EMSE computer program was used for the topographical plots.
Results
Localization probability and latency
The latency to localize the peripheral stimulus was calculated as the difference between the onset of the target and beginning of the saccade toward the target. This was analyzed with an age (two: 14, 20 weeks) × target type (three: valid, invalid, neutral) ANOVA.2 There were no statistically significant effects for the omnibus tests. However, based on prior results (Richards, 2000a, 2001), the latency from the valid trial type was compared to the latency from the other trials (invalid, neutral). This a priori comparison was statistically significant, F(1, 33) = 4.94, p = .0331. The localization latency from the invalid and neutral trials was not significantly different, F(1, 33) < 1.0. Figure 2 shows the localization latencies. There was a facilitation of reaction time on the valid trials compared with either the invalid or neutral trials. Reaction time on the invalid and neutral trials was not significantly different. These effects were similar in 14-and 20-week-old infants.
Figure 2.
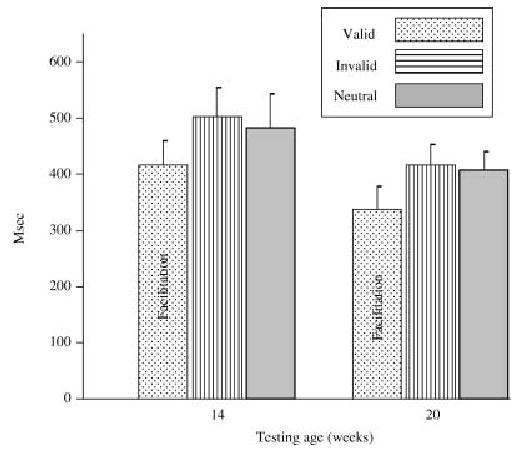
Latency to localize the peripheral stimulus when it was presented as a target. These figures are presented separately for the two testing ages and the three conditions in which a target was localized. The error bars are the SE of the mean.
The saccades toward the target (exogenous) and toward the cue side when the target was not present (endogenous) were counted. The exogenous saccades were defined as those that occurred to the target following a cue in that location (valid trials, cued-exogenous) and those that occurred following no cue in that location (invalid and neutral trials, uncued-exogenous). The infants looked toward the target on 90% (N = 659) of the trials and looked toward the other side on only 9% (N = 65) of the trials. The endogenous saccades were defined as those saccades that occurred when no target was present. This may have occurred on trials for which the infant was cued toward the peripheral location and made an eye movement to that location before the target was presented (valid, invalid) or when the infant looked toward the cued location when no target was presented (no-target control). The endogenous saccades that occurred following a cue were predominantly to the side of the cued location (N = 178, 65%) rather than to the side opposite the cue (N = 96, 35%).
Grand average ERP
The EEG segments from the target onset and saccade onset were averaged as ERP. These ERP averages were done to replicate effects found previously with 20- and 40-channel ERPs (Richards, 2000a, 2001) and were not analyzed with statistical procedures. Figure 3 shows the ERP responses from the occipital area (electrodes 66, 71, 72, 73, 76, 77, 84, 85; Figure 1) to target onset, separately for the valid, invalid, and neutral trials. Starting at about 100 ms, the responses to the target on the valid trials were larger in the electrodes contralateral to the target than the responses on the invalid or neutral trials. This difference was maximal at about 150 ms across several electrode locations on the contralateral occipital side, and also occurred at later time periods (e.g. 340 ms). A negative component did not occur in these data. Figure 3 (bottom panel) also shows a topographical map of the difference between the valid and the invalid/neutral trials. This shows a positive difference over a large area of the contralateral occipital scalp.
Figure 3.
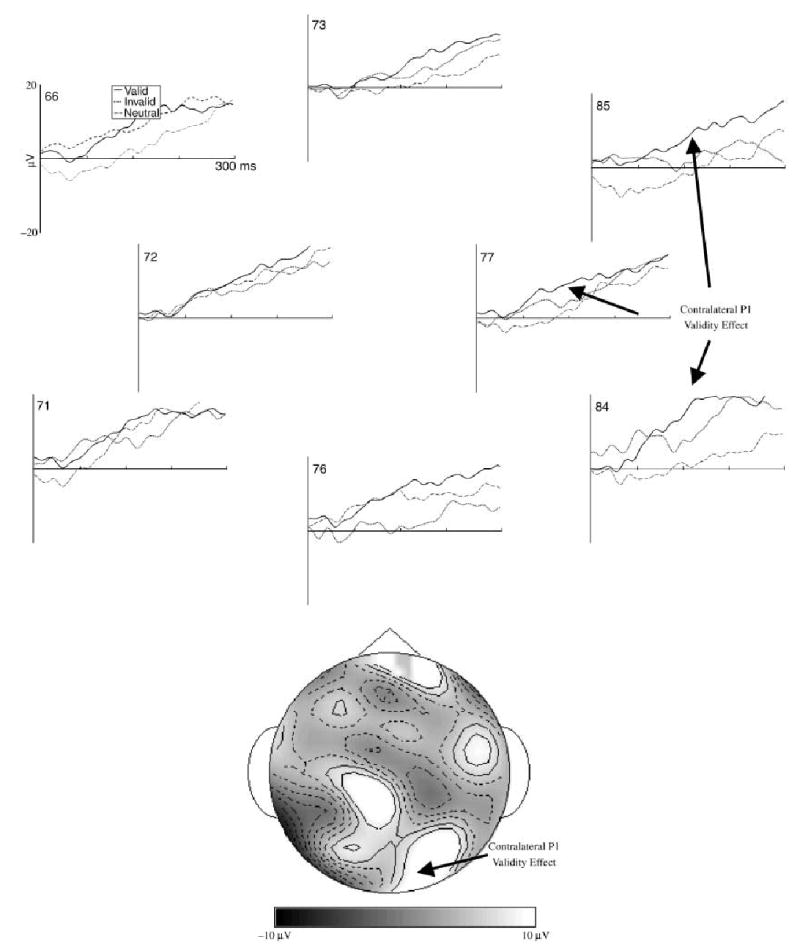
The ERP responses to the target for selected occipital electrodes. The data are presented as differences from the ERP on trials in which a peripheral stimulus was not presented as a target. The data for the electrode locations are reversed for the trials on which the target was presented on the right side, so the electrodes on the left are ipsilateral to the target and those on the right are contralateral to the target. The topographical map is the difference between the ERP on the valid trials, and that on the invalid and neutral trials, at about 150 ms following target onset. The median number of trials going into the grand averages were 64, 64, and 69 for the valid, invalid, and neutral trials, respectively.
The presaccadic EEG segments were averaged for ERP. Figure 4 shows the ERP responses for left-directed eye movements for the three saccade types: cued-exogenous (from valid trials), uncued-exogenous (from invalid and neutral trials), and endogenous (from no-target trials). The left side of this figure, ipsilateral to the direction of the eye movement, showed a large positive change during the saccade onset, and the right side, contralateral to the eye movement, showed a large negative change. This change is similar to that used to identify saccades in EOG recordings (electrodes 125 and 128 are used for EOG). A topographical map of the saccade onset at the peak of EOG change shows the bilateral potential shift over the ipsilateral (positive) and contralateral (negative) eyes (Figure 4, lower right panel). A presaccadic ERP effect was quantified by subtracting from the cued-exogenous eye movements the other eye movement types (Richards, 2000a, 2001). A topographical map of this effect (Figure 4, lower left panels) shows a small positive component in the EEG that occurred from about 100 to 60 ms prior to saccade onset. This occurred in the frontal electrodes contralateral to the eye movement (Figure 4, lower left panels) and was superior to the location of the EEG potential change occurring in the eyes at saccade onset (Figure 4, lower right panels). This presaccadic component was largest in the cued-exogenous eye movements and was small or absent in the other types of eye movements or the ipsilateral locations. There also was a presaccadic positive component that occurred about 100 to 300 ms prior to saccade onset, primarily on the cued-exogenous and endogenous eye movements, and that occurred in central and posterior electrode locations (not shown).
Figure 4.
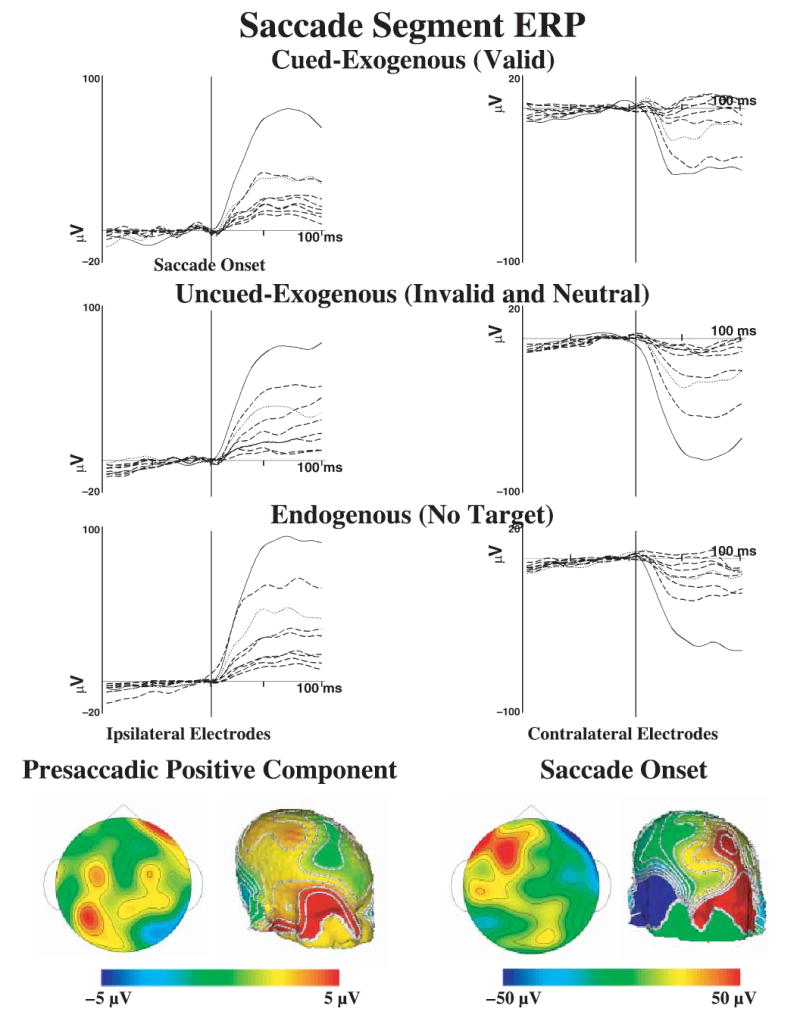
The ERP responses from the saccade segments, separately for cued-exogenous, uncued-exogenous, and endogenous saccades, for selected electrodes. The data are plotted around the onset of the saccade. The electrodes in the panels on the left come from the side ipsilateral to the eye movements (electrodes 23, 24, 25, 26, 27, 28, 33, 34, 126; see Figure 1) and the electrodes on the right are electrodes contralateral to the eye movement (electrodes 1, 2, 3, 8, 9, 122, 123, 124, 125). The solid line in each figure comes from the electrode designated as EOG (125, 126) and the dotted line comes from the electrode designated for blinks (8, 26). The bottom panels show the topographical maps for the presaccadic positive component (left two panels; difference between cued-exogenous and other trials) and the saccade onset (right panels). Note the difference in scale between these panels, and the bilateral activity on the saccade onset. The median number of trials going into the grand averages were 74, 86, and 117 for the cued-exogenous, uncued-exogenous, and endogenous saccades, respectively.
ICA and cortical source analysis
The EEG segments were analyzed with the ICA. Three of the clusters were over center electrodes, frontal, inferior occipital, and superior occipital and parietal (Figure 5, left panels). There were four ICA clusters that were over lateral electrodes, including right and left frontal and right and left occipital (Figure 6, left panels; lateral sides displayed combined). The initial clustering resulted in 612 of the 1100 possible ICA components being classified into the seven groups. The final clustering step resulted in 487 of the 1100 ICA components being included in the analyses. The components representing these clusters account for 45.5% of the variance in the ICA projections. The rest of the components did not cluster together well, had idiosyncratic ECD dipoles, or idiosyncratic topographical patterns in the loading weights.
Figure 5.
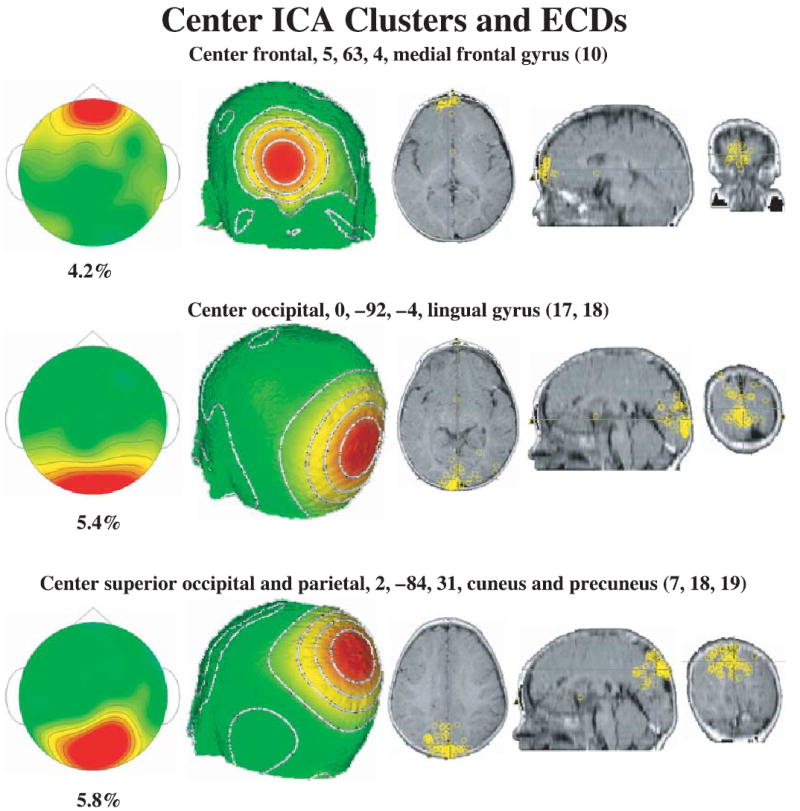
The center ICA component clusters and ECD locations. The center frontal cluster has high loadings for the frontal scalp locations, the center occipital cluster has high loadings for occipital electrodes, and the occipital-parietal cluster has high loadings for occipital and parietal electrodes. The ECD locations are displayed on the MRI recording, and each location represents an ICA from one individual.
The ICAs were analyzed with ECD analysis to estimate cortical sources of the components. Table 1 contains information about the average coordinates of the ECD locations for the clusters.3 Figure 5 shows the center clusters and the ECDs on an MRI for each of the component clusters. The central occipital cluster had ECDs that went along the calcarine fissure throughout the lingual gyrus, located primarily in area 17 and some in area 18. The occipital-parietal cluster had ECDs located in the cuneus and precuneus lobes (occipital, BA 18, and posterior parietal, BA 7). The ECD analysis resulted in the further separation of the lateral ICA clusters. Figure 6 shows the ECDs for the lateral clusters. The lateral frontal clusters (Figure 6, top half) had ECD dipoles that were located in the eye sockets (presumably from saccade activity) and in the inferior portion of the prefrontal cortex (superior frontal gyrus, BA 11). Similarly, the lateral occipital clusters (Figure 6, bottom half) had dipoles that were located in the extrastriate occipital areas (BA 18, 19), and were scattered throughout the temporal lobes (BA 20, 21, 37, 28). Figure 6 (bottom panels) shows a series of MRI slices with the locations of the ECDs in the temporal lobes. Note also the large range (37.5 mm, Table 1) over which these dipoles were scattered in the temporal lobe.
Table 1.
Equivalent current dipole (ECD) locations for the ICA clusters
| From anterior clusters | ||||||
|---|---|---|---|---|---|---|
| N | Saggital1 | Coronal | Axial | Mag. SD2 | Brodmann Area | Cortical Area |
| 85 | 25 | 55 | −16 | 16.0 | – | Eye sockets |
| 62 | 26 | 55 | 0 | 13.0 | 11 | Superior frontal gyrus |
| 26 | 5 | 63 | 4 | 19.3 | 10 | Medial frontal gyrus |
| From posterior clusters | ||||||
|---|---|---|---|---|---|---|
| N | Saggital1 | Coronal | Axial | Mag. SD2 | Brodmann Area | Cortical Area |
| 144 | 36 | −17 | −8 | 37.5 | 20, 21, 37, 38 | Inferior, middle, superior temporal gyrus; fusiform gyrus |
| 53 | 30 | −79 | 1 | 23.1 | 18, 19 | Inferior, middle, superior occipital gyrus; fusiform gyrus |
| 63 | 5 | −81 | 34 | 19.5 | 7, 18 | Precuneus & cuneous, occipital & parietal lobes |
| 73 | 1 | −83 | −3 | 22.0 | 17, 18 | Lingual gyrus |
The saggital location of the ECDs on the left side were calculated as the absolute value of the saggital coordinate to combine the left and right sides. The scale of the coordinates is mm and the coordinates are given in Talairach coordinates (Talairach & Tournoux, 1988).
The magnitude of the SD, calculated as the length of a vector from the ECD location to the SD, indicates the approximate radius of a sphere for locations within 1 SD of the centroid.
Component activations
The activations from the ICA components were analyzed separately for the clusters, and for the cue onset, target onset, and saccade onset segments. The activations for the cue onset segments were separated into those trials on which a cue occurred (valid, invalid, no-target control) and those trials that did not have a cue (neutral). The data from each cluster shown in Table 1 were analyzed separately, with a cue present (2: cue, no cue) × age (2) × intervals (87 intervals, from −50 to +300 ms) repeated measures ANOVA.4 There were no effects or interactions involving age. There was a significant interaction of cue present and intervals for the contralateral occipital cluster, F(86, 3010, ε = .0847) = 2.20, p = .0320. Post-hoc tests showed that this interaction occurred in the interval from 150 to 300 ms following cue onset. Figure 7 shows the activations for the cue onset data (dotted and dashed lines), and the difference between the trials on which a cue occurred minus those on which one did not occur (solid line). The response to the cue presence in the contralateral occipital cluster was a positive difference activation starting at about 150 ms and continuing through the end of the interval. This occurred about the same time as the P1 activity seen in the ERP to the target onset (Figure 2). There also was a significant intervals effect for the contralateral temporal cluster, F(86, 3096, ε = .0942) = 1.91, p = .0559, but this did not differ for the cue present or absent (no interaction, Figure 7). Figure 7 also shows the activations for the saccade onset, separated into those trials on which the eye movement was ipsilateral or contralateral to the cluster. The ICA component cluster with ECDs located in the eye socket showed the large change in activation at saccade onset reflecting that shown in the saccade onset grand average ERP (Figure 4). The center frontal and inferior frontal clusters did not show significant activations at cue onset, though there was a slight negative activation of the center frontal cluster for left and right eye movements.
Figure 7.
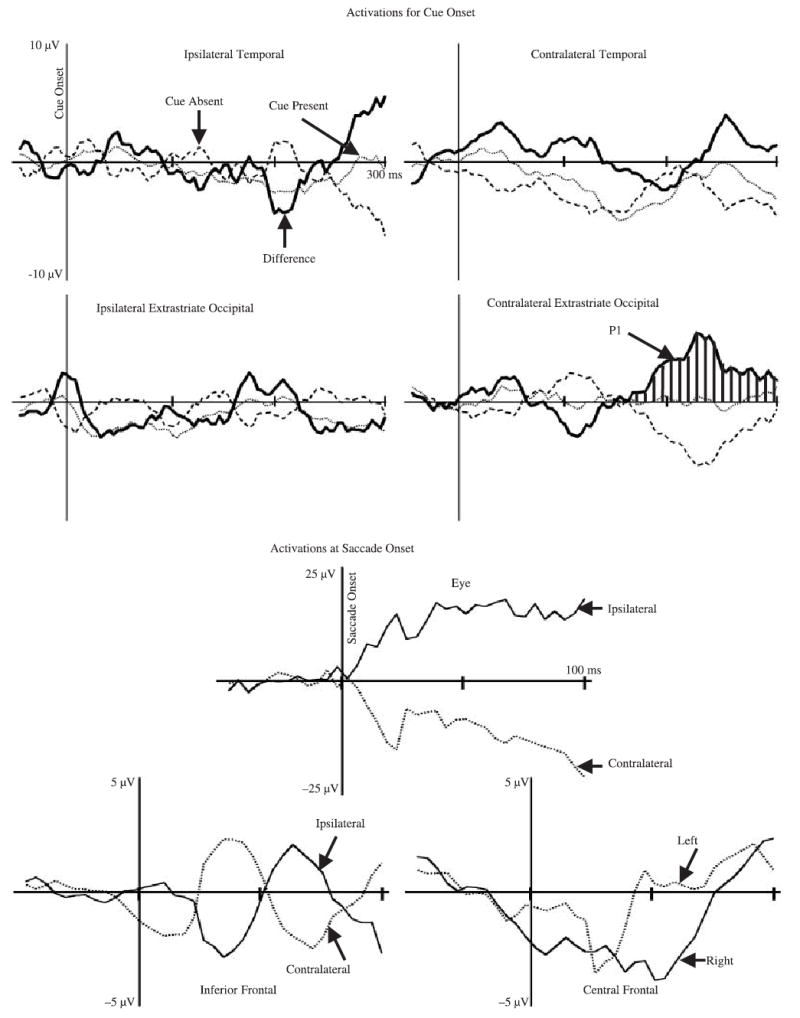
The activations of the clusters for the cue onset (cue occurred, no cue, difference) and saccade onset (contralateral, ipsilateral to eye movement). The data for the lateralized clusters were reversed for the cue on the right side, or an eye movement to the right side, so the clusters represent ipsilateral or contralateral activation of the ICA component clusters. The contralateral occipital cluster is marked with hatched lines where a significant difference between cue present and cue absent trials occurred. The median number of trial-cluster combinations for the activations were 457, 204, for the cue onset trials, and 385, 446 for the saccade onset trials.
The target onset activations were separated into valid, invalid, and neutral trials and the activation on the no-target control trial was subtracted from each condition. These activations were analyzed separately for the clusters shown in Table 1, with a trial type (three: valid, invalid, neutral) × age (two) × intervals (125 intervals, from −50 to +400 ms) repeated measures ANOVA. There was a significant interaction on the contralateral occipital cluster between age, trial type, and intervals, F(248, 1736, ε = .0342) = 2.38, p = .0342. The contralateral temporal cluster had significant effects of the trial type and intervals interaction, F(248, 2852, ε = .0318) = 3.42, p = .0018, and the age, trial type, and intervals interaction, F(248, 2852, ε = .0318) = 3.91, p = .0005. The interaction of trial type and intervals for activations of the occipital-parietal cluster was close to being statistically significant, F(248, 2480, ε = .0241) = 2.10, p = .0660. Figure 8 shows the activations for the target onset data. The activation of the components that were significant was larger on the valid than the other trials. At about 50 to 150 ms following stimulus onset, there was a large positive activation over the occipital scalp (P1 component, Figure 8) and a large negative activation over the temporal scalp (Early Negative Component, Figure 8). From about 150 to 200 ms post-target, there was a large negative activation over the central occipital-parietal leads at about 150 ms (N1?) accompanied by the sustained activation in the contralateral occipital area. The interaction of age with these factors was due to these effects occurring primarily in the 20-week-olds. The bar graph in Figure 8 shows that the P1 validity effect in the occipital cluster occurred primarily in the 20-week-old infants.
Figure 8.
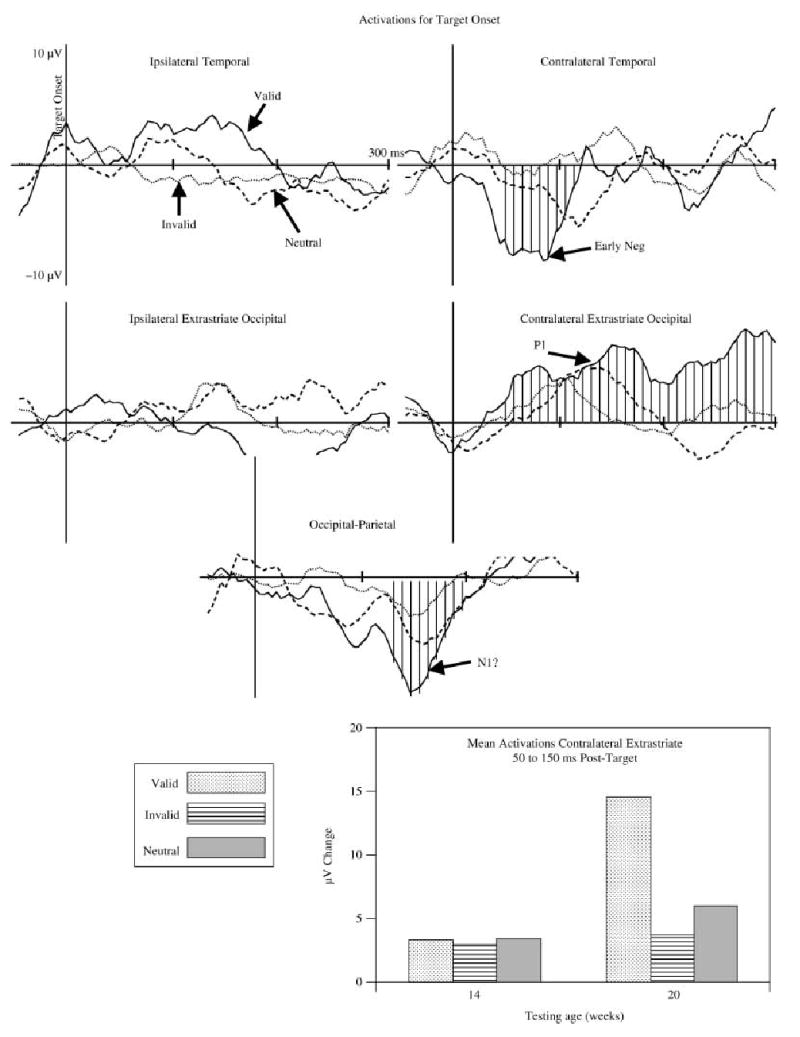
The activations for target onset, separately for valid (solid line), invalid (dotted line), and neutral (dashed line) trials. The contralateral occipital, contralateral temporal, and occipital-parietal clusters are marked with hatched lines where a significant difference for the age × trial type × intervals effects occurred. The bottom graph illustrates the significant interaction of age and trial type for the contralateral cluster. The median number of trial-cluster combinations for the averages were 81, 72, and 73 for the valid, invalid, and neutral trials, respectively.
The presaccadic segment activations were separated into cued-exogenous (valid targets), uncued-exogenous (invalid, neutral targets), and endogenous (movement toward cued location with no target present). These activations were analyzed separately for the clusters shown in Table 1, with an eye movement type (three: cued-exogenous, uncued-exogenous, endogenous) × age (two) × intervals (75 intervals, from −300 to saccade onset) repeated measures ANOVA. There were some significant effects of intervals, saccade type, and age for several of the clusters. The only cluster showing interactions between intervals and saccade type was the contralateral inferior frontal ECD cluster. The activations from this cluster had significant effects of intervals, F(74, 874, ε = .0947) = 2.77, p = .0121, intervals × age, F(74, 874, ε = .0947) = 3.33, p = .0145, and intervals × saccade type × age, F(148, 740, ε = .0947) = 2.22, p = .0145. Figure 9 shows the activations for the presaccadic segment data. One pattern of activations similar to the grand average ERP (Figure 4) was a presaccadic positive potential that occurred for the cued-exogenous eye movements in the inferior frontal ECD cluster contralateral to the eye movement (Figure 9, second upper right panel). The average peak of this activation across ICA components occurred at about 65 ms prior to saccade onset. The bar graph at the bottom of Figure 9 illustrates the eye movement type by age interaction found in the contralateral inferior frontal cluster. The 20-week-olds showed a larger activation of this component cluster on the cued-exogenous eye movements than on the other types of eye movements. The 14-week-old infants showed a similar effect (larger activation on cued-exogenous eye movement) but the difference was smaller than in the 20-week-old infants.
Figure 9.
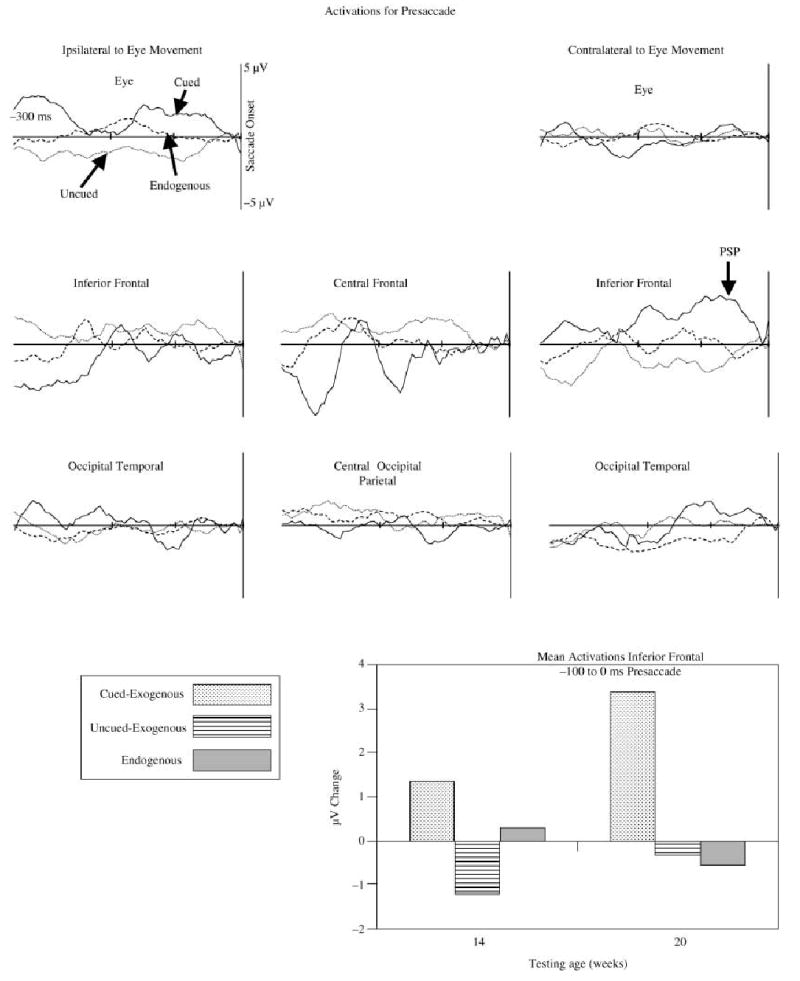
The activations for presaccadic EEG segments, separately for cued-exogenous (solid line), uncued-exogenous (dotted line), and endogenous (dashed line) eye movements. The bar graph shows the mean of the presaccadic activation in the inferior frontal ECD clusters from 100 ms before saccade onset through saccade onset, separately for the two ages and three eye movement types. The median number of trial-cluster combinations for the averages were 122, 158, and 185 for the cued-exogenous, uncued-exogenous, and endogenous eye movements, respectively.
Discussion
The goal of this study was to use cortical source analysis of EEG to infer the cortical sources underlying covert orienting in young infants. Using a spatial cueing procedure and a short stimulus-onset-asynchrony target, the latency of the saccade to localize the target was facilitated on the valid trials compared to the invalid and neutral trials. Prior studies have found two ERP components in the spatial cueing task, a P1 validity effect over occipital scalp areas for target onset ERP (Richards, 2000a) and a positive potential over frontal areas for the ERP preceding the onset of the saccade to the target (Richards, 2000a, 2001). The current study found an ICA cluster located over the occipital electrodes that had ECDs located in Brodmann’s areas (BA) 18 and 19 (extrastriate occipital cortex). The activation of this component was larger in response to the validly cued target than to invalid or neutral targets. An ICA cluster was identified over the eye and frontal electrodes, that had ECDs located either in the eye socket or the inferior prefrontal cortex (BA 11, superior frontal gyrus). The activation of the latter component at about 65 ms preceding the saccade onset was larger for a saccade to a cued location, than to saccades to a target in an uncued location, or to a cued location not having a target. The activation representing the P1 validity effect and that representing the presaccadic positive ERP component were larger in the 20- than in the 14-week-old infants.
The spatial cueing procedure resulted in facilitation of the localization of the target when it appeared in the same location as the cue (valid trials) than when it appeared in an uncued location. There was no overt movement of the eyes during the presentation of the cue. Thus such facilitation indicates that a covert shift of attention (or covert orienting) to the cued location occurred. The facilitation of this reaction time is attributed to an enhancement of activity in the brain area involved in the early stages of information processing, and an increased efficiency of processing stimuli that involve these brain areas (Eimer, 1996, 1997; Hillyard et al., 1995; Posner, 1980).
Target onset ICA activation
The EEG activity occurring at target onset was affected by the cueing conditions. There was a larger activation of several ICA clusters occurring on the trials when the cue and target were in the same hemifield (valid trials) than when the cue and target were in different locations (invalid trials) or when a cue did not precede the target (neutral trials). The activation for the ICA cluster over the contralateral occipital electrodes was most interesting in this regard. This validity effect peaked at about 150 ms following the target onset. The timing and location of this effect was similar to the grand average ERP in the current study (cf. Figures 3 and 8) and was similar to an ERP validity effect found in prior studies with infant participants (Richards, 2000a, 2001). I believe that this activation represents a ‘P1 validity effect’. The timing of the component was similar to the response occurring in response to the cue onset and occurred at some level on all three types of trial in which a target occurs. This P1 validity effect was similar to that reported for adult participants in spatial cueing studies (Eimer, 1996, 1997; Harter et al., 1989; Hillyard et al., 1994; Hopfinger & Mangun, 1998; Mangun & Hillyard, 1991).
In addition to the similarity in the time course of the activation and the scalp locations of the ICA component cluster of the P1 validity effect, the presumed cortical source of the P1 validity effect was similar to that reported in adult participants. The ICA occipital cluster had ECDs that occurred in the extrastriate occipital cortex (BA 18, 19; Table 1, Figure 6) and in the temporal cortex (BA 20, 21, 37, 38). The generators of the P1 component and the validity effects in adults come from similar areas. For example, using high-density scalp recording, identification of brain structures with MRI, and dipole source modeling, Hillyard, Mangun and others (see Hillyard et al., 1995) have shown that the cortical sources of the P1 and N1 effects come from the lateral extrastriate visual areas of the occipital cortex rather than striate areas. Similarly, using a combination of anatomical MRI, functional MRI, and ERP recordings, the P1 validity effect in adults has been localized to the middle occipital cortex (Talairach coordinates, 33, −90, 10) and ventral fusiform area (Talairach coordinates, 37, −56, 11) (Martinez, Anllo-Vento, Sereno, Frank, Buxton, Dubowitz, Wong, Hinrichs, Heinze & Hillyard, 1999). These areas were very close to those found in the current study in the contralateral extrastriate ECDs (Talairach coordinates, 30, −79, 1 in Table 1). In the current study the areas included cortical areas that are thought to be involved in retinotopically organized visual activity (middle occipital) and areas involved in pattern and object identification (fusiform gyrus). These effects occurred at an intermediate level in the visual processing sequence rather than in very early thalamic or striate visual areas.
There were two findings that illuminate age changes in this task. First, as in prior studies with ERP (Richards, 2000a), the youngest age infants showed the increased activation of the contralateral extrastriate area in response to the cue onset and the target onset regardless of spatial cueing condition (Figure 7 and bottom bar graph in Figure 8). We may infer that the area of the brain underlying this ERP component is sufficiently mature in 14-week-old infants to show this early ERP component. The modulation of this activity by the spatial cueing procedure (P1 validity effect) occurred only in the 20-week-old participants (Figure 8, especially bottom bar graph). This suggests that the increase from 14 to 20 weeks in the amplitude of the P1 validity effect was due to an increase in activity in this brain region rather than a shift of brain location over the two testing ages. However, it is probably not the development of this area of the brain itself that reflects the increase in attentional modulation, but some other cortical areas with top-down control on this visual processing area.
Second, the existence of the validity effect in the reaction time for both ages (Figure 2) and the lack of a P1 validity effect in the ICA cluster for 14-week-old infants implies that the brain changes in this area are not responsible for the facilitation effects. This age-related dissociation between the behavioral and brain indices of facilitation suggests that the facilitation of reaction time found in this study may be due to automatic processing of the peripheral stimulus without higher cortical involvement. That is, although the extrastriate area is necessary for stimulus perception (P1 activity to cue or target) the facilitation on the target localization occurred elsewhere in the brain. It is possible that such facilitation might be supported by a combination of saccadic programming in the superior colliculus and reflexive saccades that were programmed before target onset but executed after target onset (Richards, 2000a). It was found in a prior study (Richards, 2000a) that inhibition of return occurred with longer stimulus-onset-asynchronies than used in the current study, and there was an increase over ages in the level of inhibition of return. The age changes in the P1 validity effect parallel the age changes in inhibition of return. This implies that covert orienting and attention development, and the age changes in the cortical areas hypothesized to have occurred in this study, are more closely associated with inhibition of return development than facilitation of reaction time. This interpretation would be aided by studies using different stimulus-onset-asynchronies.
Presaccadic ICA activation
The activation of the ICA components was found in the period of time immediately preceding and following saccade onset. There was an activation of the ICA clusters with ECDs in the eye sockets that reflects the electrical activity occurring at saccade onset (cf. Figure 4 and Figure 7). There also was activation of the ICA components preceding the saccade onset. This activation occurred only contralateral to the direction of the eye movement, occurred in the ICA clusters with ECDs in the inferior prefrontal cortex, and did not involve the ICA clusters with ECDs in the eye sockets (Figure 9). The activation in these ICA components only occurred for those trials in which the saccades were toward the target when it was validly cued, and was slightly larger for the 20- than for the 14-week-old infants (bar graphs in Figure 9). The activation of this ICA cluster was similar to the grand average ERP (Figure 7) and two prior studies that showed a presaccadic ERP component in infants of similar ages (Richards, 2000a, 2001). I believe this ERP component reflects activity in the prefrontal cortex representing targeted saccade planning (Richards, 2001). The existence of target-based enhancement of reaction time and the P1 effect implies that the infant made a covert shift of attention to the cue when it occurred. The saccades toward the target on the valid trials therefore may be considered as saccades planned by the infant to a targeted location. The saccade to a target in the other locations must be considered unplanned (e.g. neutral trials) and therefore might be reflexive and based on subcortical eye movement systems. This activity also did not occur for the endogenous saccades for which no target was present but the opportunity for making a planned eye movement occurred. This leads to the hypothesis that this presaccadic activity represents cortically targeted saccades (Richards, 2001). I conclude from the ECD analysis that the cortical source of this activity is the frontal pole of the prefrontal cortex (Brodmann areas 10 and 11, superior and medial frontal gyrus).
Unlike the similarity between the target onset activation found in the current study and adult studies of the P1 validity effect, this presaccadic activity has no parallel in adult work on eye movement. There is an extensive literature on presaccadic ERP changes that occur in adult participants. Such changes include a negative slow potential beginning about 1 s before saccade onset, a positive potential beginning at about 300 ms prior to saccade onset, and a presaccadic spike potential occurring about 10–20 ms preceding saccade onset (Balaban & Weinstein, 1985; Becker, Hoehne, Iwase & Kornhuber, 1973; Csibra et al., 1997; Kurtzberg & Vaughan, 1980, 1982; Richards, 2003b; Weinstein, Balaban & VerHoeve, 1991). These presaccadic ERP changes do not parallel the presaccadic activity found in young infants (this study, and Richards, 2000a, 2001) in either the time course or the scalp location of the activity. There is a functional similarity between the types of trials on which this presaccadic activity occurs in studies of infants and the changes in adults. Several of the adult presaccadic ERP changes are larger for saccades to specific targets in expected locations, predicated locations, or voluntary saccades. These presaccadic ERP changes are hypothesized to reflect cortical areas involved in saccade planning (Balaban & Weinstein, 1985; Csibra et al., 1997, 1998; Johnson et al., 1998; Kurtzberg & Vaughan, 1980, 1982).
I had speculated that the cortical source of the presaccadic ERP component was close to the frontal eye fields (or supplementary eye fields) of the prefrontal cortex (Richards, 2000a, 2001). These brain areas are known to guide saccades to specific targets in expected locations in adults, and are often cited as the basis for the presaccadic ERP potentials in adults occurring for saccades to expected peripheral stimuli, predicted locations, or voluntary saccades. One can actually use source analysis on the grand average ERP for the presaccadic ERP component and a dipole for this effect may be located in the prefrontal cortex near the supplementary eye fields (Richards, 2003a, 2004b). However, the ECDs for ICA component clusters for this effect are clearly located in the superior frontal gyrus on the inferior surface of the prefrontal cortex (Table 1, Figure 6), and not in the frontal eye fields or supplementary eye fields.
Validity of the cortical localization technique
The primary goal of this study was to infer the cortical sources underlying covert orienting in young infants. This was the first study to apply the use of ICA and source analysis to infant participants (cf. Johnson et al., 2001) and some comments on its use are in order. There were several advantages of this approach. First, the decomposition of the EEG data into components is a standard tool in psychophysiology. The component analysis of EEG assumes that there are discrete areas in the cortex that sum to form the observed electrical activity recorded with electrodes on the scalp (Johnson et al., 2001; Makeig et al., 1996, 1997; Richards, 2004a). The component analysis aims to decompose this variance via its co-occurrence in the spatial coordinates of the electrodes. The resulting components represent a topographically organized unit. Analysis of the activations of the components may be better than analyzing single electrode EEG or multiple electrode EEG. Most component analysis of EEG has been done with principal components analysis, but ICA is becoming a standard tool for such analysis (Johnson et al., 2001). Second, the identification of cortical sources by the analysis of components rather than raw EEG or ERP data also was helpful. This has been done with principal components analysis (Dien, 1999; Richards, 2003b) and ICA (DeLorme et al., 2002; Jung et al., 2000a, 2001b; Reynolds & Richards, in press; Richards, 2002). The ICA components represent topographically organized activity on the scalp that has similar activation in the EEG. This topographical organization is reasonably assumed to result from the cortical generators of the EEG activity. Thus, source analysis applied to the component loadings is a reasonable approach. Finally, using ICA as a preprocessing step before EEG or ERP analysis may result in more stable data. This comes from the elimination of sources of noise in the EEG by ICA components that were not considered in the analysis (Johnson et al., 2001), ICA components that may be readily modeled with single-dipole models (Richards, 2004a), and the signal-to-noise benefit accruing from the use of multiple electrodes for each component.
There are potential problems with such analysis as they are applied in the current paper. The first deficit is because this paper is the first to apply such work to infant participants. The model for the cortical source analysis is traditionally based on parameters for use with adult participants. For example, the models that derive the forward solution from the dipole to the scalp current density are based on impedance values for cortical matter, skull, and scalp. There are major differences in skull thickness and distribution for adults and young infants that should result in differing impedance values, and difference in impedance between skin (and scalp) for infants and adults. Adult values of impedance are higher than those in infants. This would have the effect of showing the source of the current on infant participants as being deeper in the cortex than where it actually occurred. A second deficit of the current approach is that the cortical sources were inferred from an MRI of a single infant and by identifying the cortical location of the ECDs by translating their location in the individual participant to the Talairach (Talairach & Tournoux, 1988) coordinate system (Table 1). The location of the ECDs in individual participants is a faithful representation of the location in that infant’s coordinate system. This is not compromised by the use of a single MRI for display (Figures 5, 6) or the use of an MRI of a different aged infant. Rather, the problem lies in that a precise relation between the Talairach and an infant’s coordinate space is undetermined at this time. Such analysis is constrained by the different shapes of infant and adult skulls, probable differences between adult and infants in the relation between external skull landmarks and underlying cortical areas, and the rapid development of cortical areas over the first 6 to 12 months. Even with these limitations, however, the coordinate system seemed useful for this paper (Table 1). One can see the cortical areas on the MRI (Figures 5, 6) that correspond to the Talairach coordinates and appropriate cortical locations (Table 1). The similarity between the ECD locations for the P1 validity effect in the current study (Table 1) and that found in adult participants (Martinez et al., 1999) also is encouraging in this regard.
A significant advance in the use of the cortical source analysis in infant participants will be made only by obtaining MRIs for individual participants who also are tested in the experimental procedures. The best source analysis technique uses anatomical data from individual participants (i.e. anatomical MRI) and perhaps combines the ERP with other measures of functional brain activity (PET, MRI; e.g. Martinez et al., 1999; also cf. Richards, 2003b with Richards, 2002). Obtaining anatomical MRIs for infant participants would be helpful and would be reasonable, if somewhat impractical (Patterson, Badridze, Flax, Liu & Benasich, 2004). This information could be used to constrain the ECD solutions with reasonable anatomical areas, estimate scalp, skull, CSF, and cortical thickness and topography for the numerical aspects of the ECD analysis, and identify the cortical areas of the ECD locations in the MRI of the participant rather than translating infant locations to Talairach locations. Such an enterprise would be helpful to the scientific community by developing a ‘Talairach coordinate system’ relevant to infant participants, perhaps over a range of ages. The possibility of relating anatomical MRI and ERP to other measures of functional brain activity (PET, fMRI) will be extremely difficult to apply to infant participants. Though some success has been made in this direction (e.g. fMRI; Dehaene-Lambertz, Dehaene & Hertz-Pannier, 2002; NIROS – Near Infrared Optical Spectroscopy; Peña, Maki, Kovacic, Dehaene-Lambertz, Koizumi, Bouquet & Mehler, 2003), the practical use of such techniques is limited with infants due to ethical concerns (PET), movement- and alertness issues (fMRI), and non-invasive techniques (e.g. NIROS) at the moment have limited depth capabilities and have inherent limitations on temporal resolution.
Conclusions
Several conclusions may be made from this study concerning the localization of cortical sources involved in covert orienting in young infants. The approach to this problem using the ICA component approach and ECD modeling advances confidence in the neurophysiological interpretations of infant covert attention development that have been limited before to overt reaction times or scalp locations of ERP (Richards & Hunter, 2002). The current study suggests that there is enhancement in young infants of the brain areas involved in the processing of visual information, such as the extrastriate occipital cortex or ventral fusiform gyrus. The inferior prefrontal cortex also is involved when making planned, targeted eye movements to a peripheral target. These brain areas show higher levels of activation in 20- than in 14-week-old infants, resulting in the differential ERP activity across these two ages and perhaps signifying that covert shifts of attention occur more strongly in 20-week-old infants than at younger ages (Richards, 2000a). The response facilitation found for the short stimulus-onset-asynchronies used in the current study show a different developmental course than does the brain activity in this task. It is likely that other aspects of covert orienting and attention (i.e. developmental changes in inhibition of return, Richards, 2000a) are more closely associated with the cortical changes found in the current study.
Acknowledgments
This research was supported by grants from the National Institute of Child Health and Human Development, #R01-HD18942 and a Major Research Instrumentation Award, # BCS-9977198, from the National Science Foundation. I wish to acknowledge Michael Stevens and William Campbell for their aid in testing participants, data editing, and analysis. I wish to acknowledge April Benasich and workers at the Infancy Studies Laboratory at Rutgers University for the infant MRI, which acquisition was supported by the Elizabeth H. Solomon Center for Neurodevelopmental Research.
Footnotes
The choice of 100 kΩ as the maximum impedance value was based on the high input impedance of the EGI amplifiers. These amplifiers have an input impedance of about 200 MΩ, compared with traditional EEG amplifier impedances of about 10 MΩ. Given the recommendation of interelectrode impedances being at least 1% of amplifier input impedance (e.g. 10 kΩ for 10 MΩ amplifier; Picton, Bentin, Berg, Donchin, Hillyard, Johnson, Miller, Ritter, Ruchkin, Rugg & Taylor, 2000), 100 kΩ is appropriate for this amplifier. Ferree, Luu, Russell and Tucker (2001) estimate that for this amplifier system a 50 kΩ preparation would lead to a maximum 0.025% signal loss, and therefore the current levels should lead to no more than a 0.050% signal loss. They found no discernible signal loss with electrode preparations at about 40 kΩ.
The ANOVAs for the analyses were done with a general linear models approach using non-orthogonal design (Hocking, 1985; Searle, 1971, 1987). The sums of squares (hypothesis and error) for the nested effects in the design were estimated using ‘subjects’ as a class and nesting repeated measures (e.g. trial type) within this class variable. The ‘PROC GLM’ of SAS was used for the computations. The saccade latency was analyzed with log-transformed values in order to achieve a variable with a normal distribution. Post-hoc or a priori analyses were done using the Scheffe procedure, using the error rate from the appropriate omnibus test.
The values of the ECDs in Table 1 come from doing ECD analysis on each component, transforming the resultant topographical coordinates into Talairach space, and then averaging the coordinates (averaged Talairach coordinates approach). An alternative approach of first averaging the loadings (i.e. Figure 5) and doing an ECD of the averaged loadings is incorrect (average loading approach). The averaging of loadings across individuals results in smearing of the scalp loadings due to topographic differences across individuals and possible differences in individual locations. The averaged loadings approach was done and the resultant ECD coordinates ranged from 3 to 22 mm in distance from the correct method (averaged Talairach coordinates). Due to the smearing of the loadings, all but two of the coordinates were deeper in the cortex for the averaged loading ECDs. Similarly, calculating the ECDs on the grand average ERPs (Figure 3, P1 validity effect; Figure 4, presaccadic positive component; Figure 4, saccade onset) resulted in ECDs that were 13 to 19 mm away from the ECDs obtained in the averaged Talairach coordinate approach, and which were deeper in the head for the grand average data than for the averaged Talairach coordinates values (Table 1).
The intervals were the 4-ms samples, and the intervals effect shows differences in the temporal pattern of activations. Post-hoc analyses were done using single intervals (or means of intervals) for the hypothesis MS and the error rate from the omnibus test. The ANOVAs involving the intervals effects were adjusted by the Huynh-Feldt εadjustment to the degrees of freedom to control for inflated error rates with psychophysiological measures (Huynh & Feldt, 1970; Jennings & Wood, 1976; Keselman & Keselman, 1988; Pivik et al., 1993).
References
- Balaban CD, Weinstein JM. The human presaccadic spike potential: influences of a visual target, saccade direction, electrode laterality and instructions to perform saccades. Brain Research. 1985;347:49–57. doi: 10.1016/0006-8993(85)90888-1. [DOI] [PubMed] [Google Scholar]
- Becker W, Hoehne O, Iwase K, Kornhuber HH. Cerebral and ocular muscle potentials preceding voluntary eye movements in man. Electroencephalography and Clinical Neurophysiology Supplement. 1973;33:99–104. [PubMed] [Google Scholar]
- Csibra G, Johnson MH, Tucker LA. Attention and oculomotor control: a high-density ERP study of the gap effect. Neuropsychologica. 1997;35:855–865. doi: 10.1016/s0028-3932(97)00016-x. [DOI] [PubMed] [Google Scholar]
- Csibra G, Tucker LA, Johnson MH. Neural correlates of saccade planning in infants: a high-density ERP study. International Journal of Psychophysiology. 1998;29:201–215. doi: 10.1016/s0167-8760(98)00016-6. [DOI] [PubMed] [Google Scholar]
- Csibra G, Tucker LA, Johnson MH. Anticipatory and reactive saccades in infants: a high-density ERP study. Infancy. 2001;2:159–174. [Google Scholar]
- Dehaene-Lambertz G, Dahaene S, Hertz-Pannier L. Functional neuroimaging of speech perception in infants. Science. 2002;298:2013–2015. doi: 10.1126/science.1077066. [DOI] [PubMed] [Google Scholar]
- DeLorme A, Makeig S, Fabre-Thorpe M, Sejnowski T. From single-trial EEG to brain area dynamics. Neurocomputing. 2002;44–46:1057–1064. [Google Scholar]
- Dien J. Differential lateralization of trait anxiety and trait fearfulness: evoked potential correlates. Personality and Individual Differences. 1999;26:333–356. [Google Scholar]
- Eimer M. ERP modulations indicate the selective processing of visual stimuli as a result of transient and sustained spatial attention. Psychophysiology. 1996;33:13–21. doi: 10.1111/j.1469-8986.1996.tb02104.x. [DOI] [PubMed] [Google Scholar]
- Eimer M. Attentional selection and attentional gradients: an alternative method for studying transient visual-spatial attention. Psychophysiology. 1997;34:365–376. doi: 10.1111/j.1469-8986.1997.tb02407.x. [DOI] [PubMed] [Google Scholar]
- Ferree TC, Luu P, Russell GS, Tucker DM. Scalp electrode impedance, infection risk, and EEG data quality. Journal of Clinical Neurophysiology. 2001;112–113:536–544. doi: 10.1016/s1388-2457(00)00533-2. [DOI] [PubMed] [Google Scholar]
- Harter MR, Miller SL, Price NJ, LaLonde ME, Keyes AL. Neural processes involved in directing attention. Journal of Cognitive Neuroscience. 1989;1:223–237. doi: 10.1162/jocn.1989.1.3.223. [DOI] [PubMed] [Google Scholar]
- Hillyard, S.A., Luck, S.J., & Mangun, G.R. (1994). The cueing of attention to visual field locations: analysis with ERP recordings. In H.J. Heinze, T.F. Munte & G.R. Mangun (Eds.), Cognitive electrophysiology (pp. 1–25). Boston, MA: Birkhauser.
- Hillyard, S.A., Mangun, G.R., Woldroff, M.G., & Luck, S.J. (1995). Neural systems mediating selective attention. In M.S. Gazzaniga (Ed.), Cognitive neurosciences (pp. 665–682). Cambridge, MA: MIT.
- Hocking, R.R. (1985). The analysis of linear models Monterey, CA: Brooks/Cole Publishers.
- Hood BM. Inhibition of return produced by covert shifts of visual attention in 6-month-old infants. Infant Behavior and Development. 1993;16:245–254. [Google Scholar]
- Hood BM. Shifts of visual attention in the human infant: a neuroscientific approach. Advances in Infancy Research. 1995;10:163–216. [Google Scholar]
- Hood, B.M., & Atkinson, J. (1991, April). Shifting covert attention in infants. Paper presented at the meeting of the Society for Research in Child Development, Seattle, WA.
- Hood, B.M., Atkinson, J., & Braddick, O.J. (1998). Selection-for-action and the development of orienting and visual attention. In J.E. Richards (Ed.), Cognitive neuroscience of attention: A developmental perspective (pp. 219–250). Hillsdale, NJ: Lawrence Erlbaum Press.
- Hopfinger JB, Mangun GR. Reflexive attention modulates processing of visual stimuli in human extrastriate cortex. Psychological Science. 1998;9:441–446. doi: 10.1111/1467-9280.00083. [DOI] [PMC free article] [PubMed] [Google Scholar]
- Huizenga HM, Molenaar PCM. Estimating and testing the sources of evoked potentials in the brain. Multivariate Behavioral Research. 1994;29:237–262. doi: 10.1207/s15327906mbr2903_3. [DOI] [PubMed] [Google Scholar]
- Huynh H, Feldt LS. Conditions under which the mean square ratios in repeated measurements designs have exact F distributions. Journal of the American Statistical Association. 1970;65:1582–1589. [Google Scholar]
- Jennings JR, Wood CC. The ε-adjustment procedure for repeated-measures analyses of variance. Psychophysiology. 1976;13:277–278. doi: 10.1111/j.1469-8986.1976.tb00116.x. [DOI] [PubMed] [Google Scholar]
- Johnson MH, de Haan M, Oliver A, Smith W, Hatzakis H, Tucker LA, Csibra G. Recording and analyzing high-density event-related potentials with infants using the Geodesic Sensor Net. Developmental Neuropsychology. 2001;19:295–323. doi: 10.1207/S15326942DN1903_4. [DOI] [PubMed] [Google Scholar]
- Johnson, M.H., Gilmore, R.O., & Csibra, G. (1998). Toward a computational model of the development of saccade planning. In J.E. Richards (Ed.), Cognitive neuroscience of attention: A developmental perspective (pp. 103–130). Hillsdale, NJ: Lawrence Erlbaum Press.
- Johnson MH, Posner MI, Rothbart MK. Facilitation of saccades toward a covertly attended location in early infancy. Psychological Science. 1994;5:90–93. [Google Scholar]
- Johnson MH, Tucker LA. The development and temporal dynamics of spatial orienting in infants. Journal of Experimental Child Psychology. 1996;63:171–188. doi: 10.1006/jecp.1996.0046. [DOI] [PubMed] [Google Scholar]
- Jung TP, Makeig S, Humphries C, Lee TW, McKeown MJ, Iragui V, Sejnowski TJ. Removing electroencephalographic artifacts by blind source separation. Psychophysiology. 2000a;37:163–178. [PubMed] [Google Scholar]
- Jung, T.-P., Makeig, S., Lee, T.-W., McKeown, M.J., Brown, G., Bell, A.J., & Sejnowski, T.J. (2000b). Independent component analysis of biomedical signals. In P. Pajunen & K. Karhunen (Eds.), Proceedings of the 2nd International Workshop on Independent Component Analysis and Source Separation (pp. 633–644). Helsinki, Finland.
- Jung TP, Makeig S, McKeown MJ, Bell AJ, Lee TW, Sejnowski T. Imaging brain dynamics using independent component analysis. Proceedings of the IEEE. 2001a;89:1107–1122. doi: 10.1109/5.939827. [DOI] [PMC free article] [PubMed] [Google Scholar]
- Jung TP, Makeig S, Westerfield M, Townsend J, Courchesne E, Sejnowski TJ. Analysis and visualization of single-trial event-related potentials. Human Brain Mapping. 2001b;14:166–185. doi: 10.1002/hbm.1050. [DOI] [PMC free article] [PubMed] [Google Scholar]
- Keselman HJ, Keselman JC. Comparing repeated measures means in factorial designs. Psychophysiology. 1988;25:612–618. doi: 10.1111/j.1469-8986.1988.tb01898.x. [DOI] [PubMed] [Google Scholar]
- Kurtzberg, D., & Vaughan, H.G. (1980). Differential topography of human eye movement potentials preceding visually triggered and self-initiated saccades. In H.H. Kornhuber & L. Deecke (Eds.), Motivation, motor and sensory processes of the brain (pp. 203–208). Amsterdam: Elsevier Science Publishers. [DOI] [PubMed]
- Kurtzberg D, Vaughan HG. Topographic analysis of human cortical potentials preceding self-initiated and visually triggered saccades. Brain Research. 1982;243:1–9. doi: 10.1016/0006-8993(82)91115-5. [DOI] [PubMed] [Google Scholar]
- Lee TW, Girolami M, Sejnowski TJ. Independent component analysis using an extended infomax algorithm for mixed subgaussian and supergaussian sources. Neural Computing. 1999;11:417–441. doi: 10.1162/089976699300016719. [DOI] [PubMed] [Google Scholar]
- Makeig S, Bell AH, Jung TP, Sejnowski TJ. Independent component analysis of electroencephalographic data. Advances in Neural Information Processing Systems. 1996;8:145–151. [Google Scholar]
- Makeig S, Jung TP, Bell AH, Ghahremani D, Sejnowski TJ. Blind separation of auditory event-related brain responses into independent components. Proceedings of the National Academy of Sciences. 1997;94:10979–10984. doi: 10.1073/pnas.94.20.10979. [DOI] [PMC free article] [PubMed] [Google Scholar]
- Mangun GR, Hillyard SA. Modulations of sensory-evoked brain potentials indicate changes in perceptual processing during visual-spatial priming. Journal of Experimental Psychology: Human Perception and Performance. 1991;17:1057–1074. doi: 10.1037//0096-1523.17.4.1057. [DOI] [PubMed] [Google Scholar]
- Martinez A, Anllo-Vento L, Sereno MI, Frank LR, Buxton RB, Dubowitz DJ, Wong EC, Hinrichs H, Heinze HJ, Hillyard SA. Involvement of striate and extrastriate visual cortical areas in spatial attention. Nature Neuroscience. 1999;2:364–369. doi: 10.1038/7274. [DOI] [PubMed] [Google Scholar]
- Matsuoka K, Harato H. Detection of rapid phases of eye movements using third-order derivatives. Japanese Journal of Ergonomics. 1983;19:147–153. [Google Scholar]
- Matsuoka K, Ueda Y. Frequency characteristics of the smooth pursuit component in tracking eye movements. Ergonomics. 1986;29:197–214. doi: 10.1080/00140138608968260. [DOI] [PubMed] [Google Scholar]
- Patterson, S.J., Badridze, N., Flax, J.F., Liu, W., & Benasich, A.A. (2004). A method for structural MRI scanning of non-sedated infants. Paper presented at the International Conference on Infancy Studies, Chicago, IL.
- Peña M, Maki A, Kovacic D, Dehaene-Lambertz G, Koizumi H, Bouquet F, Mehler J. Sounds and silence: an optical topography study of language recognition at birth. Proceedings of the National Academy of Sciences. 2003;100:11702–11705. doi: 10.1073/pnas.1934290100. [DOI] [PMC free article] [PubMed] [Google Scholar]
- Perrin F, Bertrand O, Pernier J. Scalp current density mapping: value and estimation from brain data. IEEE Transactions on Biomedical Engineering. 1987;34:283–288. doi: 10.1109/tbme.1987.326089. [DOI] [PubMed] [Google Scholar]
- Perrin F, Pernier J, Bertrand O, Echallier JF. Spherical splines for scalp potential and current density mapping. Electroencephalography and Clinical Neurophysiology. 1989;72:184–187. doi: 10.1016/0013-4694(89)90180-6. [DOI] [PubMed] [Google Scholar]
- Picton TW, Bentin S, Berg P, Donchin E, Hillyard SA, Johnson R, Miller GA, Ritter W, Ruchkin DS, Rugg MD, Taylor MJ. Guidelines for using human event-related potentials to study cognition: recording standards and publication criteria. Psychophysiology. 2000;37:127–152. [PubMed] [Google Scholar]
- Pivik RT, Broughton RJ, Coppola R, Davidson RJ, Fox N, Nuwer MR. Guidelines for the recording and quantitative analysis of electroencephalographic activity in research contexts. Psychophysiology. 1993;30:547–588. doi: 10.1111/j.1469-8986.1993.tb02081.x. [DOI] [PubMed] [Google Scholar]
- Posner MI. Orienting of attention. Quarterly Journal of Experimental Psychology. 1980;32:3–25. doi: 10.1080/00335558008248231. [DOI] [PubMed] [Google Scholar]
- Posner, M.I. (1995). Attention in cognitive neuroscience: an overview. In M.S. Gazzaniga (Ed.), Cognitive neurosciences (pp. 615–624). Cambridge, MA: MIT.
- Posner MI, Petersen SE. The attention system of the human brain. Annual Review of Neuroscience. 1990;13:25–42. doi: 10.1146/annurev.ne.13.030190.000325. [DOI] [PubMed] [Google Scholar]
- Putnam LE, Johnson R, Roth WT. Guidelines for reducing the risk of disease transmission in the psychophysiology laboratory. Psychophysiology. 1992;29:127–141. doi: 10.1111/j.1469-8986.1992.tb01676.x. [DOI] [PubMed] [Google Scholar]
- Rafal, R.D. (1998). The neurology of visual orienting: a pathological disintegration of development. In J.E. Richards (Ed.), Cognitive neuroscience of attention: A developmental perspective (pp. 181–218). Hillsdale, NJ: Lawrence Erlbaum Press.
- Reynolds, G.D., & Richards, J.E. (in press). Familiarization, attention, and recognition memory in infancy: an ERP and cortical source localization study. Developmental Psychology [DOI] [PMC free article] [PubMed]
- Richards JE. Localizing the development of covert attention in infants using scalp event-related-potentials. Developmental Psychology. 2000a;36:91–108. [PubMed] [Google Scholar]
- Richards, J.E. (2000b). The development of covert attention to peripheral targets and its relation to attention to central visual stimuli. Paper presented at the International Conference for Infancy Studies, Brighton, England, July.
- Richards JE. Cortical indices of saccade planning following covert orienting in 20-week-old infants. Infancy. 2001;2:135–157. [Google Scholar]
- Richards JE. Cortical source analysis of ERP of individual participants in psychophysiological experiments. Psychophysiology. 2002;37:S69. (abstract). [Google Scholar]
- Richards, J.E. (2003a). Development of attentional systems. In M. De Haan & M.H. Johnson (Eds.), The cognitive neuroscience of development (pp. 73–98). Hove, East Sussex: Psychology Press.
- Richards JE. Cortical sources of event-related-potentials in the prosaccade and antisaccade task. Psychophysiology. 2003b;40:878–894. doi: 10.1111/1469-8986.00106. [DOI] [PMC free article] [PubMed] [Google Scholar]
- Richards JE. Recovering dipole sources from scalp-recorded event-related-potentials using component analysis: principal component analysis and independent component analysis. International Journal of Psychophysiology. 2004a;54:201–220. doi: 10.1016/j.ijpsycho.2004.03.009. [DOI] [PubMed] [Google Scholar]
- Richards, J.E. (2004b). Development of covert orienting in young infants. In L. Itti, G. Rees & J. Tsotsos (Eds.), Neurobiology of attention (pp. 82–88). New York: Academic Press /Elsevier.
- Richards JE, Hunter SK. Peripheral stimulus localization by infants with eye and head movements during visual attention. Vision Research. 1997;37:3021–3035. doi: 10.1016/s0042-6989(97)00082-5. [DOI] [PubMed] [Google Scholar]
- Richards JE, Hunter SK. Testing neural models of the development of infant visual attention. Developmental Psychobiology. 2002;40:226–236. doi: 10.1002/dev.10029. [DOI] [PMC free article] [PubMed] [Google Scholar]
- Scherg, M. (1990). Fundamentals of dipole source potential analysis. In F. Grandon, M. Hoke & G.L. Romani (Eds.), Auditory evoked magnetic fields and potentials (Vol. 6, pp. 40–69). Basel: Karger.
- Scherg M. Functional imaging and localization of electromagnetic brain activity. Brain Topography. 1992;5:103–111. doi: 10.1007/BF01129037. [DOI] [PubMed] [Google Scholar]
- Scherg, M., & Picton, T.W. (1991). Separation and identification of event-related potential components by brain electrical source analysis. In C.H.M. Brunia, G. Mulder & M.N. Verbaten (Eds.), Event-related brain research (pp. 24–37). Amsterdam: Elsevier Science Publishers. [PubMed]
- Searle, S.R. (1971). Linear models New York: John Wiley & Sons.
- Searle, S.R. (1987). Linear models for unbalanced data New York: John Wiley & Sons.
- Talairach, J., & Tournoux, P. (1988). Co-planar stereotaxic atals of the human brain New York: Thieme Medical Publishers.
- Tucker DM. Spatial sampling of head electrical fields: the geodesic sensor net. Electroencephalography and Clinical Neurophysiology. 1993;87:154–163. doi: 10.1016/0013-4694(93)90121-b. [DOI] [PubMed] [Google Scholar]
- Tucker DM, Liotti M, Potts GF, Russell GS, Posner MI. Spatiotemporal analysis of brain electrical fields. Human Brain Mapping. 1994;1:134–152. [Google Scholar]
- Weinstein JM, Balaban CD, VerHoeve JN. Directional tuning of the human presaccadic spike potential. Brain Research. 1991;543:243–250. doi: 10.1016/0006-8993(91)90034-s. [DOI] [PubMed] [Google Scholar]