

Abstract
Background
We conducted a randomized, placebocontrolled, double-blind trial to test the hypothesis that vitamin D3 supplementation would prevent bone loss in calcium-replete, African American postmenopausal women.
Methods
Two hundred eight healthy black postmenopausal women, 50 to 75 years of age, were assigned to receive either placebo or 20 μg/d (800 IU) of vitamin D3. Calcium supplements were provided to ensure a total calcium intake of 1200 to 1500 mg/d. After 2 years, the vitamin D3 dose was increased to 50 μg/d (2000 IU) in the active group, and the study continued for an additional year. Bone mineral density (BMD) was measured every 6 months. Markers of bone turnover, vitamin D metabolites, and parathyroid hormone (PTH) levels were measured in serum.
Results
There were no significant differences in BMD between the active and control groups throughout the study. There was also no relationship between serum 25-hydroxyvitamin D levels attained and rates of bone loss. There was an increase in BMD of the total body, hip, and radius at 1 year in both groups. Over the 3 years, BMD declined at these sites by 0.26% to 0.55% per year. The BMD of the lumbar spine increased slightly in the placebo and active groups. There were no persistent changes in serum PTH levels or the markers of bone turnover, although there was a transient decline in PTH in both groups at 3 months. No significant adverse events were attributed to vitamin D supplementation.
Conclusions
There was no observed effect of vitamin D3 supplementation on bone loss or bone turnover markers in calcium-replete, postmenopausal African American women. Further studies are needed to determine if these findings are applicable to women of other ethnic groups.
There is consensus on the optimal calcium intake that should be recommended for reducing postmenopausal bone loss.1 Although it is recognized that vitamin D is important in calcium economy, optimal vitamin D intake is controversial.2 Serum 25-hydroxyvitamin D (25-OHD) is the best indicator of vitamin D status.3 Serum levels lower than 10 ng/mL (25 nmol/L) lead to rickets and osteomalacia, and levels lower than 20 ng/mL (50 nmol/L) may lead to secondary hyperparathyroidism and bone loss.3 Recent studies2,4,5 of the relationship of serum concentrations of 25-OHD to parathyroid hormone (PTH) have led many investigators to conclude that levels of 25-OHD greater than 32 ng/mL (80 nmol/L) are necessary to prevent a rise in PTH (and bone loss, by inference). It has been estimated that a vitamin D intake as high as 100 μg/d would be needed to attain these levels in light-skinned people residing in northern latitudes.6
Many studies7-10 supporting vitamin D supplementation have been performed in elderly patients who require greater quantities of vitamin D to prevent secondary hyperparathyroidism. Clinical trials evaluating the effect of vitamin D supplementation on loss of bone density in midlife have produced conflicting results.11-15 Some of these trials have combined calcium with vitamin D supplements, so that it is unclear which nutrient is responsible for the observed benefit.7,8,16 Another confounding factor in interpreting previous trials is that reducing bone resorption may result in a temporary alteration in the remodeling space with an increase in bone density that is limited to the length of the remodeling cycle.17
As a result of reduced dermal synthesis of vitamin D, black women have lower serum levels of 25-OHD than white women.18-20 In a preliminary shortterm study,21 we observed a reduction in bone turnover markers with supplementation of 20 μg/d.21 We hypothesized that vitamin D supplementation would decrease postmenopausal bone loss in African American women. To test our hypothesis, we performed a randomized, double-blind, 3-year trial comparing bone loss with vitamin D3 supplementation vs bone loss with placebo. Both groups received calcium supplements to ensure dietary calcium sufficiency. To our knowledge, this study is the first clinical trial examining the effect of vitamin D on bone loss in African American women.
METHODS
PARTICIPANTS
Ambulatory postmenopausal African American women not receiving hormone therapy were recruited from the Long Island community (Figure 1). All participants provided written informed consent, and the trial was approved by the institutional review board of Winthrop University Hospital, Mineola, NY. African American ancestry of the participants was assessed by self-declaration that both parents and at least 3 of 4 grandparents were African American. Exclusion criteria included previous treatment with bone active agents and any medication or illness that affects skeletal metabolism.
Figure 1.
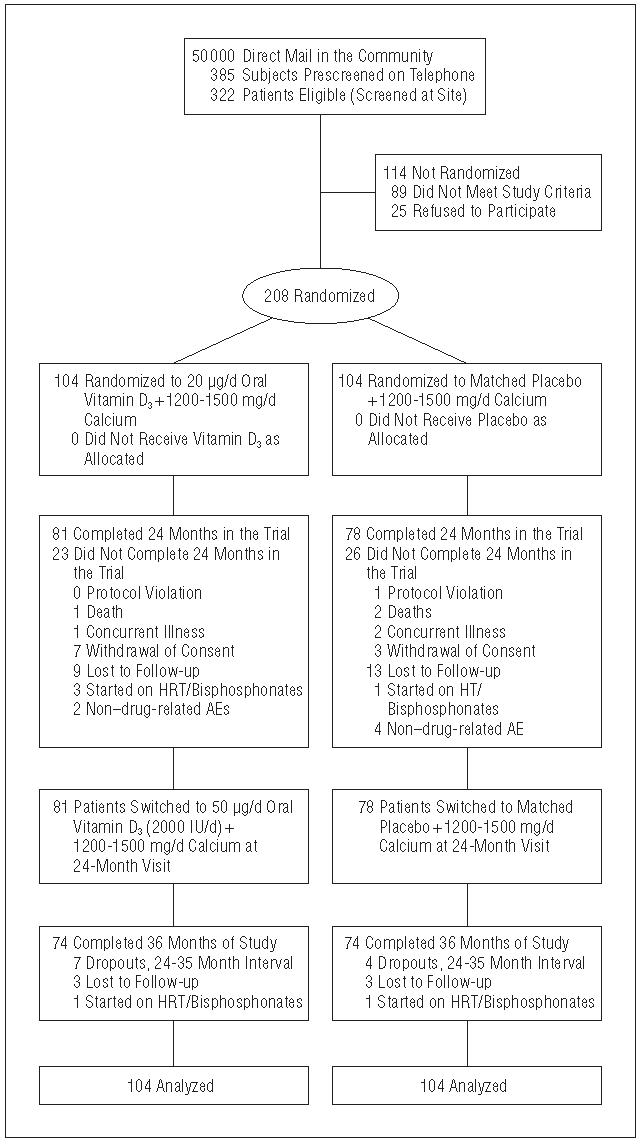
Flowchart of subject progress through trial. HT indicates hormone therapy; AEs, adverse events.
STUDY DESIGN
The participants were randomly assigned using a computergenerated sequence to receive either 20 μg/d of oral vitamin D3 or a matched placebo. After 24 months, the dose of vitamin D3 was raised to 50 μg/d in the calcium plus vitamin D (Ca + D) group. The dose was revised at the suggestion of the Data Safety Monitoring Board because of a growing consensus in the literature that 20 μg of vitamin D3 might not produce optimal serum levels of 25-OHD. The upper limit of vitamin D intake recommended by the Food and Nutrition Board is 50 μg/d. Calcium intake was assessed by food frequency at each visit, and supplements were given to both groups to ensure a total daily calcium intake of 1200 to 1500 mg. Vitamin D3 (20 μg and 50 μg capsules) and matched placebo capsules were custom manufactured for the study (Tishcon Corp, Westbury, NY). Vitamin D3 content was also analyzed in an independent laboratory (Vitamin D, Skin, and Bone Research Laboratory, Department of Medicine, Boston University School of Medicine, Boston, Mass). The calcium supplements were provided as calcium carbonate.
OUTCOME VARIABLES
Bone mineral density was measured at 6-month intervals at the total hip, nondominant midradius, whole body, and spine (anteroposterior) with a dual-energy x-ray absorptiometer (model QDR 4500, version 9.80D; Hologic Inc, Waltham, Mass). The coefficient of variation at our center for lumbar spine (L1-L4) is 0.81%; total hip, 0.62%; total body, 0.49%; and midradius, 0.78%.
LABORATORY TESTS
A fasting blood sample was collected for serum chemical analysis, calcium, PTH, 25-OHD, 1,25 dihydroxyvitamin D [1,25 (OH)2D], osteocalcin, and CrossLaps (C-terminal telopeptide of type 1 collagen; Nordic Bioscience Diagnostics, Herlev, Denmark) at baseline and at 3, 6, 12, 18, 24, 27, 30, and 36 months as was a 24-hour urine sample for calcium. Serum PTH was measured by the Allegro intact-PTH immunoassay purchased from Nichols Institute Diagnostics (San Juan Capistrano, Calif ).22 Serum 25-OHD was measured by radioimmunoassay using a kit manufactured by DiaSorin Inc (Stillwater, Minn).23 Serum 1,25(OH)2D was measured using commercial kits also manufactured by DiaSorin Inc. The assay involves a preliminary extraction and subsequent purification using C18OH cartridges. Following extraction, the treated sample was then assayed using a competitive radioimmunoassay procedure based on a polyclonal antibody that is specific for both 1,25(OH)2D2 and 1,25(OH)2D3.24 Serum osteocalcin and serum CrossLaps were measured by a 1-step enzyme-linked immunoabsorbent assay (Nordic Bioscience Diagnostics).
STATISTICAL ANALYSIS
The primary end point for this study was the BMD of the total hip. An intention-to-treat approach that included all data was followed in all primary analyses. We analyzed longitudinal outcome variables with repeated measures regression models, using the PROC MIXED software (SAS, version 8.2; SAS Inc, Cary, NC). The significance of different BMD slopes between treatment groups was tested by examining the interaction of group and time. The study was designed for an active placebo differential BMD percent change per year of 0.36 with a power of 0.80. The slope over 3 years was divided by baseline to derive an annualized percent change from baseline per year. Comparisons of weighted mean slopes between groups was performed by independent t tests, the weight being the inverse of the variance of each estimated slope. No interim analyses were performed. Post hoc analyses included the linear correlation of each individual's rate of BMD change over time with their mean serum 25-OHD level in the course of study. In addition, where suitable, secondary analyses included 25-OHD as a covariate. The mean±SD and 95% confidence intervals (CIs) are reported.
RESULTS
BASELINE CHARACTERISTICS
The baseline demographic profile and laboratory values of the study population are summarized in Table 1. There were no significant differences between the 2 groups. A majority of the participants had some college experience. The women had moderately active lifestyles. Approximately 47% were taking supplemental calcium and/or vitamins at baseline. Seven percent of the women smoked. The initial BMD at the total hip for the whole cohort ranged from normal (65.0%) to osteopenic (33.6%) to osteoporotic (1.4%) with a mean T-score of −0.59±0.84 (range, −2.9 to 1.7) using black women from the third National Health and Nutrition Examination Survey20 as the reference. The baseline 25-OHD levels ranged from 5 to 40 ng/mL (12.5 nmol/L to 99.7 nmol/L) with a mean level of 18.8 ng/mL (47 nmol/L) in the study population (Table 1, Figure 2).
Table 1.
Baseline Values for Demographics, Bone Mineral Density, and Laboratory Values*
| Characteristic | Ca Group (n = 104) | Ca+D Group (n = 104) |
|---|---|---|
| Age, y | 61.2 ± 6.3 | 59.9 ± 6.2 |
| Height, cm | 161.4 ± 6.1 | 162.7 ± 6.6 |
| Weight, kg | 79.2 ± 12.6 | 78.0 ± 13.6 |
| BMI, kg/m2 | 30 ± 4 | 29 ± 4 |
| Smoking, % | ||
| Current user | 7 | 7 |
| Former user | 40 | 35 |
| Dietary vitamin D intake, μg/d | 4.6 ± 4.2 | 4.6 ± 4.8 |
| Calcium intake, mg/d | 756 ± 541 | 762 ± 623 |
| BMD | ||
| Total hip, g/cm2 | 0.946 ± 0.116 | 0.932 ± 0.146 |
| Radius, g/cm2 | 0.614 ± 0.061 | 0.619 ± 0.067 |
| Total body, g/cm2 | 0.940 ± 0.074 | 0.934 ± 0.095 |
| Spine, g/cm2 | 1.005 ± 0.142 | 0.984 ± 0.155 |
| 25-OHD, ng/mL | 17.2 ± 6.64 | 19.3 ± 8.36 |
| 1,25(OH)2D, pg/mL | 45.7 ± 15.10 | 46.5 ± 15.2 |
| PTH, pg/mL | 42.4 ± 18.4 | 44.2 ± 19.3 |
| Osteocalcin, ng/mL | 14.5 ± 7.4) | 16.3 ± 8.2 |
| Serum CrossLaps,† ng/mL | 0.318 ± 0.140 | 0.345 ± 0.149 |
Abbreviations: BMD, bone mineral density; BMI, body mass index; Ca, calcium; D, vitamin D; PTH, parathyroid hormone.
SI conversion factors: To convert 25-hydroxyvitamin D (25-OHD) to nanomoles per liter, multiply by 2.496; 1,25-dihydroxyvitamin D [1,25(OH)2D] to picomoles per liter, multiply by 2.4; parathyroid hormone to picomoles per liter, multiply by 0.106; osteocalcin to nanomoles per liter, multiply by 0.172; serum CrossLaps to picomoles per liter, multiply by 7750.
Values are given as mean ± SD. There were no significant differences between groups.
Nordic Bioscience Diagnostics, Herlev, Denmark.
Figure 2.
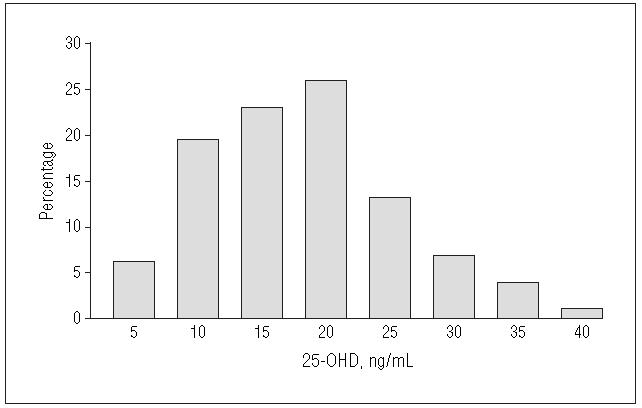
Distribution of baseline 25-hydroxyvitamin D (25-OHD) among African American postmenopausal women (n = 208). To convert 25-OHD to nanomoles per liter, multiply by 2.496.
ADHERENCE
Mean pill count compliance was 87%±8% of vitamin D pills consumed after the randomization visit. Approximately 96%±7% of the subsequent visits were kept by our patients. Mean daily calcium intake including supplements was 1312±153 mg/d in the calcium-alone (Ca) group and 1349±204 mg/d in the Ca + D group.
BONE DENSITY CHANGES
There was no difference in the rate of bone loss between the Ca + D group compared with the Ca group at any time during the 3 years of study duration (Figure 3). Correlation analysis also failed to show any relationship between serum 25-OHD levels and bone density change in either group alone or in the combined groups. There were statistically significant declines in BMD per year at each measurement site, except for the lumbar spine, over the 3-year study period in both groups. The overall change in BMD at the total hip among the participants was −0.40%±1.8% (95% CI, −0.8% to −0.03%) in the Ca group compared with −0.4%±1.2% (95% CI, −0.6% to −0.2%) in the Ca + D group. The midradius BMD changed by −0.55%±1.8% (95% CI, −0.9% to −2.0%) in the Ca group vs −0.8%±1.3% (95% CI, −1.1% to −0.6%) in the Ca + D group. Total body BMD declined by 0.3%±1.5% (95% CI, −0.6% to −0.0%) in the Ca group vs a decline of 0.35%±1.6% (95% CI, −0.7% to −0.0%) in the Ca + D group. The nonsignificant increase in BMD of the lumbar spine was +0.3% in the Ca group (95% CI, −0.1% to 0.6%) and 0.25% (95% CI, −0.1% to +0.6%) in the Ca + D group.
Figure 3.

Box and whisker plots of the percent change from baseline for 4 body sites. There were no significant differences between groups. BMD indicates bone mineral density.
An analysis of the linear correlation of each individual's rate of BMD change over time with the mean serum 25-OHD level attained in the course of the study revealed no association. Other analyses examining those with low baseline 25-OHD or high PTH also showed no influence of 25-OHD on BMD changes.
Although the overall trend was loss in BMD over 3 years, over the first year there was a statistically significant and substantial increase in BMD at all sites (except the lumbar spine) in both study groups (Figure 3), generally at a magnitude of between 1.1% and 1.3% (P<.001). The lumbar spine increased by only half that amount (0.6% over the first year). Changes over the second and third years revealed a significant change in BMD of the total body, hip, and radius from −1.0% to −1.6% per year (P<.001), whereas there was virtually no change in the lumbar spine during that period.
LABORATORY VALUES
Mean serum 25-OHD levels increased in the Ca + D from a baseline of 18.8 ng/mL (46.9 nmol/L) (95% CI, 17.620.4 ng/mL [43.9-50.9 nmol/L] to 28.4 ng/mL (70.8 nmol/L) (95% CI, 26.6-30.5 ng/mL) [66.4-76.1 nmol/L]) (P<.001) with 3 months of 20 μg/d vitamin D3 supplementation and to 34.8 ng/mL (86.9 nmol/L) (95% CI, 32.1-37.7 ng/mL [80.1-94.1 nmol/L]) (P<.001) 3 months following the increase in dose to 50 μg/d. The serum 25-OHD levels in the Ca group did not change significantly throughout the study. The final distribution of 25-OHD levels in the active group revealed that about 40% of postmenopausal women still had serum 25-OHD levels of less than 32 ng/mL (8.0 nmol/L) despite 50 μg/d of vitamin D3 supplementation. A decline in PTH levels at 3 months in both groups was not sustained. Serum 1,25(OH)2D levels also declined at 3 months in the Ca group but not in the Ca + D group. The bone markers, serum osteocalcin, and CrossLaps did not reveal any significant differences between the 2 groups.
ADVERSE EVENTS
A total of 222 adverse events were reported in the study over 3 years. There were 15 serious adverse events, 8 in the Ca + D group and 7 in the Ca group. None of these adverse events were considered to be related to the study. There were 9 isolated incidences of mild hypercalcemia (6 in the Ca + D group and 3 in the Ca group), which were in the reference range on repeated sampling. Similarly, isolated episodes of elevated 24-hour urinary calcium excretion (>5 mg/kg per day) were observed among 4 participants (3 in the Ca + D group, 1 in the Ca group). Calcium supplements were discontinued in 1 participant. There was a slight increase in serum calcium and urinary calcium excretion over 3 years in both the Ca + D and the Ca groups, but these levels remained within the reference range for healthy adults in all participants (Table 2). There were no episodes of nephrolithiasis. There was a slight increase in serum creatinine in both groups over 3 years that also remained within the reference range for healthy adults in all participants.
Table 2.
Laboratory Safety Measurements*
| Variable | Baseline | 24 Months | 36 Months |
|---|---|---|---|
| Serum calcium, mg/dL† | |||
| Ca group | 8.96 ± 0.49 | 9.26 ± 0.35‡ | 9.39 ± 0.46‡ |
| Ca + D group | 8.96 ± 0.59 | 9.26 ± 0.45‡ | 9.51 ± 0.41‡ |
| 24-h Urine calcium, mg/d† | |||
| Ca group | 92.0 ± 66.0 | 107.39 ± 66.6‡ | 100.60 ± 63.5 |
| Ca + D group | 86.3 ± 49.7 | 118.84 ± 69.3‡ | 113.0 ± 76.3‡ |
| Serum creatinine, mg/dL† | |||
| Ca group | 0.86 ± 0.16 | 0.94 ± 0.22‡ | 0.99 ± 0.18‡ |
| Ca + D group | 0.88 ± 0.16 | 0.93 ± 0.21‡ | 0.99 ± 0.20‡ |
Abbreviations: Ca, calcium; D, vitamin D.
SI conversion factors: To convert serum calcium to millimoles per liter, multiply by 0.25; urine calcium to millimoles per day, multiply by 0.025; creatinine to micromoles per liter, multiply by 88.4.
Values are given as mean ± SD.
Statistically significant from baseline, P<.05.
No significant difference between calcium plus vitamin D and calcium-alone groups.
COMMENT
We found no benefit of vitamin D3 supplementation over calcium supplementation alone in preventing bone loss in postmenopausal African American women. Moreover, we found no evidence for a relationship between serum 25-OHD levels and rates of bone loss. Although there have been several trials including white women with bone density as an outcome that suggest that vitamin D supplementation prevents bone loss, some recent trials dispute this conclusion.11,12,16,25
The lack of significant differences between the 2 groups in this study was not due to a lack of statistical power. The study was designed to detect a difference in BMD change of more than 0.36% per year, and no differences were larger than that. A post hoc analysis of the linear correlation of each individual's rate of BMD change over time with the mean serum 25-OHD level attained in the course of the study reveals almost no association in our population.
Previous trials that suggest a benefit of vitamin D supplementation have been conducted with white participants. African American women have an incidence of hip fracture that is only 40% of that observed in white women.25 Their skeletal advantage may result not only from a higher bone mass but also from lower bone remodeling rates and an advantageous skeletal geometry.19,26,27 Superior calcium economy is present in black women from childhood. Black adolescent girls have an increased calcium absorption efficiency and reduced renal calcium excretion.28 This may result from higher serum 1,25(OH)2D levels, which in turn may be secondary to higher PTH levels.29 Importantly, there is indirect and direct evidence of a relative skeletal resistance to PTH in black women.30 Because African American women have a lower rate of bone remodeling and a more efficient calcium economy, it has been estimated that they may require as much as several hundred milligrams less of calcium per day than white women.31
Vitamin D supplementation may have a greater effect in calcium-deficient women. In one study,21 calcium supplementation prevented bone loss but vitamin D alone was less effective, having an effect only at low calcium intake. The studies4,5 that have estimated that 25-OHD values greater than 32 ng/mL (80 nmol/L) are necessary to prevent a rise in PTH have been generally performed in elderly, white, calcium-deficient populations. In one prospective study,32 where calcium supplements were combined with vitamin D2 supplementation, there was no decrease in PTH levels in patients with serum 25-OHD levels greater than 20 ng/mL (50 nmol/L) at baseline. In the MORE study,33 of 7564 postmenopausal women (mean age, 66.5 years), the placebo group received 500 mg of calcium and 400 to 600 IU of vitamin D3 daily. The authors concluded that based on higher baseline PTH levels and the greater decline in PTH levels, those with 25-OHD levels less than 20 ng/mL (50 nmol/L) might benefit from vitamin D supplementation.
Furthermore, in some studies that concluded that vitamin D prevents fractures, calcium supplements were included in the vitamin D group but not the placebo group. Because a number of trials have suggested antifracture efficacy of calcium alone, it is unknown if the vitamin D or the calcium provided the benefit.34-36
Consideration in interpreting bone loss rates should also be given to the remodeling transient, a temporary alteration in the balance between bone formation and bone resorption brought about by any factor that reduces bone resorption. Clinical trials using BMD as an end point usually employ linear regression analyses to calculate rates of loss. As a result, a 2- to 3-year study may show a positive response to an antiresorptive agent even if the increase occurred only in the first year as a result of the remodeling transient. We detected a remodeling transient effect in our study that we believe was due to calcium supplementation. Examination of previous trials suggest that the observed benefit from vitamin D supplements may have reflected the remodeling transient and would not necessarily be sustained.17
Vitamin D supplementation was not associated with any significant adverse effects. This confirms the demonstration by others that even higher quantities of vitamin D3 supplements are safe.37 Importantly, in our study the safety of vitamin D supplements was evaluated in a state of calcium sufficiency.
Our study demonstrated a lack of benefit of vitamin D supplementation on loss of skeletal mass in calcium-sufficient African American women in midlife. Although this may not be extrapolated to women of other ethnic groups, to elderly women, or to greater degrees of vitamin D insufficiency, it lends support to reexamination of optimal vitamin D nutrition for skeletal health in postmenopausal women of other ethnic groups.
Acknowledgment
We thank members of the Data Safety and Monitoring Board: Robert Recker, MD, Marjorie Luckey, MD, Michael Borenstein, PhD, Charles Hollingsworth, MD, PhD, Sherry Sherman, PhD, and Joanna Badanelli, MEd. We thank Michael Holick, MD, PhD, and Tai Chen, PhD, for an independent assessment of vitamin D content of our study medication. We also thank Sharon Sprintz, RT, Jane Moore, RN, and Martin Feuerman, MS, for their expertise and Audrey Gallo-Neglia for preparation of the manuscript.
Footnotes
Financial Disclosure: None.
Funding/Support: This research was funded by the National Institute of Aging (RO1 AG15325), National Institutes of Health, Bethesda, Md.
REFERENCES
- 1.Osteoporosis prevention, diagnosis, and therapy. NIH Consens Statement. 2000;17:1–45. [PubMed] [Google Scholar]
- 2.Heaney RP. Lessons for nutritional science from vitamin D. Am J Clin Nutr. 1999;69:825–826. doi: 10.1093/ajcn/69.5.825. [DOI] [PubMed] [Google Scholar]
- 3.Burckhardt P. Calcium and vitamin D in osteoporosis: supplementation or treatment? Calcif Tissue Int. 2002;70:74–77. doi: 10.1007/s00223-001-0033-2. [DOI] [PubMed] [Google Scholar]
- 4.Chapuy MC, Preziosi P, Maamer M, et al. Prevalence of vitamin D insufficiency in an adult normal population. Osteoporos Int. 1997;7:439–443. doi: 10.1007/s001980050030. [DOI] [PubMed] [Google Scholar]
- 5.Guillemant J, Le HT, Maria A, Allemandou A, Peres G, Guillemant S. Wintertime vitamin D deficiency in male adolescents: effect on parathyroid function and response to vitamin D3 supplements. Osteoporos Int. 2001;12:875–879. doi: 10.1007/s001980170040. [DOI] [PubMed] [Google Scholar]
- 6.Vieth R, Chan PC, MacFarlane GD. Efficacy and safety of vitamin D3 intake exceeding the lowest observed adverse effect level. Am J Clin Nutr. 2001;73:288–294. doi: 10.1093/ajcn/73.2.288. [DOI] [PubMed] [Google Scholar]
- 7.Dawson-Hughes B, Harris SS, Krall EA, Dallal GE. Effect of calcium and vitamin D supplementation on bone density in men and women 65 years of age or older. N Engl J Med. 1997;337:670–676. doi: 10.1056/NEJM199709043371003. [DOI] [PubMed] [Google Scholar]
- 8.Chapuy MC, Arlot ME, Duboeuf F, et al. Vitamin D3 and calcium to prevent hip fractures in the elderly women. N Engl J Med. 1992;327:1637–1642. doi: 10.1056/NEJM199212033272305. [DOI] [PubMed] [Google Scholar]
- 9.Lips P, Graafmans WC, Ooms ME, Bezemer PD, Bouter LM. Vitamin D supplementation and fracture incidence in elderly persons: a randomized, placebo-controlled clinical trial. Ann Intern Med. 1996;124:400–406. doi: 10.7326/0003-4819-124-4-199602150-00003. [DOI] [PubMed] [Google Scholar]
- 10.Ooms ME, Roos JC, Bezemer PD, van der Vijgh WJ, Bouter LM, Lips P. Prevention of bone loss by vitamin D supplementation in elderly women: a randomized double-blind trial. J Clin Endocrinol Metab. 1995;80:1052–1058. doi: 10.1210/jcem.80.4.7714065. [DOI] [PubMed] [Google Scholar]
- 11.Cooper L, Clifton-Bligh PB, Nery ML, et al. Vitamin D supplementation and bone mineral density in early postmenopausal women. Am J Clin Nutr. 2003;77:1324–1329. doi: 10.1093/ajcn/77.5.1324. [DOI] [PubMed] [Google Scholar]
- 12.Hunter D, Major P, Arden N, et al. A randomized controlled trial of vitamin D supplementation on preventing postmenopausal bone loss and modifying bone metabolism using identical twin pairs. J Bone Miner Res. 2000;15:2276–2283. doi: 10.1359/jbmr.2000.15.11.2276. [DOI] [PubMed] [Google Scholar]
- 13.Trivedi DP, Doll R, Khaw KT. Effect of four monthly oral vitamin D3 (cholecalciferol) supplementation on fractures and mortality in men and women living in the community: randomised double blind controlled trial. BMJ. 2003;326:469. doi: 10.1136/bmj.326.7387.469. [DOI] [PMC free article] [PubMed] [Google Scholar]
- 14.Baeksgaard L, Andersen KP, Hyldstrup L. Calcium and vitamin D supplementation increases spinal BMD in healthy, postmenopausal women. Osteoporos Int. 1998;8:255–260. doi: 10.1007/s001980050062. [DOI] [PubMed] [Google Scholar]
- 15.Riis BJ, Thomsen K, Christiansen C. Does 25R, 25(OH)2-vitamin D3 prevent postmenopausal bone loss? Calcif Tissue Int. 1986;39:128–132. doi: 10.1007/BF02555107. [DOI] [PubMed] [Google Scholar]
- 16.Papadimitropoulos E, Wells G, Shea B, et al. Meta-analyses of therapies for postmenopausal osteoporosis, VIII: meta-analysis of the efficacy of vitamin D treatment in preventing osteoporosis in postmenopausal women. Endocr Rev. 2002;23:560–569. doi: 10.1210/er.2001-8002. [DOI] [PubMed] [Google Scholar]
- 17.Heaney RP. The bone remodeling transient: interpreting interventions involving bone-related nutrients. Nutr Rev. 2001;59:327–334. doi: 10.1111/j.1753-4887.2001.tb06957.x. [DOI] [PubMed] [Google Scholar]
- 18.Aloia JF, Vaswani A, Yeh JK, Flaster E. Risk for osteoporosis in black women. Calcif Tissue Int. 1996;59:415–423. doi: 10.1007/BF00369203. [DOI] [PubMed] [Google Scholar]
- 19.Meier DE, Luckey MM, Wallenstein S, Lapinski RH, Catherwood B. Racial differences in pre- and postmenopausal bone homeostasis: association with bone density. J Bone Miner Res. 1992;7:1181–1189. doi: 10.1002/jbmr.5650071010. [DOI] [PubMed] [Google Scholar]
- 20.Nesby-O'Dell S, Scanlon KS, Cogswell ME, et al. Hypovitaminosis D prevalence and determinants among African American and white women of reproductive age: third National Health and Nutrition Examination Survey, 1988-1994. Am J Clin Nutr. 2002;76:187–192. doi: 10.1093/ajcn/76.1.187. [DOI] [PubMed] [Google Scholar]
- 21.Kyriakidou-Himonas M, Aloia JF, Yeh JK. Vitamin D supplementation in postmenopausal black women. J Clin Endocrinol Metab. 1999;84:3988–3990. doi: 10.1210/jcem.84.11.6132. [DOI] [PubMed] [Google Scholar]
- 22.Kao PC, Jiang NS, Klee GG, Purnell DC. Development and validation of a new radioimmunoassay for parathyrin (PTH) Clin Chem. 1982;28:69–74. [PubMed] [Google Scholar]
- 23.Hollis B. Relative concentrations of 25-hydroxyvitamin D2/D3 and 1,25-dihydroxyvitamin D2/D3 in maternal plasma at delivery. Nutr Res. 1984;4:27. [Google Scholar]
- 24.Hollis BW. Assay of circulating 1,25-dihydroxyvitamin D involving a novel single-cartridge extraction and purification procedure. Clin Chem. 1986;32:2060–2063. [PubMed] [Google Scholar]
- 25.Jacobsen SJ, Goldberg J, Miles TP, Brody JA, Stiers W, Rimm AA. Hip fracture incidence among the old and very old: a population-based study of 745,435 cases. Am J Public Health. 1990;80:871–873. doi: 10.2105/ajph.80.7.871. [DOI] [PMC free article] [PubMed] [Google Scholar]
- 26.Finkelstein JS, Lee ML, Sowers M, et al. Ethnic variation in bone density in premenopausal and early perimenopausal women: effects of anthropometric and lifestyle factors. J Clin Endocrinol Metab. 2002;87:3057–3067. doi: 10.1210/jcem.87.7.8654. [DOI] [PubMed] [Google Scholar]
- 27.Nelson DA, Barondess DA, Hendrix SL, Beck TJ. Cross-sectional geometry, bone strength, and bone mass in the proximal femur in black and white postmenopausal women. J Bone Miner Res. 2000;15:1992–1997. doi: 10.1359/jbmr.2000.15.10.1992. [DOI] [PubMed] [Google Scholar]
- 28.Bryant RJ, Wastney ME, Martin BR, et al. Racial differences in bone turnover and calcium metabolism in adolescent females. J Clin Endocrinol Metab. 2003;88:1043–1047. doi: 10.1210/jc.2002-021367. [DOI] [PubMed] [Google Scholar]
- 29.Aloia JF, Mikhail M, Pagan CD, Arunachalam A, Yeh JK, Flaster E. Biochemical and hormonal variables in black and white women matched for age and weight. J Lab Clin Med. 1998;132:383–389. doi: 10.1016/s0022-2143(98)90109-3. [DOI] [PubMed] [Google Scholar]
- 30.Cosman F, Morgan DC, Nieves JW, et al. Resistance to bone resorbing effects of PTH in black women. J Bone Miner Res. 1997;12:958–966. doi: 10.1359/jbmr.1997.12.6.958. [DOI] [PubMed] [Google Scholar]
- 31.Heaney RP. The importance of calcium intake for lifelong skeletal health. Calcif Tissue Int. 2002;70:70–73. doi: 10.1007/s00223-001-0032-3. [DOI] [PubMed] [Google Scholar]
- 32.Peacock M, Liu G, Carey M, et al. Effect of calcium or 25OH vitamin D3 dietary supplementation on bone loss at the hip in men and women over the age of 60. J Clin Endocrinol Metab. 2000;85:3011–3019. doi: 10.1210/jcem.85.9.6836. [DOI] [PubMed] [Google Scholar]
- 33.Lips P, Duong T, Oleksik A, et al. A global study of vitamin D status and parathyroid function in postmenopausal women with osteoporosis: baseline data from the Multiple Outcomes of Raloxifene Evaluation Clinical Trial. J Clin Endocrinol Metab. 2001;86:1212–1221. doi: 10.1210/jcem.86.3.7327. [DOI] [PubMed] [Google Scholar]
- 34.Recker RR, Hinders S, Davies KM, et al. Correcting calcium nutritional deficiency prevents spine fractures in elderly women. J Bone Miner Res. 1996;11:1961–1966. doi: 10.1002/jbmr.5650111218. [DOI] [PubMed] [Google Scholar]
- 35.Reid IR, Ames RW, Evans MC, Gamble GD, Sharpe SJ. Long-term effects of calcium supplementation on bone loss and fractures in postmenopausal women: a randomized controlled trial. Am J Med. 1995;98:331–335. doi: 10.1016/S0002-9343(99)80310-6. [DOI] [PubMed] [Google Scholar]
- 36.Riggs BL, O'Fallon WM, Muhs J, O'Connor MK, Kumar R, Melton LJ., III Longterm effects of calcium supplementation on serum parathyroid hormone level, bone turnover, and bone loss in elderly women. J Bone Miner Res. 1998;13:168–174. doi: 10.1359/jbmr.1998.13.2.168. [DOI] [PubMed] [Google Scholar]
- 37.Vieth R. Vitamin D supplementation, 25-hydroxyvitamin D concentrations, and safety. Am J Clin Nutr. 1999;69:842–856. doi: 10.1093/ajcn/69.5.842. [DOI] [PubMed] [Google Scholar]