Abstract
We have developed an imaging approach to estimate the diameter of exocytic vesicles that are smaller than the resolution of an optical microscope and present within intact tissue. This approach is based on two-photon excitation imaging of polar tracers in the extracellular medium, is designated TEPIQ (two-photon extracellular polar-tracer imaging-based quantification), and has three variants. TEPIQ analysis of ΔV measures vesicle volume with a fluid-phase tracer, sulforhodamine B (SRB). TEPIQ analysis of ΔS determines vesicle surface area with a polar membrane tracer, FM1-43. TEPIQ analysis of ΔV/ΔS estimates vesicle diameter from the SRB/FM1-43 fluorescence ratio. TEPIQ analysis is insensitive to microscope settings because the same setup is used for calibration and actual experiments. We tested the validity of TEPIQ with glucose-induced exocytosis from beta-cells within pancreatic islets. The three TEPIQ variants yielded estimates for the mean diameter of exocytic vesicles of between 340 and 390 nm, consistent with the size of insulin granules. TEPIQ analysis relies on the combination of two-photon excitation imaging, the narrow intercellular spaces of intact tissue, and the presence of diffusible polar tracers in the extracellular medium. It allows quantitative imaging of exocytosis within secretory organs, yielding estimates of vesicle diameter with nanometer resolution.
In conventional imaging studies of exocytosis, secretory vesicles are stained with a fluorescent probe before exocytosis and the release of the probe during exocytosis is measured (Betz & Bewick, 1992; Steyer et al. 1997; Oheim et al. 1999). Such pre-fusion labelling has been used to investigate the history of vesicles prior to fusion (Steyer et al. 1997; Avery et al. 2000; Tsuboi et al. 2002). In contrast, we have developed a post-fusion labelling approach, in which vesicles are labelled after the fusion reaction by polar tracers present in the extracellular solution and are imaged with a two-photon excitation microscope (Nemoto et al. 2001; Takahashi et al. 2002). Such two-photon extracellular polar-tracer (TEP) imaging is superior to imaging based on pre-fusion labelling for tracking the fate of vesicles after fusion. TEP imaging thus shows no selection bias and, like measurement of membrane capacitance, allows the study of exocytosis and endocytosis in a fully quantitative manner.
As an extension of our previous studies (Nemoto et al. 2001, 2004; Takahashi et al. 2002, 2004), we now describe a new approach, TEP imaging-based quantification (TEPIQ), for estimating the diameter of vesicles undergoing exocytosis. TEPIQ analysis provides an estimate of vesicle diameter based on a comparison of fluorescence between the vesicle and either the extracellular medium or the plasma membrane. It can also be applied to vesicles smaller than the spatial resolution of an optical microscope, a feat that cannot be achieved by any other method for studying vesicle dynamics, including capacitance measurement, amperometric measurement, and imaging based on pre-fusion labelling. To validate this approach, we applied TEPIQ analysis to the exocytosis of insulin granules in the pancreatic islets, where TEP imaging has already been applied to characterize the nature of exocytosis (Takahashi et al. 2002, 2004), and where beta-cells are ideally spherical for the calibration of TEPIQ analysis. The diameter of exocytic vesicles estimated by TEPIQ analysis was consistent with that of insulin granules determined by electron microscopy. We address possible errors in TEPIQ analysis as well as the advantages and potential applications of this approach for studies of exocytosis in intact secretory tissues.
Methods
Cell preparations
Islets of Langerhans were isolated from the pancreas of 8- to 12-week-old ICR mice by collagenase digestion (Takahashi et al. 1997), and single-cell suspensions were obtained from the islets by trituration. Either islets or isolated beta-cells were cultured overnight under a humidified atmosphere of 5% CO2 at 37°C in Dulbecco's modified Eagle's medium, with a glucose concentration of 1.0 mg ml−1 and supplemented with 10% fetal bovine serum, penicillin (100 μU ml−1), and streptomycin (100 mg ml−1). Individual beta-cells or islets were examined in a recording chamber containing 0.1 mm glass cover slips (Matsunami-glass, Osaka, Japan). The bathing solution for experiments (SolA, 320 mosmolar) consisted of 140 mm NaCl, 5 mm KCl, 2 mm CaCl2, 1 mm MgCl2, 2.8 mm glucose, and 10 mm Hepes-NaOH (pH 7.4). Imaging experiments were performed at room temperature (24 to 25°C). The experiments were approved by the Animal Experiment Committee of the National Institute for Physiological Sciences.
TEP imaging
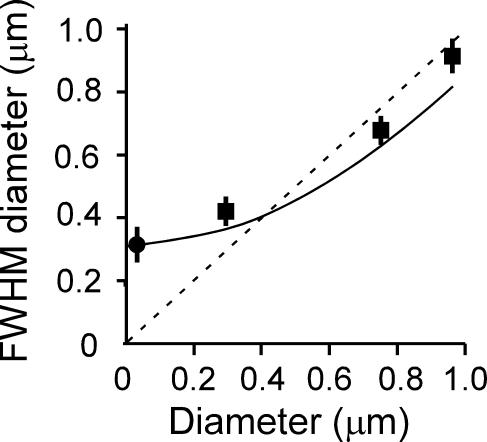
The recording chamber was placed on the platform of an inverted microscope (IX70; Olympus, Tokyo, Japan) equipped with a laser scanner (FV300, Olympus), a water-immersion objective lens (UPlanApo 60 × water/IR; numerical aperture of 1.2), and a mode-locked femtosecond-pulse laser (Tsunami; Spectra Physics, Mountain View, CA, USA). The lateral and axial full-width-at-half-maximal (FWHM) resolutions were estimated to be 0.32 ± 0.05 μm (mean ±s.d., n = 6) (Fig. 1) and ∼1.5 μm, respectively, with the use of a quantum dot with a core diameter of 5 nm (CdSe/ZnS Evitags-Adirondack Green-Amine; Evident Technologies, Troy, NY, USA) immersed in Aqua Mount (Polyscience, Warrington, PA, USA). FluoSphere (diameters of 0.282 and 0.977 μm; Molecular Probes, Eugene, OR, USA) and Fluosbrite (diameter of 0.748 μm; Polyscience) polystyrene beads were also used for measurement of lateral FWHM diameter (Fig. 1).
Figure 1. Relation between the measured lateral FWHM diameters and the actual diameters of a quantum dot and fluorescent spheres in xy-images.
• represents the quantum dot and ▪ represents the fluorescent beads (actual diameters of 0.282, 0.748 and 0.977 μm). Error bars indicate s.d. (n = 6–17). The smooth curve represents predicted FWHM diameters based on eqn (A19) in Appendix D.
The bathing solution contained 0.4 mm sulforhodamine B (SRB; Molecular Probes) either alone or together with 20 μm FM1-43 (Molecular Probes). For stimulation of exocytosis, either the concentration of glucose in the bathing solution was increased to 20 mm or islets that had been loaded with 25 μm nitrophenyl-EGTA (NPE)-acetoxymethyl ester (Molecular Probes) (Takahashi et al. 2004) were exposed to light from a mercury lamp (U-ULS100HG, Olympus) fitted with a 360 nm band pass filter to induce the photolysis of NPE (Kasai et al. 1996; Takahashi et al. 2004). The radiation of the mercury lamp was gated with an electric shutter (IX-ESU, Olympus) with a 500 ms opening. For calibration of ΔS-TEPIQ analysis, we rapidly applied FM1-43 (20 μm) and SRB (0.4 mm) with a glass pipette to obtain images as quickly as possible (< 2 min).
The fluorescence of SRB was measured at 570–650 nm (red channel) and that of FM1-43 was measured at 400–550 nm (blue channel). The laser power at the specimen was 5–10 mW, and the wavelength was 830 nm for SRB imaging or 850 nm for double staining with SRB and FM1-43. We acquired images every 0.3 to 1.5 s with the Fast1 or Fast2 acquisition mode and Zoom4 setting of the FV300 laser scanner. The control voltages of the photomultipliers were set at 500 and 650 V for the red and blue channels, respectively. For double staining, overlap of the emission spectra of the two tracers was estimated by measuring fluorescence from preparations stained with only one tracer under the same experimental conditions. Such cross talk was significant only for FM1-43 (∼25% cross talk from the blue to the red channel), and this FM1-43 leakage was subtracted from the SRB images.
Results
Ca2+-dependent exocytosis in beta-cells of intact islets of Langerhans
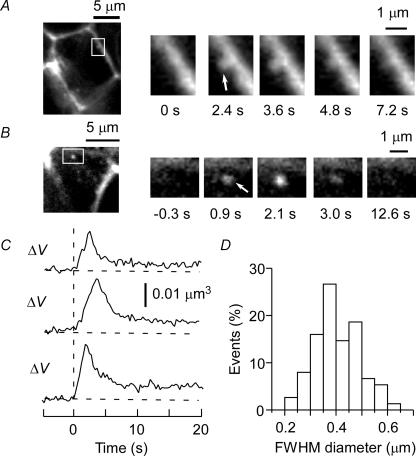
Individual insulin exocytic events were visualized by two-photon excitation microscopy in intact mouse pancreatic islets that were superfused with a solution containing the polar fluorescent tracer SRB (0.4 mm) and stimulated with 20 mm glucose. Consistent with our previous observations (Takahashi et al. 2002), glucose stimulation resulted in a rapid appearance of small spots of fluorescence at the plasma membrane of islet cells (Fig. 2A and B). Most (88%) of these spots gradually decayed within 20 s (Fig. 2C), reflecting full collapse of vesicles into the plasma membrane (Takahashi et al. 2002; Ma et al. 2004), as directly visualized in side views of the exocytic process (Fig. 2A).
Figure 2. Two-photon excitation imaging of exocytosis in pancreatic islets.
A and B, two examples of imaging of exocytosis with SRB. Full flattening of a vesicle (arrow) is apparent in the side view (A), whereas an exocytic event (arrow) is clearer in the front view (B) because of the reduced level of background fluorescence attributable to the horizontal and narrow intercellular space. The boxed regions in the large panels on the left are shown at higher magnification in the smaller panels. C, time courses of fluorescence during single exocytic events. The top and middle traces correspond to the events shown in A and B, respectively. ΔV represents the volume of the fluorescence profiles of exocytic vesicles calculated on the basis of the ΔV-TEPIQ analysis. D, histogram of FWHM diameters of exocytic vesicles (n = 75).
The diameter of the fluorescent spots ranged between 0.21 and 0.64 μm, with a mean value of 0.41 ± 0.09 μm (mean ±s.d., n = 75) (Fig. 2D) (Takahashi et al. 2002). This FWHM diameter did not directly reflect the actual diameter of insulin granules, given that it was close to the spatial resolution of our microscope (0.3 μm) and therefore not sensitive to the actual diameter of vesicles (Fig. 1, continuous line). We were thus not able to completely exclude the possibility that some exocytic events were mediated by small vesicles (Takahashi et al. 1997; Braun et al. 2004) rather than by large dense-core vesicles, although 70% of these events in beta-cells were positive for insulin immunoreactivity (Takahashi et al. 2002). We therefore sought a direct means to estimate the actual diameter of exocytic vesicles.
TEPIQ analysis of ΔV
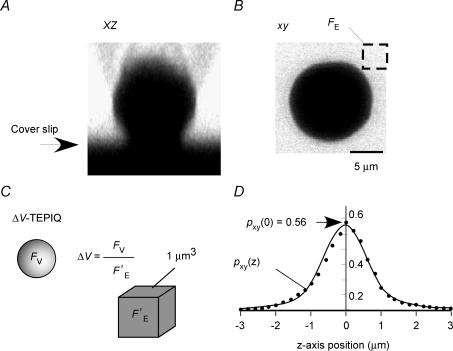
We developed TEP imaging-based quantification (TEPIQ) as an approach to estimate vesicle diameter with the use of polar tracers. We chose SRB as a fluid-phase tracer because it is small (molecular mass of 558 Da; diameter of 1.4 nm) and relatively insensitive to pH (the fluorescence intensity of SRB in solution was affected by < 3% by changes in pH between 5 and 8). We first measured the fluorescence of the external solution (Fig. 3A and B) and compared it with the increase in fluorescence due to the influx of the polar tracer through an open fusion pore into an exocytic vesicle (ΔV-TEPIQ analysis) (Fig. 3C). We assumed that the concentration of the fluorescent tracer in the exocytic vesicle is the same as that in the extracellular solution, given that SRB is small and highly polar, as is proved in this and the accompanying studies (Kishimoto et al. 2005; Liu et al. 2005). Since the vesicles tend to change their shapes after exocytosis, it is necessary to record exocytic events with high temporal resolution. We thus obtained time-lapse xy-images of the same focal plane rather than three-dimensional xyz-images. The xy-images therefore must be corrected for the efficiency of focal illumination along the z-axis (Fig. 3D; Appendix A).
Figure 3. TEPIQ analysis of ΔV.
A and B, fluorescence images (xz and xy, respectively) of a single β-cell on a cover slip immersed in a solution containing SRB (0.4 mm). C, the volume of an exocytic vesicle is estimated from the SRB fluorescence intensities for an exocytic event (FV) and for a unit volume of extracellular solution (F′E). D, an actual point spread function for a quantum dot (diameter of 5 nm) along the z-axis (•). The fluorescence intensity was normalized so that the total integral became 1.0. The smooth line is predicted by eqn (A17) in Appendix C.
The efficiency of focal illumination was estimated by a point spread function, p(x,y,z), for two-photon fluorescence with the use of a quantum dot. The point spread function was integrated for each xy-plane, pxy(z) (Fig. 3D), and normalized as follows:
| (1) |
It is important to note that two-photon excitation is inherently resistant to light scattering, and the point spread function does not change even within tissues (Dong et al. 2003), unlike a one-photon confocal microscope.
The efficiency of focal illumination, pxy(0), was thus estimated to be 0.56 (Fig. 3D). The volume of a vesicle can then be obtained from the total fluorescence of the vesicle (Fv) in an xy-image (Fig. 3C) as described in eqns (A6) and (A7) in Appendix A
| (2) |
where FE is the fluorescence intensity per unit area in an xy-image of a solution with an infinite depth, and F′E is the corrected fluorescence of the extracellular solution. The value of FE can be reliably estimated with a solution containing a known concentration of SRB (Fig. 3B). It depends on the parameters of image acquisition, such as the voltage of the photomultiplier, the incident laser power, and the speed of image acquisition, and thus should be obtained under the same conditions as those of the actual experiment. In our setup, FE was 99 445 ± 3114 arbitrary units (AU) μm−2) (n = 5).
We can readily convert the volume of a vesicle into the diameter of the vesicle (ΦV) assuming that the vesicle is spherical (d= 2r, where r is the vesicle radius) as:
| (3) |
Even though the vesicle is not spherical, the value gives the normalized diameter when the vesicle would be spherical, and actual sphericity of the vesicle is not a problem in TEPIQ analysis of ΔV.
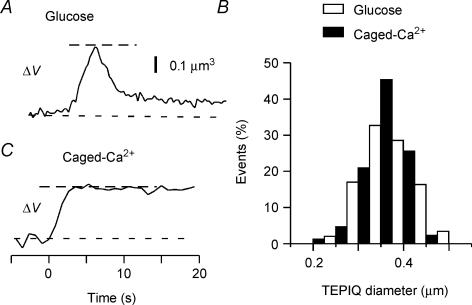
TEPIQ analysis of ΔV at the peak of fluorescence during glucose stimulation (Fig. 4A) yielded an estimate for the diameter of insulin vesicles as 0.35 ± 0.054 μm (n = 147) (Fig. 4B). The fluorescence of SRB might not reach a steady state, however, because of rapid flattening of vesicles during glucose stimulation. We therefore analysed the exocytic events induced by photolysis of the caged-Ca2+ compound NPE, for which vesicle flattening was markedly slower (Fig. 4C) (Takahashi et al. 2004). We obtained a similar value for mean vesicle diameter (0.37 ± 0.045 μm, n = 86) under this condition (Fig. 4B), indicating that the staining of vesicles virtually achieved a steady state during glucose stimulation. More precisely, the 5.7% larger mean diameter apparent during uncaging of NPE might reflect an 18% larger vesicle volume. Thus, in reality, a slight change in the vesicle shapes after exocytosis does not much affect the estimated vesicle diameters, and both estimates are consistent with those of the diameter of insulin granules determined by electron microscopy (Dean, 1973), supporting the assumption that the concentration of SRB in vesicles is similar to that in the external solution.
Figure 4. TEPIQ analysis of ΔV for exocytosis in pancreatic islets.
A and C, time courses of ΔV based on SRB fluorescence for exocytic events induced by glucose stimulation (A) or by uncaging of NPE (C). B, histograms of vesicle diameter obtained by ΔV-TEPIQ analysis of exocytosis induced by glucose (open bars, n = 147) or by uncaging of NPE (filled bars, n = 86).
TEPIQ analysis of ΔS
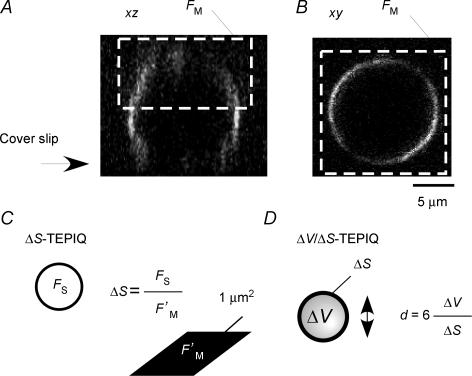
An alternative mode of TEPIQ analysis (ΔS-TEPIQ) is to determine the surface area of secretory vesicles by measurement of the total fluorescence of a cell in a solution containing FM1-43 as well as the increase in fluorescence attributable to exocytosis (Fig. 5A–C). We chose FM1-43 as a membrane tracer because it is water soluble and can be applied in the extracellular solution (Betz & Bewick, 1992). The fluorescence intensity of the plasma membrane in a solution containing FM1-43 was affected only slightly (< 6%) by changes in pH between 5 and 8. The surface area of a vesicle can be obtained from the total FM1-43 fluorescence of the vesicle (FS) in an xy-image and from that of the plasma membrane (F′M) in the focal plane (Fig. 5C) as described in eqn (A9) in Appendix B by:
| (4) |
where FM is obtained from the total fluorescence (FCell) of an xyz-image of an FM1-43-stained cell as FM=FCell/(4πR2) by eqn (A10) and where R is the radius of the cell.
Figure 5. TEPIQ analysis of ΔS and of ΔV/ΔS.
A and B, FM1-43 fluorescence images (xz and xy, respectively) of a single β-cell on a cover slip immersed in a solution containing SRB (0.4 mm) and FM1-43 (20 μm). Polarization of FM1-43 fluorescence in the plasma membrane is apparent. C, TEPIQ analysis of ΔS. The surface area of an exocytic vesicle is estimated from the FM1-43 fluorescence intensities both for the exocytic event (FS) and for a unit area of the membrane (F′M). The value of FM was obtained from the entire upper hemisphere represented by many xy-images along the z-axis (dashed white rectangles in A and B). D, TEPIQ analysis of ΔV/ΔS. The diameter (d) of an exocytic vesicle is estimated from the volume (ΔV) and membrane area (ΔS) of the vesicle, with the assumption that the vesicle is spherical.
The fluorescence images of FM1-43-stained beta-cells were affected by polarization of the excitation laser beam. The polarization is evident from the non-uniform fluorescence around the perimeter of the cells (Fig. 5A and B). For estimation of FM, it is therefore necessary to measure the fluorescence either of the entire surface or of one hemisphere of a β-cell. This approach ensures that FM1-43 orients in every direction, as it does in exocytic vesicles, and that the effect of polarization of excitation light is thereby normalized. Indeed, beta-cells are almost spherical, given that their membrane capacitance is well predicted from cell diameter (Takahashi et al. 1997). We used the upper hemisphere of beta-cells for estimation of FCell, given that it was free of extraneous material. We rapidly applied FM1-43 (20 μm) with a glass pipette so that the image could be acquired as quickly as possible (< 2 min), thereby avoiding substantial endocytic uptake of the dye. The value of FCell/2 was corrected for the z-interval (Δz) by multiplying it by Δz. We set Δz to 0.3 μm, which was sufficiently smaller than the axial resolution of 1.5 μm. The background fluorescence was measured from a control image without a cell and subtracted. In practice, ΔS-TEPIQ was performed together with ΔV/ΔS-TEPIQ analysis (see below), with the values of FE and FM being obtained in the presence of both tracers. In our setup, these values were 93 279 ± 2864 AU μm−2 and 4705 ± 677 AU μm−2 (n = 5), respectively, for beta-cells in a solution containing both 20 μm FM1-43 and 0.4 mm SRB (Fig. 5).
This in vivo calibration of FM is time-consuming and is not applicable to cells that are not spherical. An alternative approach is to measure the fluorescence intensity per unit area (FC) of FM1-43 (20 μm) dissolved in the detergent CHAPS (40 mm), given that the emission spectrum of FM1-43 in CHAPS is similar to that of FM1-43 in the plasma membrane. We found that the value of FM for beta-cells was related to FC by the equation FM=mCFC, where mC was 0.285 (Appendix B). Establishment of this relation for each type of cell then allows ΔS-TEPIQ to be calibrated readily from the fluorescence of the CHAPS solution in a manner similar to that by which FE is obtained. This conversion coefficient (mC) for beta-cells might prove applicable to other cell types as described (Kishimoto et al. 2005; Liu et al. 2005).
As in the case with ΔV-TEPIQ analysis, we can estimate the normalized diameter (d= 2r) of the vesicle by ΔS-TEPIQ analysis as:
| (5) |
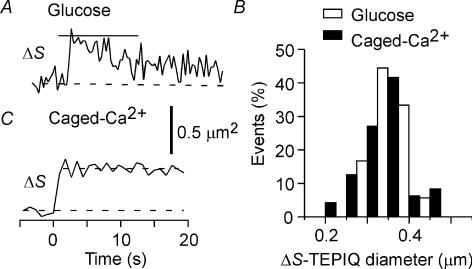
We performed TEPIQ analysis of ΔS at the peak of individual events, which yielded a mean vesicle diameter of 0.34 ± 0.039 μm (n = 36) for glucose stimulation and of 0.36 ± 0.059 μm (n = 48) for caged-Ca2+ stimulation (Fig. 6). The close match between vesicle diameters determined by ΔS-TEPIQ analysis and those determined by electron microscopy (Dean, 1973) suggests that FM1-43 selectively stains the membranes of vesicles in beta-cells, unlike in pituitary lactotrophs (Angleson et al. 1999). The similarity between vesicle diameters determined by ΔV-TEPIQ and by ΔS-TEPIQ suggests that insulin granules are virtually spherical.
Figure 6. TEPIQ analysis of ΔS for exocytosis in pancreatic islets.
A and C, time courses of ΔS based on FM1-43 fluorescence for single exocytic events induced by glucose stimulation (A) or by uncaging of NPE (C). B, histograms of vesicle diameter obtained by ΔS-TEPIQ analysis of exocytosis induced by glucose (open bars, n = 36) or by uncaging of NPE (filled bars, n = 48).
Although FM1-43 would also be expected to be present in the aqueous phase of vesicles, the fluorescence derived from such FM1-43 molecules is probably negligible compared with that of those in the membrane phase, because the fluorescence of FM1-43 in solution is estimated to be 1.7% of that in the plasma membrane (Henkel et al. 1996). Moreover, we estimated the density of FM1-43 molecules in the plasma membrane to be 9880 μm−2 (Appendix B), indicating that the number of FM1-43 molecules in the aqueous phase of a vesicle with a diameter of 0.4 μm is one-tenth of the number of those in the membrane phase, and that this fraction is even smaller for smaller vesicles. The fluorescence of FM1-43 in the aqueous phase is thus probably insignificant (< 0.17%) compared with that of the dye in the membrane phase. The fluorescence of FM1-43 is also dependent on membrane voltage, increasing by 3.4% per 100 mV (Smith & Betz, 1996). This property may affect estimates of membrane area by ΔS-TEPIQ analysis, but by only 3.4% at most. Finally, FM1-43 fluorescence is sensitive to the lipid environment (Zweifach, 2000); however, lipid mixing probably occurs immediately after exocytosis (Takahashi et al. 2002; Taraska & Almers, 2004), so that the lipid environment of vesicles is rapidly equilibrated with that of the plasma membrane.
ΔV/ΔS-TEPIQ analysis of exocytosis
TEPIQ analysis of ΔV or ΔS may underestimate vesicle size for two reasons. First, the laser beam is attenuated by the tissue, given that images were obtained ∼20 μm from the base of islets. Second, exocytosis might occur in non-focal planes, where fluorescence collection is less efficient (see Discussion). We therefore developed a third type of TEPIQ analysis, based on staining with both SRB and FM1-43. If we combine TEPIQ of ΔV and ΔS, vesicle diameter can be determined from:
| (6) |
given that
πr3/4πr2= 2r=d (Fig. 5C). The estimated diameter can also be expressed as:
| (7) |
TEPIQ analysis of ΔV/ΔS is insensitive to attenuation of the laser beam within tissue; given that the same laser is used for excitation of both tracers, such attenuation will result in the same reduction in the fluorescence of both SRB and FM1-43. TEPIQ analysis of ΔV/ΔS also minimizes the out-of-focus effect (see Discussion). Another advantage of TEPIQ analysis of ΔV/ΔS is that it does not depend on the calibration constant, pxy(0). A disadvantage of TEPIQ analysis of ΔV/ΔS is that it is highly dependent on the sphericity of the vesicle, becoming smaller when the vesicle is less spherical (see Discussion).
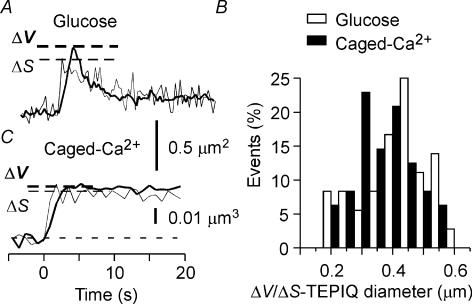
In double-labelling experiments, vesicles were stained more slowly with SRB than with FM1-43 during glucose-stimulated exocytosis (Fig. 7A), a phenomenon that reflects the slow dilatation of the fusion pore of insulin granules (Takahashi et al. 2002). When ΔV and ΔS were measured from the peaks of SRB and FM1-43 fluorescence, respectively, during glucose stimulation, ΔV/ΔS-TEPIQ yielded an estimate of vesicle diameter of 0.38 ± 0.107 μm (n = 36) (Fig. 7B). This estimate was not substantially affected by flattening of the granules during glucose stimulation, given that stimulation with the caged-Ca2+ compound yielded a value of 0.39 ± 0.092 μm (n = 48) (Fig. 7B and C). The use of the ratio of ΔV to ΔS gives rise to a larger variation (s.d.) in vesicle diameter than that obtained with TEPIQ analysis of ΔV or ΔS alone, possibly representing a major disadvantage of ΔV/ΔS-TEPIQ analysis. Despite this reservation, the vesicle diameters determined by ΔV/ΔS-TEPIQ analysis were similar to those determined by ΔV-TEPIQ and ΔS-TEPIQ, suggesting that the depth of exocytic events from the surface of the islet does not much affect the estimation of vesicle diameter. Indeed, the reduction in the fluorescence of SRB by one cell layer of an islet was only 17.0 ± 7.3% (n = 5) (Fig. 3A) and should result in a decrease of only 6% in the estimates of vesicle diameter. This slight shielding effect may underlie the smaller estimates of vesicle diameter in TEPIQ analysis of ΔV or ΔS than in that of ΔV/ΔS.
Figure 7. TEPIQ analysis of ΔV/ΔS for exocytosis in pancreatic islets.
A and C, time courses of single exocytic events induced by glucose stimulation (A) or by uncaging of NPE (C). Thick and thin lines are based on fluorescence intensities of SRB and FM1-43, respectively. B, histogram of vesicle diameter obtained by TEPIQ analysis of ΔV/ΔS for glucose stimulation (open bars, n = 36) or for uncaging of NPE (filled bars, n = 48).
Discussion
We have developed TEPIQ analysis to measure the diameters of exocytic vesicles within tissues and have confirmed the validity of this approach with islets of Langerhans. TEPIQ analysis revealed the mean diameter of vesicles to be 340–390 nm in the islets, consistent with the size of insulin granules determined by electron microscopy (Dean, 1973). Since the diameter is close to the resolution of our microscope, it cannot be unequivocally estimated with their FWHM diameters (Takahashi et al. 2002). Thus, this report has, for the first time, established that the most discrete fluorescent events revealed by TEP imaging in the islet represent exocytosis of large dense-core vesicles, but not that of small vesicles. TEPIQ analysis has also succeeded in estimating the diameters (55 nm, 90 nm and 220 nm) of smaller vesicles in PC12 cells (Kishimoto et al. 2005; Liu et al. 2005).
Sources of error in TEPIQ analysis
A possible source of error in the estimation of vesicle diameter by TEPIQ analysis is binding of the polar tracers (SRB and FM1-43) to vesicle contents. Although binding of FM1-43 to the vesicle contents was reported in a few preparations (Angleson et al. 1999; Gaisano et al. 2001), it should not be a general feature of FM1-43, since such binding has not been reported for synaptic vesicles, and we have never seen such signals in beta-cells (present study), PC12 cells (Kishimoto et al. 2005; Liu et al. 2005), pancreatic acinar cells (unpublished observations) and adrenal chromaffin cells (Brumback et al. 2004). Although binding of SRB to the contents of zymogen granules was reported in pancreatic acinar cells (Thorn & Parker, 2005), it may be particularly potent for zymogen granules because of protein condensation (Palade, 1975), since we did not find it in beta-cells, adrenal chromaffin cells or PC12 cells. Note that even a 50% error in estimation of volume, or pxy(0), would result in only a 14% error in the TEPIQ diameter of vesicles. The relatively small error would not be a problem, if the major purpose of TEPIQ analysis is to distinguish between small and large dense-core vesicles (Kishimoto et al. 2005; Liu et al. 2005), which differ more than four times in diameters.
Attenuation of the excitation laser beam within tissue is another potential source of error, but it should not affect TEPIQ analysis of ΔV/ΔS. We thus found that such attenuation was not marked for TEPIQ analysis of ΔV or ΔS in our islet preparations, in which we examined mostly the second or third cell layers within 20 μm of the surface. When TEPIQ analysis is applied at cell layers deeper than 20 μm from the surface, we need to consider absorption of fluorescence by tissue and extracellular tracers. Such absorption may be overcome by appropriate calibration experiments in vivo.
TEPIQ analyses of ΔV and ΔS measures the volume and surface area of a vesicle, and give the normalized diameter of a vesicle when it would be spherical. The normalized diameter is a valuable parameter, even if the vesicle is actually not spherical. In contrast, TEPIQ analysis of ΔV/ΔS critically relies on the sphericity of vesicles. The estimation of diameter based on the TEPIQ analysis of ΔV/ΔS should therefore be confirmed by EM analysis. This was performed for beta-cells and PC12 cells (Kishimoto et al. 2005; Liu et al. 2005), which demonstrated that exocytic vesicles were nearly spherical in large dense-core vesicles of beta-cells and PC12 cells and small vesicles in PC12 cells. Interestingly, we have also succeeded in estimating the diameter of constitutive endocytic vesicles and ‘kiss-and-run’ endocytic vesicles with TEPIQ analysis of ΔV/ΔS (Liu et al. 2005), which frequently merged with large non-spherical endosomes. This indicates that the TEPIQ diameter of an endocytic vesicle represents the diameter of the vesicle when the fission pore closes, and that it is not affected by merger of the vesicle to other organelles, provided that fluorescence intensities of individual SRB and FM1-43 molecules are the same after merger.
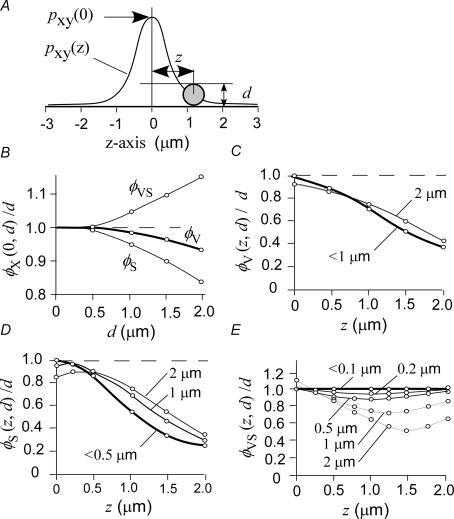
If there is no binding of tracers, and no absorption of excitation and emission lights, errors in the estimation of vesicle diameter can be predicted with the use of a realistic point spread function (Appendix C) for spherical vesicles with a diameter of d and a deviation from the focal plane of z (Fig. 8A). For a vesicle with a diameter of < 1 μm that is precisely in focus, errors in the estimation are < 10% for all three types of TEPIQ analysis (Fig. 8B). If the centre of the vesicle is > 0.5 μm away from the focal plane, the error becomes > 20% in ΔV- or ΔS-TEPIQ analysis (Fig. 8C and D), but it remains < 14% at any distance from the focal plane in ΔV/ΔS-TEPIQ analysis so long as the vesicle diameter is < 0.5 μm (Fig. 8E). These evaluations are consistent with our results in beta-cells and indicate that, unlike the FWHM approach, TEPIQ analysis is applicable to any vesicle with a diameter of < 0.5 μm even when the position of the vesicle deviates slightly (< 0.5 μm) from the focal plane. TEPIQ analysis thus has the potential to identify types of vesicles (for example, small vesicles versus large dense-core vesicles) involved in exocytosis in imaging studies.
Figure 8. Errors in the estimation of vesicle diameter by TEPIQ analysis.
A, schematic illustration of the point spread function along the z-axis and of a spherical vesicle with a diameter of d and z-axis position of z. B, Errors in the estimation by ΔV-TEPIQ (φV), ΔS-TEPIQ (φS), or ΔV/ΔS-TEPIQ (φVS) analysis of the size of vesicles with an actual diameter of d that are positioned in the focal plane (z= 0). C–E, errors in the estimation by ΔV-TEPIQ (C), ΔS-TEPIQ (D), or ΔV/ΔS-TEPIQ (E) analysis of the size of vesicles at the z-axis position of z and with the indicated diameters. ○ in B to E indicate the points that were numerically estimated with eqns(A12)–(A14).
Advantages of TEPIQ analysis and TEP imaging
TEPIQ analysis is insensitive to the characteristics of the microscope system, such as the properties of the objective lens, the bandwidth of the mode-locked laser, and the sensitivities of the photomultipliers, because calibration experiments can be performed with the same setup as that used for the actual experiments. Calibration of ΔV-TEPIQ analysis can be routinely carried out with the external solution while performing experiments on exocytosis. In contrast, calibration of ΔS-TEPIQ analysis requires single spherical cells, a requirement that cannot be met for all cell types. Furthermore, such in vivo calibration is also prone to experimental error. Instead, it is possible to replace the in vivo calibration of FM with measurement of the fluorescence of a solution containing FM1-43 and CHAPS by using the conversion coefficient (mC≈ 0.29).
TEPIQ analysis of ΔV/ΔS has four major advantages over that of ΔV or ΔS alone, although its estimates of vesicle diameter show a higher variation (s.d.). First, it is more resistant to the deviation of vesicles from the focal plane (Fig. 8). Second, it yields precise estimates of vesicle diameter independently of excitation laser power and is therefore applicable to exocytosis occurring deep within a tissue. Third, it does not depend on the parameter pxy(0) of the objective lens (eqn (6)). Finally, it can be applied even to exocytosis en masse, without resolution of single exocytic events, so long as an increase in fluorescence caused by exocytosis can be measured (Kishimoto et al. 2005; Liu et al. 2005). This latter characteristic reflects the fact that TEPIQ analysis of ΔV/ΔS relies on the SRB/FM1-43 fluorescence ratio, not on the absolute values of fluorescence. It should even be possible to measure the diameter of endocytic vesicles without interference from vesicle acidification after closure of the fission pore (Liu et al. 2005), given that both SRB and FM1-43 are relatively insensitive to pH.
We have thus shown that it is possible with TEP imaging to label post-fusion vesicles in secretory tissues and to measure the diameter of such vesicles at nanometer resolution by TEPIQ. Moreover, TEP imaging allows one to monitor post-fusion events, including collapse of the vesicle membrane (Takahashi et al. 2002), sequential exocytosis (Nemoto et al. 2001, 2004; Takahashi et al. 2004; Thorn et al. 2004; Oshima et al. 2005; Kishimoto et al. 2005), closure of fusion pores (Takahashi et al. 2002; Kishimoto et al. 2005; Liu et al. 2005), and translocation of endocytic vesicles from the plasma membrane to the cytosol (Liu et al. 2005). In contrast, evanescent-field microscopes illuminate only the superficial region of a cell and are incapable of tracking the fates of exocytic vesicles and of estimating vesicle diameter (Steyer et al. 1997; Oheim et al. 1999; Becherer et al. 2003). One-photon confocal imaging excites fluorescent probes throughout the entire depth of a preparation and results in photobleaching and heat generation (Duncan et al. 2003). As a result, extracellular polar tracers are not applicable to one-photon confocal imaging when vesicles are small and require a high concentration of tracers for visualization of their exocytosis.
The highly quantitative nature of TEP imaging and TEPIQ analysis is attributable to the combination of the narrow intercellular spaces of intact tissues, the extracellular application of polar tracers (Takahashi et al. 2002; Nemoto et al. 2001), and two-photon imaging (Denk et al. 1990). Two-photon imaging allows the use of the high concentrations of polar tracers that are necessary to reveal fine cellular structures, given that the tracer molecules outside of the focal plane are not excited and the generation of heat and phototoxic effects due to tracer activation are therefore greatly reduced. In addition, the reduction in the intensity of excitation light caused by the inner filter effect of high concentrations of multiple polar tracers is avoided in TEP imaging (Takahashi et al. 2002). Given that the intercellular space is narrower than the size of vesicles, the signal-to-noise ratio is large, and the change in fluorescence caused by exocytosis or endocytosis can be reliably measured. Furthermore, the fact that fluorescent tracers are applied from outside allows the use of any kind of probe that does not penetrate the plasma membrane. TEP imaging also allows control of the state and concentration of tracers, and, in contrast to transfection with vectors for fusion constructs of green fluorescent protein, tracers are able to stain the preparations immediately and should have little effect on exocytosis. Another unique aspect of TEP imaging is that photobleaching of tracers in the focal plane is effectively compensated for by the diffusion of tracer molecules from outside of the focal plane. Given that all exocytic events can be measured without selection bias, TEPIQ analysis is as quantitative as is measurement of membrane capacitance. Moreover, two-photon excitation is inherently resistant to light scattering in tissue preparations (Dong et al. 2003) and allows excitation of multiple tracers simultaneously with a single laser source as a result of the broader two-photon excitation spectra (Xu et al. 1996). This latter property enables simultaneous multicolour imaging with little chromatic aberration; such imaging is essential for multicolour ratiometric TEPIQ analysis, which generates the ratios of two images and which is able to estimate the diameter of vesicles (6ΔV/ΔS) even when vesicles are moving and individual exocytic events are not optically resolved.
In summary, once calibration for TEPIQ analysis has been established for a certain preparation, TEP imaging can be used to analyse the structural dynamics of exocytosis of vesicles of known diameter. Particularly, TEP imaging can be used to selectively study exocytosis of large dense-core and small vesicles (Kishimoto et al. 2005; Liu et al. 2005). Unlike other approaches, TEP imaging allows the study of exocytic events at narrow intercellular spaces, which constitute the majority of physiological exocytosis. The molecular mechanisms of exocytosis can also be investigated by simultaneous multicolour TEP imaging together with genetically encoded tracers (Takahashi et al. 2004; Nemoto et al. 2004).
Acknowledgments
We thank T. Kise, T. Suzuki and N. Takahashi for technical assistance. This work was supported by Grants-in-Aid from the Ministry of Education, Culture, Sports, Science, and Technology of Japan and by research grants from the Human Frontier Science Program Organization, NIH and the Takeda Science Foundation.
Appendix A
ΔV-TEPIQ analysis
To estimate the volume of a vesicle from its fluorescence in an xy-image, we considered a normalized point spread function for a microscope, p(x,y,z), that fulfils
| A1 |
If fluorescent molecules are spatially distributed according to F(x,y,z) and the x′y′ scanning was performed at the focal plane (z= 0), the total fluorescence is given by:
 |
A2 |
Integration over the x′- and y′-axes yields:
| A3 |
where pxy(z) is the point spread function along the z-axis defined by:
| A4 |
which satisfies eqn (1). For a small vesicle at the focal plane with a volume of V
| A5 |
If the vesicle has a homogeneous fluorescence density of F, eqn (A3) predicts the total fluorescence of the vesicle (Fv) in an xy-image as:
 |
A6 |
Equation (A3) also gives the fluorescence (FE) per unit area of an xy-image of the solution with a homogeneous fluorescence density, F, and with an infinite depth as:
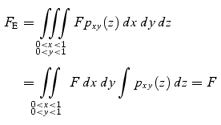 |
A7 |
The volume of the vesicle can be obtained from eqns (A6) and (A7) as eqn (2), where F′E=FEpxy(0) and is the corrected fluorescence of the extracellular solution, which reflects the virtual fluorescence of a solution with a thickness of 1 μm and a volume of 1 μm3 emitting fluorescence along the z-axis at a density of FEpxy(0).
Appendix B
ΔS-TEPIQ analysis
For estimation of FM, we used an entire hemisphere of a β-cell, in which FM1-43 orients in all directions as in exocytic vesicles, so that the effect of polarization of excitation light is normalized. The surface area (S) of a vesicle or cell with a radius of R is expressed as:
| A8 |
when the membrane thickness (T) is small and u2=x2+y2+z2. If the vesicle is at the focal plane and has a homogeneous fluorescence density per membrane area of FM, eqns (A3) and (A8) predict the total fluorescence of the vesicle (FS) in an xy-image as:
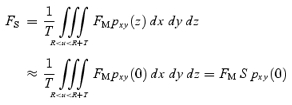 |
A9 |
The membrane area of vesicles can therefore be estimated by eqn (4). With eqns (1), (A3) and (A8), the value of FM is obtained from the total fluorescence of a spherical cell (FCell) in an xyz-image as:
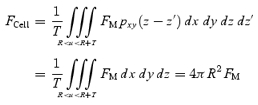 |
A10 |
This calibration for FM should be performed under the same conditions as those for the actual experiments; we estimated FM with a solution containing both FM1-43 (20 μm) and SRB (0.4 mm). The conversion coefficient (mC) in the presence of FM1-43 (20 μm) and SRB (0.4 mm) was 0.285 ± 0.041 (5 cells). The number of FM1-43 molecules (NF) in the plasma membrane within a unit area (1 μm2) is obtained with the use of mC and
| A11 |
where kC and kM are the fluorescence intensities of FM1-43 in CHAPS and in the plasma membrane, respectively; CF represents the molar equivalent of FM1-43 in the solution with a volume of 1 μm3; and NA is Avogadro's constant (6.02 × 10²³ mol−1). The value of kC/kM (1/0.35) was obtained by dividing the fluorescence of FM1-43 (0.5 μm) in a CHAPS solution by that in a solution containing excess plasma membrane (1000 bovine chromaffin cells per microlitre) (Takahashi et al. 2002). An estimate of 9880 FM1-43 molecules per square micrometer was thus obtained for the plasma membrane at 20 μm FM1-43. This value is more precise than the former estimate of 12 000 (Takahashi et al. 2002) because we now use the fluorescence of an entire hemisphere of a cell to determine FM.
Appendix C
Potential errors in TEPIQ analysis
For a vesicle with a diameter of d(= 2r) and its centre at a distance z from the focal plane, the diameter is predicted by ΔV-TEPIQ, ΔS-TEPIQ or ΔV/ΔS -TEPIQ analysis as:
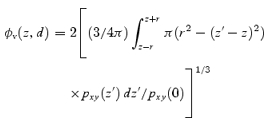 |
A12 |
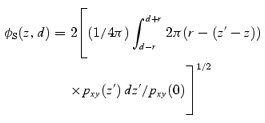 |
A13 |
or
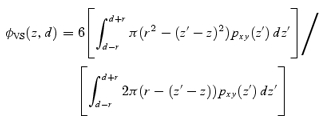 |
A14 |
respectively. To determine the errors in these estimations, we used a theoretical point spread function, which fits well with the actual point spread function (Fig. 3D) and which is obtained by paraxial approximation in a cylindrical coordinate (Xu & Webb, 1996) as:
 |
A15 |
where kr= 2πnA/λ; kz= 2πn2A/(nλ); nA, n, λ, and i represent the numerical aperture of the objective lens, the refractive index of water (1.33), the wavelength of the excitation laser, and the unit of ideal number, respectively; J0 is the Bessel function of the first kind; and B is the constant for normalization (∼59.049) given by:
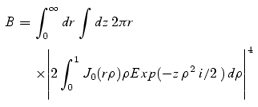 |
A16 |
Integration in a cylindrical coordinate gives:
| A17 |
The value (0.565) of pxy(0) obtained from the actual point spread function (Fig. 3D) is close to the value (0.557) of pxy(0) predicted from the paraxial approximation in eqn (A17) with nA and λ set to 1.0 and 830 nm, respectively. Numerical evaluation was made with the use of Mathematica5.0 (Wolfram Research, Champaign, IL, USA) software (Fig. 8B–E, circles).
Approximation of the point spread function with a Gaussian function yielded:
| A18 |
where σz is the standard deviation of the Gaussian function for z-axis resolution and
was previously referred to as the thickness of the image (Takahashi et al. 2002). We found, however, that the Gaussian approximation gives an estimate for pxy(0) (0.63 = 1/
) that is slightly larger than that given by the paraxial approximation.
Appendix D
Relation between FWHM and actual diameters
The fluorescence profile of vesicles in the focal plane along the x-axis with a diameter of d (= 2r) in an x′y′-image is given by:
| A19 |
The FWHM diameter is obtained by finding a value for 2x that fulfils F(x,d) =F(0, d)/2. If the point spread function given by eqn (A15) is used, lateral and axial FWHM resolutions are predicted to be 0.306 and 1.4 μm, respectively (Fig. 1), continuous line), which are close to the actual values of 0.32 and 1.5 μm obtained with a 5 nm quantum dot. The actual FWHM diameters of fluorescent beads with diameters 0.282, 0.748 and 0.977 μm were also measured (Fig. 1, squares). These values were similar to, but slightly larger than, the theoretical estimates, probably because of a lens effect of the polystyrene beads caused by a refractive index different from that of water.
References
- Angleson JK, Cochilla AJ, Kilic G, Nussinovitch I, Betz WJ. Regulation of dense core release from neuroendocrine cells revealed by imaging single exocytic events. Nat Neurosci. 1999;2:440–446. doi: 10.1038/8107. [DOI] [PubMed] [Google Scholar]
- Avery J, Ellis DJ, Lang T, Holroyd P, Riedel D, Henderson RM, Edwardson JM, Jahn R. A cell-free system for regulated exocytosis in PC12 cells. J Cell Biol. 2000;148:317–324. doi: 10.1083/jcb.148.2.317. [DOI] [PMC free article] [PubMed] [Google Scholar]
- Becherer U, Moser T, Stuhmer W, Oheim M. Calcium regulates exocytosis at the level of single vesicles. Nat Neurosci. 2003;6:846–853. doi: 10.1038/nn1087. [DOI] [PubMed] [Google Scholar]
- Betz WJ, Bewick GS. Optical analysis of synaptic vesicle recycling at the frog neuromuscular junction. Science. 1992;255:200–203. doi: 10.1126/science.1553547. [DOI] [PubMed] [Google Scholar]
- Braun M, Wendt A, Birnir B, Broman J, Eliasson L, Galvanovskis J, Gromada J, Mulder H, Rorsman P. Regulated exocytosis of GABA-containing synaptic-like microvesicles in pancreatic beta-cells. J General Physiol. 2004;123:191–204. doi: 10.1085/jgp.200308966. [DOI] [PMC free article] [PubMed] [Google Scholar]
- Brumback AC, Lieber JL, Angleson JK, Betz WJ. Using FM1-43 to study neuropeptide granule dynamics and exocytosis. Methods. 2004;33:287–294. doi: 10.1016/j.ymeth.2004.01.002. [DOI] [PubMed] [Google Scholar]
- Dean PM. Ultrastructural morphometry of the pancreatic beta-cell. Diabetologia. 1973;9:115–119. doi: 10.1007/BF01230690. [DOI] [PubMed] [Google Scholar]
- Denk W, Strickler JH, Webb WW. Two-photon laser scanning fluorescence microscopy. Science. 1990;248:73–76. doi: 10.1126/science.2321027. [DOI] [PubMed] [Google Scholar]
- Dong CY, Koenig K, So P. Characterizing point spread functions of two-photon fluorescence microscopy in turbid medium. J Biomed Opt. 2003;8:450–459. doi: 10.1117/1.1578644. [DOI] [PubMed] [Google Scholar]
- Duncan RR, Greaves J, Wiegand UK, Matskevich I, Bodammer G, Apps DK, Shipston MJ, Chow RH. Functional and spatial segregation of secretory vesicle pools according to vesicle age. Nature. 2003;422:176–180. doi: 10.1038/nature01389. [DOI] [PubMed] [Google Scholar]
- Gaisano HY, Lutz MP, Leser J, Sheu L, Lynch G, Tang L, Tamori Y, Trimble WS, Salapatek AM. Supramaximal cholecystokinin displaces Munc18c from the pancreatic acinar basal surface, redirecting apical exocytosis to the basal membrane. J Clin Invest. 2001;108:1597–1611. doi: 10.1172/JCI9110. [DOI] [PMC free article] [PubMed] [Google Scholar]
- Henkel AW, Lubke J, Betz WJ. FM1-43 dye ultrastructural localization in and release from frog motor nerve terminals. Proc Natl Acad Sci U S A. 1996;93:1918–1923. doi: 10.1073/pnas.93.5.1918. [DOI] [PMC free article] [PubMed] [Google Scholar]
- Kasai H, Takagi H, Ninomiya Y, Kishimoto T, Ito K, Yoshida A, Yoshioka T, Miyashita Y. Two components of exocytosis and endocytosis in PC12 cells studied using caged-Ca2+ compounds. J Physiol. 1996;494:53–65. doi: 10.1113/jphysiol.1996.sp021475. [DOI] [PMC free article] [PubMed] [Google Scholar]
- Kishimoto T, Liu T-T, Kishimoto T, Hatakeyama H, Nemoto T, Takahashi N, Kasai H. Sequential compound exocytosis of large dense-core vesicles in PC12 cells studied with TEPIQ (two-photon extracellular polar-tracer imaging-based quantification) analysis. J Physiol. 2005;568:905–915. doi: 10.1113/jphysiol.2005.094003. [DOI] [PMC free article] [PubMed] [Google Scholar]
- Liu T-T, Kishimoto T, Hatakeyama H, Nemoto T, Takahashi N, Kasai H. Exocytosis and endocytosis of small vesicle in PC12 cells studied with TEPIQ (two-photon extracellular polar-tracer imaging-based quantification) analysis. J Physiol. 2005;568:917–929. doi: 10.1113/jphysiol.2005.094011. [DOI] [PMC free article] [PubMed] [Google Scholar]
- Ma L, Bindokas VP, Kuznetsov A, Rhodes C, Hays L, Edwardson JM, Ueda K, Steiner DF, Philipson LH. Direct imaging shows that insulin granule exocytosis occurs by complete vesicle fusion. Proc Natl Acad Sci U S A. 2004;101:9266–9271. doi: 10.1073/pnas.0403201101. [DOI] [PMC free article] [PubMed] [Google Scholar]
- Nemoto T, Kimura R, Ito K, Tachikawa A, Miyashita Y, Iino M, Kasai H. Sequential-replenishment mechanism of exocytosis in pancreatic acini. Nat Cell Biol. 2001;3:253–258. doi: 10.1038/35060042. [DOI] [PubMed] [Google Scholar]
- Nemoto T, Kojima T, Oshima A, Bito H, Kasai H. Stabilization of exocytosis by dynamic F-actin coating of zymogen granules in pancreatic acini. J Biol Chem. 2004;279:37544–37550. doi: 10.1074/jbc.M403976200. [DOI] [PubMed] [Google Scholar]
- Oheim M, Loerke D, Chow RH, Stuhmer W. Evanescent-wave microscopy: a new tool to gain insight into the control of transmitter release. Philos Trans R Soc Lond B Biol Sci. 1999;354:307–318. doi: 10.1098/rstb.1999.0382. [DOI] [PMC free article] [PubMed] [Google Scholar]
- Oshima A, Kojima T, Dejima K, Hisa I, Kasai H, Nemoto T. Two-photon microscopic analysis of acetylcholine-induced mucus secretion in guinea pig nasal glands. Cell Calcium. 2005;37:349–357. doi: 10.1016/j.ceca.2004.12.003. [DOI] [PubMed] [Google Scholar]
- Palade G. Intracellular aspects of the process of protein synthesis. Science. 1975;189:347–358. doi: 10.1126/science.1096303. [DOI] [PubMed] [Google Scholar]
- Smith CB, Betz WJ. Simultaneous independent measurement of endocytosis and exocytosis. Nature. 1996;380:531–534. doi: 10.1038/380531a0. [DOI] [PubMed] [Google Scholar]
- Steyer JA, Horstmann H, Almers W. Transport, docking and exocytosis of single secretory granules in live chromaffin cells. Nature. 1997;388:474–478. doi: 10.1038/41329. [DOI] [PubMed] [Google Scholar]
- Takahashi N, Hatakeyama H, Okado H, Miwa A, Kishimoto T, Kojima T, Abe T, Kasai H. Sequential exocytosis of insulin granules is associated with redistribution of SNAP25. J Cell Biol. 2004;165:255–262. doi: 10.1083/jcb.200312033. [DOI] [PMC free article] [PubMed] [Google Scholar]
- Takahashi N, Kadowaki T, Yazaki Y, Miyashita Y, Kasai H. Multiple exocytotic pathways in pancreatic β cells. J Cell Biol. 1997;138:55–64. doi: 10.1083/jcb.138.1.55. [DOI] [PMC free article] [PubMed] [Google Scholar]
- Takahashi N, Kishimoto T, Nemoto T, Kadowaki T, Kasai H. Fusion pore dynamics and insulin granule exocytosis in the pancreatic islet. Science. 2002;297:1349–1352. doi: 10.1126/science.1073806. [DOI] [PubMed] [Google Scholar]
- Taraska JW, Almers W. Bilayers merge even when exocytosis is transient. Proc Natl Acad Sci U S A. 2004;101:8780–8785. doi: 10.1073/pnas.0401316101. [DOI] [PMC free article] [PubMed] [Google Scholar]
- Thorn P, Fogarty KE, Parker I. Zymogen granule exocytosis is characterized by long fusion pore openings and preservation of vesicle lipid identity. Proc Natl Acad Sci U S A. 2004;101:6774–6779. doi: 10.1073/pnas.0400336101. [DOI] [PMC free article] [PubMed] [Google Scholar]
- Thorn P, Parker I. Two phases of zymogen granule lifetime in mouse pancreas: ghost granules linger after exocytosis of contents. J Physiol. 2005;563:433–442. doi: 10.1113/jphysiol.2004.077230. [DOI] [PMC free article] [PubMed] [Google Scholar]
- Tsuboi T, Terakawa S, Scalettar BA, Fantus C, Roder J, Jeromin A. Sweeping model of dynamin activity. Visualization of coupling between exocytosis and endocytosis under an evanescent wave microscope with green fluorescent proteins. J Biol Chem. 2002;277:15957–15961. doi: 10.1074/jbc.C200051200. [DOI] [PubMed] [Google Scholar]
- Xu C, Webb WW. Measurement of two-photon excitaiton cross sections of molecular fluorophores with data from 690 to 1050 nm. J Opt Soc Am B. 1996;13:481–491. [Google Scholar]
- Xu C, Zipfel W, Shear JB, Williams RM, Webb WW. Multiphoton fluorescence excitation: new spectral windows for biological nonlinear microscopy. Proc Natl Acad Sci U S A. 1996;93:10763–10768. doi: 10.1073/pnas.93.20.10763. [DOI] [PMC free article] [PubMed] [Google Scholar]
- Zweifach A. FM1-43 reports plasma membrane phospholipid scrambling in T-lymphocytes. Biochem J. 2000;349:255–260. doi: 10.1042/0264-6021:3490255. [DOI] [PMC free article] [PubMed] [Google Scholar]


