

Abstract
Novel measures of coding based on interspike intervals were used to characterize the responses of supraoptic cells to osmotic stimulation. Infusion of hypertonic NaCl in vivo increased the firing rate of continuous (putative oxytocin) cells (Wilcoxon z = 3.84, P = 0.001) and phasic (putative vasopressin) cells (z = 2.14, P = 0.032). The irregularity of activity, quantified by the log interval entropy, was decreased for continuous (Student's t = 3.06, P = 0.003) but not phasic cells (t = 1.34, P = 0.181). For continuous cells, the increase in frequency and decrease in entropy was significantly greater (t = 2.61, P = 0.036 and t = 3.06, P = 0.007, respectively) than for phasic cells. Spike patterning, quantified using the mutual information between intervals, was decreased for phasic (z = −2.64, P = 0.008) but not continuous cells (z = −1.14, P = 0.256). Although continuous cells showed similar osmotic responses to mannitol infusion, phasic cells showed differences: spike frequency decreased (z = −3.70, P < 0.001) and entropy increased (t = −3.41, P < 0.001). Considering both cell types together, osmotic stimulation in vitro using 40 mm NaCl had little effect on firing rate (z = −0.319, P = 0.750), but increased both entropy (t = 2.75, P = 0.010) and mutual information (z = −2.73, P = 0.006) in contrast to the decreases (t = 2.92, P = 0.004 and z = −2.40, P = 0.017) seen in vivo. Responses to less severe osmotic stimulation with NaCl or mannitol were not significant. Potassium-induced depolarization in vitro increased firing rate (r = 0.195, P = 0.034), but the correlation with decreased entropy was not significant (r = −0.097, P = 0.412). Intracellular recordings showed a small depolarization and decrease in input resistance during osmotic stimulation with NaCl or mannitol, and membrane depolarization following addition of potassium. Differences in responses of oxytocin and vasopressin cells in vivo, suggest differences in the balance between the synaptic and membrane properties involved in coding their osmotic responses. The osmotic responses in vivo constrasted with those seen in vitro, which suggests that, in vivo, they depend on extrinsic circuitry. Differences in responses to osmolality and direct depolarization in vitro indicate that the mechanism of osmoresponsiveness within a physiological range is unlikely to be fully explained by depolarization.
It is widely accepted that osmotic stimulation is associated with an increase in the firing rates of the magnocellular neurones of the supraoptic nucleus (Brimble & Dyball, 1977). The increase in mean spike frequency is often attributed to a combination of local effects. These include a decreased glial release of taurine to disinhibit supraoptic neurones (Hussy et al. 2000) and an intrinsic osmosensitivity of magnocellular neurones (Mason, 1980) due to a depolarization mediated by stretch-sensitive cation channels that are opened by cell shrinkage (Oliet & Bourque, 1993). However, consideration of firing rates alone neglects aspects of spike patterning that may be essential in potentiating neurohormone release (Dutton & Dyball, 1979). Such spike patterns may be modulated by glutamatergic afferents from outside the supraoptic nucleus (Nissen et al. 1995). Novel measures of coding irregularity and patterning, based on information theory applied to the interspike intervals, have been recently introduced (Bhumbra & Dyball, 2004). Such approaches have shown that important aspects of the physiological responses to osmotic stimulation are neglected when firing rates alone are considered (Bhumbra et al. 2004).
In the present study, we have used two measures of spike coding in addition to mean spike frequency. The entropy of the probability distribution of the log interspike intervals quantifies their variability, and the mutual information between adjacent log interspike intervals measures the extent of the occurrence of spike motifs. By musical analogy, if the frequency provides the key of the scale, the log interval entropy quantifies the timbre of the notes that can be played by a particular musical instrument, and the mutual information quantifies the ordering of notes that constitute a tune. Frequency, entropy and mutual information all convey different information and can vary independently as one cannot be inferred simply from another (Bhumbra & Dyball, 2004, 2005). A tune sounds different when played on a different musical instrument but may be readily recognized regardless of the key in which it is played.
Spike patterns are important in neurohypophysial physiology. It has been known for some years that peptide release from the neurohypophysis can be influenced by the patterns of the spikes that propagate to the secretory terminals (Dutton & Dyball, 1979; Cazalis et al. 1985). Although the mechanisms responsible for the differences are unclear, patterned spike clustering modifies the excitability of neurohypophysial axons (Dyball & McKenzie, 2000). The changes may result from a sustained increase in intracellular calcium at the neurosecretory terminals that follows an alteration in spike activity. We have also shown recently that burst stimulation alters the excitability of adjacent hypothalamic axons (Inyushkin & Dyball, 2004) and the increased excitability is probably mediated by local changes in potassium concentration. Increased excitability may be important if short bursts of spikes can alter the likelihood of their propagation to axon terminals to influence the release process.
In this paper, we show differences between continuous and phasic cell responses to hypertonic infusion in vivo that may indicate that the balance between stochastic influences (such as the activity of inputs) and deterministic factors (such as the membrane properties of the cell) involved in coding osmotic responses is different for the two cell types. Osmotic responses of continuous cells to sodium and mannitol were similar but the responses differed for phasic cells. Sodium-induced increases in osmolality in vivo and in vitro showed contrasting responses, suggesting that osmotic responses in vivo cannot be explained solely by intrinsic osmosensitivity of supraoptic neurones or glia. We also show differences between the responses to sodium-induced increases in osmolality and potassium-induced depolarization in vitro. Intracellular studies in vitro confirmed the presence of a small but significant membrane depolarization following osmotic stimulation with sodium and mannitol. We conclude that within a physiological range, the osmoresponsiveness of magnocellular neurones is unlikely to be fully explained by their depolarization and must depend largely on inputs to supraoptic cells.
Methods
Male Wistar rats were used to record from supraoptic cells. They were housed under a 12 h light–12 h dark regimen with food and water provided ad libitum. All experiments were carried out in accordance with the Animals (Scientific Procedures) Act (UK) 1986.
Surgery and recording in vivo
Rats weighing between 250 g and 300 g were used for in vivo recordings and housed under a 12 h light−12 h dark regimen for at least 14 days before each experiment. Animals were anaesthetized with urethane at a dose of 1.1 g kg−1i.p. The jugular vein was cannulated and a tracheostomy was performed. Using the ventral surgical approach (Leng & Dyball, 1991), the supraoptic nucleus and pituitary stalk were exposed. Extracellular recordings (with glass micropipettes containing 0.5 m sodium acetate) were used to record single units, and magnocellular neurosecretory cells were identified by antidromic activation from the pituitary stalk (Yagi et al. 1966), confirmed by the two-shock collision test. Putative oxytocin and vasopressin secreting cells were distinguished by their ‘continuous’ and ‘phasic’ firing patterns (Poulain & Wakerley, 1982), respectively (see Discussion).
Recorded signals were pre-amplified then filtered using a 50-Hz noise eliminator (Hum Bug; Quest Scientific, North Vancouver, Canada). The signal was then amplified and passed through an interface device (1401 Plus; Cambridge Electronic Design, Cambridge, UK) to a computer. Spike 2 V4 (Cambridge Electronic Design) software was used to collect the waveform signal that was sampled at 20 kHz. After recording spontaneous activity for at least 15 min, hypertonic saline (1 m NaCl) was infused i.v. at a rate of 52 μl min−1 for 30 min. Such an infusion would give rise to an increase of about 10 mm NaCl in the 30-min period and represents a severe but not extreme osmotic stimulus as cells appear to be able to respond systematically to a stimulus with a far greater intensity (Leng et al. 2001). In a separate set of experiments, double molar quantities of mannitol were infused over the same period to provide a similar osmotic stimulus. For cells recorded during infusion, excerpts of recording of at least 5 min including at least 500 spikes were used for data analysis; the excerpts were taken immediately before and immediately after the period of infusion. For cells that were recorded before or after infusion, periods of stable recording of at least 5 min including at least 500 spikes were used for data analysis.
Spikes were discriminated off-line using custom software (Dyball & Bhumbra, 2003) and single-unit analysis was undertaken as previously described (Bhumbra & Dyball, 2004). Briefly, the mean spike frequency was calculated, and the statistical entropy (Shannon & Weaver, 1949) of the log interval histogram was used as a measure of spike irregularity. Spike patterning was quantified using the mutual information between adjacent log intervals by constructing a joint interval histogram (Rodieck et al. 1962) on a logarithmic scale and applying information theory (Bhumbra & Dyball, 2004). Group comparisons were undertaken using Student's t test statistics for normally distributed results. The Wilcoxon rank sum test was used for data that were not normally distributed.
Recording in vitro
Rats weighing between 75 g and 150 g were used for in vitro recordings and housed under a 12 h light−12 h dark regimen for at least 7 days before each experiment. Animals were anaesthetized with urethane at a dose of 1.1 g kg−1i.p. Following decapitation, the brains were excised, and a vibrating microtome (Series 1000; Horwell Instruments, St Louis, MO, USA) was used to cut sagittal slices 500 μm thick through the supraoptic nucleus. Slices were transferred to the recording chamber and perfused with artificial cerebrospinal fluid (aCSF) oxygenated with 95% oxygen−5% carbon dioxide. The composition of the aCSF was (mm): NaCl 124, KCl 3, KH2PO4 1.24, CaCl2 2.1, MgSO4 1.3, NaHCO3 24 and glucose 10 (Cui et al. 1997). The recording chamber was maintained at 32.8°C. Extracellular recordings were made using glass electrodes with a tip diameter of approximately 0.5 μm, filled with 0.9% NaCl to give a tip resistance of approximately 10 MΩ.
The data acquisition hardware and protocols were identical to those used in vivo, except that the minimum time allowed for each recording was 5 min, beginning at least 5 min after the start of the recording or after any change in extracellular osmolality or potassium concentration, to ensure stable conditions. After the spontaneous activity of each cell had been recorded in normal aCSF, the neurones were osmotically stimulated by the addition of 40 mm NaCl to the aCSF. To investigate changes in spike discharge to smaller changes in osmolality, some cells were also tested by the addition of 10, 20 and 40 mm NaCl. Mannitol was also used as an alternative osmotic stimulus, and cell responses were tested at concentrations of 20, 40 or 80 mm to provide a similar osmotic challenge. For the depolarization experiments, cells were depolarized by increments of potassium concentration. The extent of the increase in extracellular potassium concentration (Δ[K+]o) from the initial concentration ([K+]o) was used to estimate the degree of depolarization ΔE, based on their interrelation given by a formula derived (Bhumbra et al. 2005) from the Nernst equation:
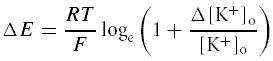 |
where R is the ideal gas constant (8.3143 J mol−1 K−1), T is the absolute temperature (306 K), and F is Faraday's constant (96485 C mol−1).
Spike analysis was undertaken as previously described for the recordings in vivo. Group comparisons to assess the effects of osmotic stimulation were made using Student's t test statistics for paired data for normally distributed results; otherwise, the Wilcoxon signed rank test was used. Statistical associations between the data and the different levels of depolarization were tested using Pearson's moment or Spearman's rank correlation coefficients, depending on whether or not the data were normally distributed, respectively.
For experiments in which sharp electrode intracellular recordings were made during osmotic stimulation, the composition of the aCSF was slightly different, containing 2.4 mm CaCl2 and 26 mm NaHCO3. We recorded with pipettes filled with a solution that contained 4 m potassium acetate and with a resistance of approximately 100 MΩ. Impalement occurred by advancing the electrode through the slice with a piezoelectric microdrive (Nanostepper, List-Medical, Darmstadt, Germany) and recordings were amplified using an amplifier with a bridge circuit (Axoprobe 1A, Axon Instruments). As for the experiments using extracellular electrodes, osmotic stimulation was undertaken by the addition of 40 mm NaCl to the aCSF.
Whole-cell intracellular recordings were also made during periods of osmotic stimulation and potassium-induced depolarization. The composition of the aCSF was identical to that used for the extracellular experiments and the solution used to fill the pipettes contained (mm): potassium gluconate 130, KCl 10, MgCl2 1, CaCl2 1, EGTA 5, Hepes (free acid) 10 and ATP (dipotassium salt) 4; the pH was adjusted to 7.3 with KOH. The tip resistance was in the range 3–10 MΩ. During the periods of osmotic stimulation and potassium-induced depolarization, the experimental protocols were identical to those used for the extracellular recordings.
In addition to experiments in which osmolality was raised by sodium, we made some whole cell recordings while 80 mm mannitol was added to raise the osmolality of the bathing solution. In these experiments the osmolality of the aCSF as measured by a freezing-point osmometer (Camlab, Roebling Micro-osmometer), was raised from 313 to 397 mosmol kg−1. This value was similar to the value of 394 mosmol kg−1 seen in the experiments with sodium.
Results
Osmotically induced changes in spike activity in vivo
Before osmotic stimulation, the firing activity of continuous and phasic cells was similar to that previously described (Bhumbra & Dyball, 2004), with greater spike patterning for the phasic cell group. Simple ratemeter recordings of spike activity during intravenous infusion of hypertonic saline show that continuous and phasic cells responded to osmotic stimulation in vivo (Fig. 1). The ratemeter record of a representative continuous cell (Fig. 1A) showed that there was an increase in firing rate that occurred uniformly during the period of hypertonic infusion. A similar ratemeter record of a single phasic cell (Fig. 1D) showed an increased firing rate with a concomitant change from phasic firing to a more continuous pattern.
Figure 1. Continuous and phasic cells respond differently to osmotic stimulation in vivo.

A, shows a ratemeter record, with a 1-s bin width, of a continuous cell during a 30-min infusion of 1 m NaCl at a rate of 52 μl min−1. B and C, show 5-s excerpts taken from A at the times indicated, before (Control) and after (NaCl) hypertonic infusion. Values for mean spike frequency (MSF), log interval entropy (ENT) and mutual information (MUT) are included. Although the firing rate for the continuous cell was greater in C than B, the interval variability was smaller. D–F, show equivalent plots for a phasic cell recorded before, during and after a similar infusion, illustrating an increase in mean spike frequency, a small decrease in entropy and a substantial decrease in mutual information.
The ratemeter responses of phasic cells (Fig. 2B–L) to an identical infusion of hypertonic saline were variable. The cells in Fig. 2B–F showed a clear increase in firing rate but other individual cells showed either very little response (Fig. 2G–J) or inhibition (Fig. 2K and L) during the infusion of hypertonic saline and a very similar rate after the infusion as before it.
Figure 2. While both continuous and phasic cells respond to osmotic stimulation in vivo, the responses of phasic cells were highly variable.

A, illustrates a ratemeter record that shows that an infusion of hypertonic saline increased the mean spike frequency (MSF) of a single representative continuous cell. B–F, the phasic cell responses show a clear increase in firing rate, but other individual cells showed either very little response (G–J) or inhibition (K and L) during the infusion of hypertonic saline, and a very similar rate after the infusion as before it. ‘Infusion’ marks in the time of the 30-min infusion of 1 m NaCl.
The grouped data (Fig. 3) confirmed the homogeneity of continuous cell responses and the relatively more heterogeneous responses of phasic cells to osmotic stimulation with sodium chloride. Before the hypertonic infusion, 50 continuous cells and 68 phasic cells were recorded, whereas 48 continuous cells and 51 phasic cells were recorded after the infusion. Continuous cells showed a clear increase in mean spike frequency (z = 3.84, P < 0.001, Fig. 3A), whereas the increase in firing rate of phasic cells was significant (z = 2.14, P = 0.032, Fig. 3B) but at a lower level.
Figure 3. Continuous and phasic cells show differences in their responses to osmotic stimulation in vivo.

Before the hypertonic infusion of NaCl, 50 continuous cells and 68 phasic cells were recorded, whereas 48 continuous cells and 51 phasic cells were recorded after the infusion. Where the distributions passed the normality test, means ±s.e.m. are represented; otherwise box and whiskers plots are shown (a box and whiskers plot represents the median as a single line with a box to indicate the interquartile range; the whiskers represent the furthest data values within one and a half times the interquartile range away from the lower and upper quartile, and outliers are marked as crosses). Continuous (A) cells showed an obvious increase in mean spike frequency following NaCl infusion (z = 3.84, P < 0.001). The increase in firing rate of phasic (B) cells was significant (z = 2.14, P = 0.032) but at a lower level. Osmotic stimulation with NaCl significantly reduced the log interval entropy of continuous (C) cells (t = 3.06, P = 0.003) but not phasic (D) cells (t = 1.34, P = 0.181). For phasic (F) cells, NaCl significantly decreased the mutual information (z = −2.64, P = 0.008), but did not do so for continuous (E) cells (z = −1.14, P = 0.256). Osmotic stimulation with mannitol was tested in 39 continuous cells and 53 phasic cells. The effects of mannitol infusion on continuous cells were similar to those of NaCl. Mannitol infusion was associated with an increase (A) in firing rate (z = 2.21, P = 0.027), a decrease in (C) entropy (t = 2.64, P = 0.009) and had little effect (E) on mutual information (z = −0.816, P = 0.415). The responses of phasic cells to mannitol were different from those following sodium infusion. Mannitol infusion was associated with a decrease (B) in firing rate (z = −3.70, P < 0.001), an increase (D) in entropy (t = −3.41, P < 0.001) and a decrease (F) in mutual information (z = −2.10, P = 0.036).
Mean spike frequency was, however, not the only parameter of activity that changed during osmotic stimulation. Osmotic stimulation reduced the irregularity of spike activity of continuous cells. This is illustrated in Fig. 1 by the two sections of trace (B and C) taken from the cell used to illustrate the ratemeter response in Fig. 1A. The excerpts suggest a reduced variability in interval duration following osmotic stimulation. The entropy of the probability distribution of the log intervals was used to quantify the variability reflected by the disorder represented in the interspike interval histogram (Bhumbra & Dyball, 2004). For the continuous cells as a group (Fig. 3C), osmotic stimulation significantly reduced the log interval entropy (t = 3.06, P = 0.003), whereas the reduction in entropy seen in the phasic cells (Fig. 3D) did not approach statistical significance (t = 1.34, P =0.181).
To establish whether there were significant differences in the responses of continuous and phasic cells to osmotic stimulation, the changes in the activity of cells recorded continuously before and after the hypertonic infusion were compared. Both continuous (n = 9) and phasic (n = 11) cells showed changes in firing rate. However, the increase in mean spike frequency of the continuous cells (4.37 ± 0.50 Hz; mean ±s.e.m.) was greater than that of the phasic cells (1.93 ± 0.88 Hz), and a t test confirmed a statistically significant difference (t = 2.61, P = 0.036). The decrease in the entropy for the continuous cells (0.284 ± 0.051 bits) was also greater that the reduction in the entropy for the phasic cells (0.069 ± 0.048 bits) at a high level of significance (t = 3.06, P = 0.007). Both continuous and phasic cells thus clearly responded to osmotic stimulation but the responses were different for the two cell types.
Short sections of trace from the phasic cell illustrated in Fig. 2B (see Fig. 1E and F) showed little change in the interspike interval variability but osmotic stimulation with NaCl appeared to reduce the tendency of spikes to occur in groups as patterned motifs. The mutual information between the adjacent log intervals was used to quantify the extent of spike patterning, represented by the average shared information between the intervals either side of each spike (Bhumbra & Dyball, 2004). For the phasic cells (Fig. 3F), osmotic stimulation significantly decreased the mutual information (z = −2.64, P = 0.008), whereas the reduction in mutual information seen for the continuous cells (Fig. 3E) did not approach statistical significance (z = −1.14, P = 0.256). Figures 1 and 2 show that the effects of sodium chloride infusions were progressive and that there were no step changes in, for example, firing frequency. After 15 min of infusion, the firing frequency of most cells was intermediate between that before and after the infusion.
Osmotic stimulation by infusing mannitol was accompanied by similar changes in the firing of 39 continuous cells to those seen after sodium chloride infusion (Fig. 3). Mannitol infusion was associated with an increase in firing rate (z = 2.21, P = 0.027, Fig. 3A), a decrease in entropy (t = 2.64, P = 0.009, Fig. 3C) and little effect on mutual information (z = −0.816, P = 0.415, Fig. 3E). For the group of 53 phasic cells (Fig. 3), the responses to mannitol were different from those following sodium infusion. Mannitol infusion was associated with a decrease in firing rate (z = −3.70, P < 0.001, Fig. 3B), an increase in entropy (t = −3.41, P < 0.001, Fig. 3D), and a decrease in mutual information (z = −2.10, P = 0.036, Fig. 3F).
Osmotically induced changes in spike activity in vitro
The ratemeter records in Fig. 4 show examples of the responses of supraoptic cells recorded in vitro during increases of 40 mm NaCl to raise the osmolality of the aCSF. Hypertonic stimulation in vitro resulted in both increases (Fig. 4A and D) and decreases (Fig. 4B and E) in mean spike frequency, and some cells (Fig. 4C) showed changes in firing pattern. The responses were heterogeneous and showed no consistent effect of increased osmolality on the firing rate of supraoptic cells.
Figure 4. Osmotic stimulation by increasing the NaCl concentration in the aCSF by 40 mM had no consistent effect on mean spike frequency of supraoptic cells recorded in vitro.

A–E, represents a ratemeter trace recorded before, during and after osmotic stimulation. The hypertonic solution was applied during the period indicated by ‘NaCl’. Osmotic stimulation in vitro resulted in both increases (A and D) and decreases (B and E) in mean spike frequency, and some cells (C) showed changes in firing pattern.
Figure 5 summarizes the grouped data values for the mean spike frequency, entropy and mutual information for the 30 supraoptic cells recorded in vitro. For comparison, the figure also represents the grouped data for the continuous and phasic cells recorded in vivo as a single data set, with 118 cells represented before the hypertonic infusion, and 99 neurones after the infusion. No attempt was made to separate continuous and phasic cells for this figure because phasic firing in vitro may not distinguish reliably between putative oxytocin and vasopressin cells (Bhumbra & Dyball, 2004).
Figure 5. Responses to osmotic stimulation in vivo differed from those seen in vitro.

Before the hypertonic infusion of NaCl, 118 cells were recorded in vivo and 99 were recorded after the infusion whereas the number of cells tested in vitro was 30; no distinction was made between continuous and phasic cells. Where the distributions passed the normality test, means ±s.e.m. are represented; otherwise box and whiskers plots are shown. Osmotic stimulation in vivo significantly (z = 4.07, P < 0.001) increased (A) the mean spike frequency whereas the firing rate in vitro (B) was not significantly affected (z = −0.319, P = 0.750). The irregularity of activity, as measured by the log interval entropy, was decreased (C) in vivo (t = 2.92, P = 0.004) and increased (D) in vitro (t = 2.75, P = 0.010). Spike patterning, quantified using the mutual information between adjacent intervals, was decreased (E) in vivo (z = −2.40, P = 0.017) whereas the mutual information (F) in vitro was increased (z = −2.73, P = 0.006).
Osmotic stimulation in vivo significantly (z = 4.07, P < 0.001) increased the firing rate of the combined group of cells (Fig. 5A) whereas the mean spike frequency of cells recorded in vitro (Fig. 5B) was not significantly affected (z = −0.319, P = 0.750). The irregularity of activity, as measured by the log interval entropy, was decreased in vivo (Fig. 5C) by the hypertonic infusion of NaCl (t = 2.92, P = 0.004). The entropy in vitro (Fig. 5D) was also significantly affected (t = 2.75, P = 0.010) but an increase was observed in contrast to the decrease seen in vivo. Spike patterning, quantified using the mutual information between adjacent intervals, was decreased in vivo (Fig. 5E) by the hypertonic infusion of NaCl (z = −2.40, P = 0.017), whereas the mutual information in vitro (Fig. 5F) was increased (z = −2.73, P = 0.006).
To establish whether there were significant differences in the responses of supraoptic cells for the two preparations, the changes in the activity in those cells recorded throughout the hypertonic infusion were compared for the in vivo (n = 20) and in vitro (n = 30) groups. The increase in mean spike frequency of the cells recorded in vivo (3.03 ± 0.59 Hz) was greater than that of the cells recorded in vitro (0.08 ± 0.20 Hz), and a t test confirmed a statistically significant difference (t = 7.18, P < 0.001). The decrease in the entropy seen in vivo (0.17 ± 0.04 bits) was also greater than that seen in vitro (−0.24 ± 0.09 bits), and a significant difference was confirmed (t = 2.59, P < 0.006). Supraoptic cells recorded both in vivo and in vitro thus clearly responded to osmotic stimulation but the nature of the responses was different for the two preparations.
Figures 4 and 5 illustrate that increasing the osmotic pressure of the aCSF bathing the supraoptic nucleus had no obvious consistent effect on spike frequency. To determine the effects of less severe stimuli, a comparison also was made between the effects of osmotic stimulation induced by progressive addition of NaCl or mannitol to the aCSF on the firing of supraoptic cells recorded extracellularly in vitro. Figure 6 illustrates that addition of 20, 40 and 80 mm mannitol and addition of 10, 20 and 40 mm sodium chloride had a variable effect on firing rate. Grouped data (n = 6 for both mannitol and NaCl) showed no obvious and consistent effect on log interval entropy and mutual information using a one-way ANOVA and Kruskal–Wallis test, although with a large sample size, the log interval entropy increased significantly following the addition of 40 mm NaCl (Fig. 5).
Figure 6. Graded osmotic stimulation of supraoptic neurones in vitro showed no consistent effect on firing rate.

Three representative responses are illustrated showing activity, before, during and after the administration of NaCl (A and B) and mannitol (C). The responses were variable. The effects of osmotic stimulation on spike activity showed increases (A), decreases (B), and minimal changes (C) in firing rate.
Depolarization-induced changes in spike activity in vitro
A comparison of the effects of depolarization and osmotic stimulation on spike activity in vitro was made by comparing the effects of sodium-induced osmotic stimulation and raised extracellular potassium. Figure 7A and B shows ratemeter records of two supraoptic cells recorded in vitro, illustrating increases in firing rate for the potassium-induced depolarization steps. For the first cell (Fig. 7A), the washout initially silenced the cell before the firing returned to its original rate. The second cell (Fig. 7B) was not silenced by the washout but the firing rate showed a partial recovery. Similar ratemeter records are shown for two different supraoptic neurones (Fig. 7C and D) that were first tested by an increase in aCSF NaCl concentration of 40 mm. For the first cell (Fig. 7C), both osmotic stimulation and depolarization increased the mean spike frequency although the increase following raised osmolality was not sustained. While the firing rate of the second cell (Fig. 7D) was increased by potassium-induced depolarization, the effects of raising osmolality were transient. The cell showed a period of silence on washout in both cases.
Figure 7. Ratemeter records show that graded depolarization produced by progressive increases in extracellular potassium concentration increased the mean spike frequency of supraoptic cells in vitro but osmotic stimulation did not consistently increase firing rate.

For the first cell (A), the washout initially silenced the cell before a rapid restoration to the original firing rate whereas the second cell (B) was not silenced by the washout but the firing rate showed a partial recovery. The cells represented in C and D were first tested by an increase in aCSF osmolality by the addition of 40 mm NaCl before depolarization. For the cell represented in C, both osmotic stimulation and depolarization increased the mean spike frequency whereas the cell represented in D showed little effect or even a reduction in mean spike frequency during the osmotic stimulation; during the washout periods following both osmotic stimulation and potassium-induced depolarization, the cell transiently ceased firing before a full recovery.
Altogether, 21 cells were tested in vitro for the effects of potassium-induced depolarization. Increased depolarization (Fig. 8A) was correlated with an increase in mean spike frequency (r = 0.195, P = 0.034). The negative correlation between the extent of depolarization and the entropy (Fig. 8B) was not significant (r = −0.097, P = 0.412). There was a strong negative correlation (r = −0.854, P < 0.001) between mean spike frequency and entropy (Fig. 8D) and a significant positive correlation between the extent of depolarization and the information rate (r = 0.197, P = 0.0326). However, there was no significant correlation (r = −0.180, P = 0.267) between adjacent log intervals (Fig. 8C), depolarization and spike patterning as measured by the mutual information between adjacent log intervals (Fig. 8C).
Figure 8. Depolarization in vitro was associated with a significant increase in firing rate but with little effect on spike irregularity or patterning.

Altogether, 21 cells were tested in vitro for the effects of depolarization. Where the distributions passed the normality test, means ±s.e.m. are represented; otherwise box and whiskers plots are shown. Group numbers are represented at the top of each column. Increased depolarization was correlated with an increase in mean spike frequency (A, r = 0.195, P = 0.034) but not entropy (B, r = −0.097, P = 0.412) or mutual information (C, r = −0.180, P = 0.267). A scatter plot of entropy against mean spike frequency (D) showed a strong negative correlation (r = −0.854, P < 0.001).
Intracellularly recorded changes in membrane potential in vitro
We also made a small number (n = 4) of sharp electrode intracellular recordings from magnocellular cells. To confirm that each recorded supraoptic cell was a magnocellular neurosecretory cell, injection of a positive current of 400 pA with a pulse width of 250 ms was applied to activate the potassium A current (seen as a ‘notch’ in the initial rise of the depolarization) and spike broadening during the rapid burst of action potentials (Fig. 9). All cells showed a small depolarization (∼3 mV) when the osmolality of the aCSF was increased by the addition of 40 mm NaCl.
Figure 9. Intracellular sharp electrode recordings from magnocellular supraoptic cells in vitro showed a slight depolarization and a decrease in membrane resistance during osmotic stimulation.

A, shows a 15-min excerpt of a recording on a long time scale indicating the time during which osmolality was raised (‘NaCl’); the spikes have been truncated and hyperpolarizing current injections of −200 pA were applied for 250 ms every second. The cell was depolarized to a small degree (3 mV) by increasing the osmolality of the aCSF by raising sodium by 40 mm. Three 4-s excerpts taken from A at the times marked a, b and c, show in B that membrane resistance decreased at the same time as the membrane depolarized. To confirm that each recorded supraoptic cell was a magnocellular neurosecretory cell, injection of a positive current of 400 pA with a pulse width of 250 ms was applied (at the time indicated in A by the open arrow) to activate the potassium A current (seen as a ‘notch’ on the rising phase of the depolarization in C marked by the filled arrow) and spike broadening was observed during the rapid burst of spikes. Full replacement of the aCSF in the recording chamber was completed 100 s after the times indicated.
Whole-cell recordings of cells were also undertaken in vitro during periods of osmotic stimulation and potassium-induced depolarization. Both sodium (Fig. 10A) and potassium (Fig. 10B) depolarized the membrane. The 40 mm increase in sodium produced a depolarization of approximately 3 mV. An increase of extracellular potassium from +2.45 mm to +3.28 mm produced a similar depolarization (3 mV). During the washout period, following the last increment, there was a partial recovery reflected by a decrease in membrane potential of 7 mV.
Figure 10. Whole-cell current-clamp recordings from magnocellular supraoptic cells in vitro showed that the addition of both sodium and potassium depolarized the membrane.

A, shows a 30-min excerpt of a recording on a long time scale indicating the time during which osmolality was raised (‘NaCl’); the spikes have been truncated and current injections of −15 pA were applied for 250 ms every 4 s. Three 16-s excerpts taken from A at the times marked a, b and c are illustrated in the expanded panels to show that the cell was depolarized to a small degree (3 mV) by increasing the osmolality of the aCSF by raising sodium by 40 mm. B, shows a 30-min excerpt of a recording from the same cell showing the periods during which the potassium concentration was increased by the amounts indicated. The excerpts taken from B at the times marked d, e, and f show that each increment of potassium caused a progressive depolarization, with the last increment showing a depolarizing change in membrane potential comparable to that seen during the hypertonic infusion (3 mV). During the washout period, following the last increment (+ 3.28 mm), there was a partial recovery reflected by a decrease in membrane potential of 7 mV. Full replacement of the aCSF in the recording chamber was completed 100 s after the times indicated.
Figure 11 summarizes the grouped data for the 11 cells recorded in vitro using whole-cell patch electrodes as extracellular potassium was raised. The raw data shown in Fig. 11A of the recorded membrane potential during the increments of extracellular potassium was used to plot the measured depolarization against the estimated depolarization based on the Nernst equation (Fig. 11B). The data (n = 60) showed a strong positive correlation (r = 0.682, P < 0.001). Linear regression showed that the slope of 1.19, with a 95% confidence interval of 0.81–1.57, did not significantly differ from one (t = 0.121, P = 0.904). This suggested that it was justified to use the Nernst equation to estimate the change in membrane potential.
Figure 11. Grouped data for the whole-cell recordings from magnocellular supraoptic cells in vitro showed that the addition of sodium (40 mM), potassium (0.51–3.26 mM) and mannitol (80 mM) produced a significant depolarization.

A, shows a graph of the membrane potential against the increase in potassium concentration for the 11 cells and B, shows a graph of the change in membrane potential against the estimated depolarization. The distribution of the data (n = 60) showed a strong positive correlation (r = 0.682, P < 0.001). C, illustrates the changes in membrane for seven cells before (‘Control’), during (‘NaCl’) and following (‘Washout’) osmotic stimulation by the addition of 40 mm NaCl to the aCSF and D, shows the extent of depolarization under the three conditions. The membrane was significantly depolarized during osmotic stimulation by NaCl when compared to the control period (t = −2.80, P = 0.031). For the cells tested during osmotic stimulation with mannitol (n = 6), there was a significant depolarization compared to the control period (1.2 ± 0.3 mV; t = 4.86, P = 0.005, paired t test). The difference, although smaller than the depolarization in response to NaCl, was not significant (t = 1.31, P = 0.216).
Figure 11C shows the membrane potentials for the seven cells before, during and after osmotic stimulation by the addition of 40 mm NaCl to the aCSF. The depolarization produced by osmotic stimulation is represented in Fig. 11D and shows a significant depolarizing change compared to both control (t = −2.80, P = 0.031) and washout (t = 4.05, P = 0.006) periods. The average (n = 7) increase in membrane potential was 2.59 ± 0.92 mV. In addition to the experiments in which osmotic pressure was raised by NaCl, we made six whole-cell recordings while the osmolality of the bathing solution was raised by adding 80 mm mannitol (Fig. 11E). Figure 11F shows the change in membrane potential before, during and after the addition of 80 mm mannitol. After osmotic stimulation, there was a mean depolarization of 1.23 ± 0.25 mV (t = 4.86, P = 0.005, paired t test). The difference, although smaller than the depolarization in response to NaCl, was not statistically significant (t = 1.31, P = 0.216).
It is possible that the stimulation of supraoptic cells by increases in extracellular potassium in vitro may have resulted from the excitation of remaining inputs in the slice rather than by direct depolarization. To investigate the contribution of synaptic effects, whole-cell recordings with identical step changes in potassium concentration were undertaken in four cells perfused with an aCSF that was modified to block synaptic activation with a high concentration (9 mm) of magnesium and a low concentration (0.5 mm) of calcium (Yamashita et al. 1991). The membrane potential was plotted against the increase in potassium concentration for the normal (n = 60) and synaptically blocked (n = 18) recordings. An analysis of covariance (ANOCOVA) test (available in the MathWorks MATLAB 6.1 Statistical Toolbox) confirmed that there was no significant difference between the slopes of the two groups (F= 0.320, P = 0.575). Glutamatergic block using 6,7-dinitro-quinoxaline-2,3-dione (DNQX) (10 μm) produced similar results (n = 13, F= 0.980, P = 0.324). This suggests that it was justified to attribute increases in membrane potential in the slice preparation in vitro to direct potassium-induced depolarization of the recorded cell rather than neurotransmitter release.
Discussion
Differences in responses of oxytocin and vasopressin cells in vivo
Sabatier et al. (2004) stated that phasic firing is accepted as ‘a reliable indicator that the cell is a vasopressin cell’ although the continuously firing group will probably contain some vasopressin cells. Following osmotic stimulation, cells that do fire phasically show a significantly smaller increase in frequency than continuously firing cells. We have also shown that cells that fire phasically show a significantly smaller decrease in entropy than continuous cells in response to osmotic stimulation. Thus cells characterized by accepted criteria as having one phenotype show genuinely different behaviour from that of a population that is potentially heterogeneous. The heterogeneity can only have blurred the difference. A more direct validation might have been useful but would not alter the argument.
The infusion of hypertonic solution used to elicit the responses represented a relatively severe osmotic challenge, but is consistent with the modest end of the stimulus range used by other investigators (see e.g. Leng et al. 2001) and Figs 1 and 2 show that the effects of sodium chloride infusions were progressive. There were no abrupt changes in firing frequency so that after 15 min of infusion, the firing frequency of most cells was intermediate between that before and after the infusion. The modest increase in mean spike frequency of phasic cells is consistent with earlier observations (Brimble & Dyball, 1977) that the increase in firing rate seen in response to sodium chloride was greater for oxytocin than for vasopressin cells. The difference between the responses of oxytocin and vasopressin cells may have arisen because of the heterogeneity of the population of vasopressin cells in which a proportion did not respond.
Changes in the shape of the interval histogram may provide some insight into the possible mechanisms underlying the physiological consequences of the passage of the spikes to the axon terminals (i.e. peptide release). On a logarithmic time scale, the frequency dependence of the dispersion of the interval histogram due to their mathematical relationship is removed. It has been shown empirically (Bhumbra & Dyball, 2004) and proved theoretically (Bhumbra & Dyball, 2005) that the log interval entropy is independent of frequency. It is thus useful to consider the effects of changes in the membrane properties on the relative differences between intervals. For a cell that is predominantly influenced by the effects of noisy synaptic inputs, the spike activity will be mostly affected by underlying stochastic (random) events that occur on its dendrites rather than the more deterministic (non-random) properties of the channel proteins of the cell membrane that influence the profile of the after-hyperpolarization potential and depolarizing afterpotential. Hence the log interval entropy provides a method for quantifying the balance between stochastic and deterministic factors that affect spike firing in a manner that is independent of frequency.
For the continuous cells, but not phasic cells, the entropy per spike decreased significantly following hypertonic saline infusion. This suggests that osmotic stimulation of the oxytocin cells, but not vasopressin cells, increased the contribution of deterministic factors rather than stochastic factors in influencing spike activity. A simple reduction in the difference between the resting membrane potential and threshold, might increase the relative contribution of deterministic factors on spike activity at the expense of stochastic factors. Depolarization may be a consequence of decreased glial release of taurine to disinhibit supraoptic neurones (Hussy et al. 2000) or a direct effect of osmotic stimulation on stretch-inactivated channels (Oliet & Bourque, 1993), or a combination of both. However, depolarization of the perikaryon may also result from an increased number of depolarizing synaptic events occurring randomly.
By contrast, the mechanism underlying the response of vasopressin cells is unlikely to be explained by simple depolarization alone because the hypertonic saline infusion had little or no effect on entropy. The maintained irregularity of the vasopressin cell activity may be explained by the channel properties that are intrinsically different for oxytocin and vasopressin cells (Stern & Armstrong, 1995). Osmotically inactivated stretch-sensitive cation channels may be different in oxytocin and vasopressin cells but previous investigations (Oliet & Bourque, 1993) did not distinguish between the two cell types as all magnocellular cells tested appeared to be of a similar type. However, afferent projections to oxytocin and vasopressin cells are very likely to differ because oxytocin cells show characteristic bursts during milk-ejection reflexes whereas the activity of vasopressin cells appears to remain unchanged (Lincoln & Wakerley, 1974). The differences in the osmotic responses of oxytocin and vasopressin cells to NaCl infusions may thus be due to differences in the nature of their inputs (Bhumbra et al. 2004). The differences between the responses of the continuous and phasic cells to mannitol infusions provide further evidence for such differences in their inputs.
One of the most striking features of the ratemeter records shown in Fig. 2 is that individual vasopressin cells did not show an obviously uniform type of response to osmotic stimulation. As all, rather than selected, recordings of vasopressin cells that were made during the hypertonic infusion are shown in Fig. 1, the range of the response types illustrated is likely to represent the response of the population of vasopressin cells in the supraoptic nucleus as a whole. Previous work suggested that osmotic stimulation is associated with an increase in the overall firing rate of vasopressin cells. During acute stimulation, the intervals between bursts became shorter, and the activity became more continuous (Brimble & Dyball, 1977). The bursts also became shorter and had a higher firing frequency during chronic stimulation (Dyball & Pountney, 1973). Here we have shown that during acute stimulation, the range of osmotic responses is more heterogeneous than might have been expected from the earlier reports that were based on averaged firing frequency alone. Perhaps unexpectedly, some of the cells showed a decrease in overall firing rate although the grouped data in Fig. 3B show a significant increase in mean spike frequency in response to sodium chloride-induced osmotic stimulation. The magnitude of the increase was, however, modest (from 6.21 Hz to 7.55 Hz using medians), which probably reflects the heterogeneity of vasopressin cell responses.
An obvious effect of the hypertonic sodium infusion on vasopressin cell activity in vivo was the highly significant reduction in patterning as measured by the mutual information between adjacent log intervals. This represents a decrease in the non-random ordering of intervals or, in other words, a reduction in the occurrence of repeating sequences of spikes, or spike ‘motifs’. As the precise nature of the relationship between spike patterning and hormone release has not yet been characterized, its physiological relevance has not yet been fully established. The decrease in mutual information was, however, highly significant (z = −2.64, P = 0.008).
Both oxytocin and vasopressin cell groups were recorded from the same rats and the substantial sizes of the data sets (minimum group size, 48) make it unlikely that the values for the mutual information were distorted, through sampling error, only for the vasopressin cell group. While previous stimulation experiments (Dutton & Dyball, 1979; Cazalis et al. 1985) controlled for the number of spikes and stimuli, differences in the profile of the interstimulus interval histograms were not taken into account. In the present study, the entropy for the vasopressin cells was little affected by hypertonic NaCl infusion, but the decreased mutual information in vivo for the osmotically stimulated vasopressin cells suggests that an increased random-ordering of intervals may enhance neuropeptide release. This enhancement may result from a sustained increase of intracellular calcium at the neurosecretory terminals that follows a reduced adaptation of calcium channels because of a reduction in the number of repeated spike motifs.
The responses to the infusions of mannitol introduce further complexity. The responses of the two cell types were different but (as argued above) it seems unlikely that the differences were due to a sampling artefact. (Thirty-nine continuous cells and 53 phasic cells were recorded after mannitol compared with 48 continuous and 51 phasic cells after hypertonic sodium chloride). For continuous cells, the grouped data following osmotic stimulation show that the responses of oxytocin cells to osmotic stimulation are similar for both sodium chloride and mannitol. Aspects of the responses that are a consequence of changes in the behaviour of inputs and that are due to direct effects on the secretory cells are thus probably similar for both stimuli. This is consistent with the increased concentration of plasma oxytocin that follows systemic administration of hypertonic solutions of both mannitol and sodium (Negoro et al. 1988).
In contrast to changes seen in phasic cell firing following NaCl infusion, the infusion of mannitol resulted in a marked decrease in mean spike frequency and increase in the irregularity of firing. Wells et al. (1990) showed that injection of hypertonic mannitol into the dorsal third ventricular region had no measurable effect on plasma vasopressin concentration (although a combination of mannitol and sodium or a more ventral injection had a transient effect). This is consistent with the lack of effect on plasma vasopressin seen in response to local application of hypertonic mannitol into the supraoptic nucleus by Ludwig et al. (1994). Hypertonic mannitol clearly affects the firing of phasic cells but the reduced firing frequency and increased entropy seen after infusion of mannitol may not alter vasopressin release substantially. The differences in responses of continuous and phasic cells to mannitol infusion may result from differences in the nature of their inputs.
Responses of supraoptic cells to osmotic stimulation in vitro
Consistent with observations reported earlier (Haller & Wakerley, 1980), almost all the cells we recorded extracellularly from the supraoptic nucleus in vitro before any form of stimulation fired at a frequency of less than 5 Hz, with a small proportion (9/36) showing a recognizably phasic pattern of activity. Compared to their counterparts in vivo, unstimulated phasic cells recorded in vitro showed no significant difference in entropy (t = −1.55, P = 0.125), but significantly greater patterning (z = 2.76, P = 0.006) as measured by the mutual information between adjacent log intervals. An increased patterning in vitro may reflect differences in the mechanisms involved in phasic firing for the two preparations as a result of an increased importance of deterministic rather than stochastic influences in vitro (Sabatier et al. 2004). The small proportion of phasically firing cells in vitro suggested that the occurrence of the phasic firing pattern was not, on its own, a reliable method for discriminating the two cell types. Thus, all the supraoptic cells recorded in vitro were treated as a single group and compared to all the neurones recorded in vivo. It should be noted that the heterogeneity of cell type could have only reduced rather than increased the significance of differences seen.
Increasing the osmolality of the perfusing medium by addition of 40 mm sodium chloride had no consistent effect on the mean spike frequency for the cells recorded in vitro. The lack of difference occurred although the intensity of the stimulus used in vivo was equivalent to well below half the increase in sodium concentration used in vitro (Leng et al. 2001). We also found that in vitro increasing sodium chloride by 10 or 20 mm had no discernible effect on supraoptic cells. It is thus unlikely that the failure of the 40 mm stimulus to increase the firing rate in vitro resulted from saturation of any osmoreceptive mechanism. Furthermore, a stimulus of 40 mm is greater than the intensity used in the past in experiments involving osmotic stimulation of the magnocellular system (Haller & Wakerley, 1980; Oliet & Bourque, 1993; Leng et al. 2001). We did not feel that it would be useful to raise osmolality still further because the resulting 80-mosmol kg−1 change in osmolality reflects the situation that might occur after several days of dehydration in vivo in the rat and was far greater that that used for the recordings in vivo. The additional sodium might itself have affected the activation and deactivation kinetics of the channel membranes of the supraoptic cells. However, experiments in which osmolality was raised by mannitol showed that while the responses to the different osmotic agents were not identical, the responses in vitro were broadly similar, as had been suggested by the earlier work of Kusano et al. (1999) on cultured cells.
The failure of the sodium chloride hypertonic stimulus to increase mean spike frequency for the grouped data in vitro is consistent with the variable responses among the individual cells as well as observations reported previously (Haller & Wakerley, 1980). A sample size of 30 makes it unlikely that the failure to demonstrate a difference in mean spike frequency was due to a sampling error. While osmotic stimulation in vitro did not significantly alter mean spike frequency, it significantly increased the irregularity of activity as measured by the entropy of the log interval distribution. By contrast, hypertonic sodium chloride infusion in vivo increased the firing rate and decreased the irregularity of activity. This difference between the in vitro and in vivo preparations suggests that the mechanisms underlying osmotic responses in vivo cannot be fully explained by processes that are local to the supraoptic region or are intrinsic to the cell; for example, glial release of taurine (Hussy et al. 2000) or stretch inactivated cation channels (Oliet & Bourque, 1993). The results thus highlight the importance and complexity of extrinsic circuitry in conferring osmosensitivity to supraoptic neurones in vivo.
Responses of supraoptic cells to depolarization in vitro
Because an increased osmolality in vitro was expected to depolarize the cells and increase firing frequency, an alternative depolarizing stimulus was used to test this possibility. A stimulus that has been used in the past (Andrew & Dudek, 1984; Sabatier et al. 2004) was to raise the extracellular potassium concentration. In the present study, the concentration of extracellular potassium was raised in a graded manner so that we could estimate the increase in membrane potential and give some indication of the degree of depolarization (Bhumbra et al. 2005). The whole-cell recordings showed that the depolarization estimated from the extracellular potassium concentration was not significantly different from the measured depolarization. It is thus likely that the estimated depolarization would give a valid indication of the actual change in membrane potential during the extracellular recordings. The effects of potassium on the entropy of the log interval distribution and the mutual information between adjacent log intervals are also what might have been expected. Depolarization was correlated with an increased mean spike frequency. The highly significant negative correlation between mean spike frequency and entropy suggested that depolarization would be correlated with a decrease in entropy although the negative trend was not statistically significant. The irregularity of firing in vitro was thus little affected by increases in potassium-induced depolarization.
In experiments involving extracellular recording in vitro, depolarization with potassium increased firing rate and osmotic stimulation did not, therefore it could be argued that any depolarization produced by osmotic stimulation was insufficient to affect firing rate. To confirm that osmotic stimulation caused some degree of depolarization, we made a small number of sharp electrode intracellular recordings from supraoptic cells and a larger number of whole-cell patch recordings. As expected from previous work (Bourque, 1989), a raised osmolality depolarized the cells and decreased the membrane resistance. However the maximum potassium-induced depolarization was well in excess of the degree of depolarization by osmotic stimulation. Sodium-induced osmotic stimulation in vitro did not significantly affect firing rate but increased the entropy, whereas potassium-induced depolarization significantly increased firing rate and had little or if anything a lowering effect on entropy. This difference suggests that the osmotic responses of supraoptic cells seen in vitro cannot be fully accounted for by their depolarization. The increase in entropy may have occurred as a result of a decreased glial release of taurine (Hussy et al. 2000) or as a result of an osmotically induced reduction in the occurrence of the potassium A current and its modulating effects on the spike firing, reducing the variability of the intervals. Alternatively, the greater amplitude of the postsynaptic current during osmotic stimulation (Inenaga et al. 1997) might have increased the influence of the remaining inputs in vitro on neural firing, resulting in an increased irregularity of activity. An independence of frequency and entropy during osmotic stimulation contrasts with their negative correlation seen during depolarization. The differences between the two experimental situations illustrate that entropy can be used to quantify aspects of firing in a way that frequency cannot. Biologically relevant changes in activity may thus be characterized more fully by measuring changes in the irregularity of firing in addition to mean spike rates (Bhumbra et al. 2005).
Role of osmotically sensitive inputs
Stretch-inactivated cation channels are clearly active in the slice preparation because there is a decreased membrane resistance and a small but significant degree of depolarization in response to osmotic stimulation. An increased sensitivity may serve as a gain modulator of the responses to changes in osmolality. While a modest depolarization alone cannot fully account for the osmosensitivity of the magnocellular system, it is likely that the cation channels enhance the responsiveness of supraoptic neurones to inputs that are sensitive to changes in osmolality in the normal physiological range in vivo (Leng et al. 1999). A reduced glial release of taurine or an increase in the amplitude of the postsynaptic current may further potentiate the sensitivity of magnocellular neurosecretory cells to osmosensitive inputs.
The maintenance of plasma osmolality clearly involves the interaction of many systems but four conclusions can be drawn from the present work. First, as hypertonic infusion of sodium chloride was associated with a decrease in entropy for putative oxytocin cells but not putative vasopressin cells, the mechanisms underlying the osmotic responses of the two cell types in vivo are different. This suggestion is supported by the difference in the responses to hypertonic solutions of sodium and mannitol. Second, a decreased entropy in vivo and an increased entropy in vitro following osmotic stimulation suggest that the osmotic responses of supraoptic cells are different for the two preparations. Third, the difference between the effects of osmotic stimulation and potassium-induced depolarization on mean spike frequency and entropy suggest that the osmosensitivity of supraoptic cells is unlikely to be fully explained by depolarization of the magnocellular cells themselves. Fourth, because an obvious effect of osmotic stimulation on vasopressin cells was a reduction in patterning, as measured by the mutual information between adjacent intervals, spike motifs are likely to be important in modulating vasopressin release. Phasic firing patterns in vivo and in vitro are different (Sabatier et al. 2004) and this may result from the dependence of vasopressin cell activity on glutamatergic inputs (Nissen et al. 1995). Osmotic stimulation decreased spike patterning in vivo, an effect primarily attributable to vasopressin cell responses, whereas patterning in vitro was increased. It is thus likely that the osmoreceptive mechanism that modulates phasic patterning requires afferent connections that are osmotically sensitive. This implies that while intermittent firing of supraoptic neurones is sometimes seen in vitro, vasopressin cells only display the phasic firing pattern seen characteristically in vivo if they have the relevant inputs.
Acknowledgments
This work was supported by Medical Research Council, UK, the Engineering and Physical Sciences Research Council, UK, Merck Sharp & Dohme and the James Baird Fund.
References
- Andrew RD, Dudek FE. Analysis of intracellularly recorded phasic bursting by mammalian neuroendocrine cells. J Neurophysiol. 1984;51:552–566. doi: 10.1152/jn.1984.51.3.552. [DOI] [PubMed] [Google Scholar]
- Bhumbra GS, Dyball REJ. Measuring spike coding in the supraoptic nucleus. J Physiol. 2004;555:281–296. doi: 10.1113/jphysiol.2003.053264. [DOI] [PMC free article] [PubMed] [Google Scholar]
- Bhumbra GS, Dyball REJ. Spike coding from the perspective of a neurone. Cogn Processing. 2005;6:157–176. doi: 10.1007/s10339-005-0006-x. [DOI] [PubMed] [Google Scholar]
- Bhumbra GS, Inyushkin AN, Dyball REJ. Assessment of spike activity in the supraoptic nucleus. J Neuroendocrinol. 2004;16:390–397. doi: 10.1111/j.0953-8194.2004.01166.x. [DOI] [PubMed] [Google Scholar]
- Bhumbra GS, Inyushkin AN, Saeb-Parsy K, Hon A, Dyball REJ. Rhythmic changes in spike coding in the rat suprachiasmatic nucleus. J Physiol. 2005;563:291–307. doi: 10.1113/jphysiol.2004.079848. [DOI] [PMC free article] [PubMed] [Google Scholar]
- Bourque CW. Ionic basis for the intrinsic activation of rat supraoptic neurones by hyperosmotic stimuli. J Physiol. 1989;417:263–277. doi: 10.1113/jphysiol.1989.sp017800. [DOI] [PMC free article] [PubMed] [Google Scholar]
- Brimble MJ, Dyball REJ. Characterization of the responses of oxytocin- and vasopressin-secreting neurones in the supraoptic nucleus to osmotic stimulation. J Physiol. 1977;271:253–271. doi: 10.1113/jphysiol.1977.sp011999. [DOI] [PMC free article] [PubMed] [Google Scholar]
- Cazalis M, Dayanithi G, Nordmann JJ. The role of patterned burst and interburst interval on the excitation-coupling mechanism in the isolated rat neural lobe. J Physiol. 1985;369:45–60. doi: 10.1113/jphysiol.1985.sp015887. [DOI] [PMC free article] [PubMed] [Google Scholar]
- Cui L-N, Saeb-Parsy K, Dyball REJ. Neurones in the supraoptic nucleus of the rat are regulated by a projection from the suprachiasmatic nucleus. J Physiol. 1997;502:149–159. doi: 10.1111/j.1469-7793.1997.149bl.x. [DOI] [PMC free article] [PubMed] [Google Scholar]
- Dutton A, Dyball REJ. Phasic firing enhances vasopressin release from the rat neurohypophysis. J Physiol. 1979;290:433–440. doi: 10.1113/jphysiol.1979.sp012781. [DOI] [PMC free article] [PubMed] [Google Scholar]
- Dyball REJ, Bhumbra GS. Digital spike discrimination combining size and shape elements. J Physiol. 2003;547.P:D9. [Google Scholar]
- Dyball REJ, McKenzie DN. Synchronized clusters of action potentials can increase or decrease the excitability of axons of magnocellular hypothalamic neurosecretory cells. J Neuroendocrinol. 2000;12:729–735. doi: 10.1046/j.1365-2826.2000.00506.x. [DOI] [PubMed] [Google Scholar]
- Dyball REJ, Pountney PS. Discharge patterns of supraoptic and paraventricular neurones in rats given a 2% NaCl solution instead of drinking water. J Endocrinol. 1973;56:91–98. doi: 10.1677/joe.0.0560091. [DOI] [PubMed] [Google Scholar]
- Haller EW, Wakerley JB. Electrophysiological studies of paraventricular and supraoptic neurones recorded in vitro from slices of rat hypothalamus. J Physiol. 1980;302:347–362. doi: 10.1113/jphysiol.1980.sp013247. [DOI] [PMC free article] [PubMed] [Google Scholar]
- Hussy N, Deleuze C, Desarmenien MG, Moos FC. Osmotic regulation of neuronal activity: a new role for taurine and glial cells in a hypothalamic neuroendocrine structure. Prog Neurobiol. 2000;62:113–134. doi: 10.1016/s0301-0082(99)00071-4. [DOI] [PubMed] [Google Scholar]
- Inenaga K, Cui L-N, Nagatomo T, Honda E, Ueta Y, Yamashita H. Osmotic modulation of glutamatergic excitatory synaptic inputs to neurons in the supraoptic nucleus of rat hypothalamus in vitro. J Neuroendocrinol. 1997;9:63–68. doi: 10.1046/j.1365-2826.1997.00597.x. [DOI] [PubMed] [Google Scholar]
- Inyushkin AN, Dyball REJ. Burst stimulation alters the excitability of hypothalamic axons. J Physiol. 2004;565.P:C54. [Google Scholar]
- Kusano J, House B, Gainer H. Effects of osmotic pressure and brain-derived neurotrophic factor on the survival of postnatal hypothalamic oxytocinergic and vasopressinergic neurons in dissociated cell culture. J Neuroendocrinol. 1999;11:145–152. doi: 10.1046/j.1365-2826.1999.00296.x. [DOI] [PubMed] [Google Scholar]
- Leng G, Brown CH, Bull PM, Brown D, Scullion S, Currie J, et al. Responses of magnocellular neurons to osmotic stimulation involves coactivation of excitatory and inhibitory input: an experimental and theoretical analysis. J Neurosci. 2001;21:6967–6977. doi: 10.1523/JNEUROSCI.21-17-06967.2001. [DOI] [PMC free article] [PubMed] [Google Scholar]
- Leng G, Brown CH, Russell JA. Physiological pathways regulating the activity of magnocellular neurosecretory cells. Prog Neurobiol. 1999;57:625–655. doi: 10.1016/s0301-0082(98)00072-0. [DOI] [PubMed] [Google Scholar]
- Leng G, Dyball REJ. Functional identification of magnocellular neuroendocrine neurones. In: Greenstein B, Francis Taylor, editors. Neuroendocrine Research Methods. London: 1991. [Google Scholar]
- Lincoln DW, Wakerley JB. Electrophysiological evidence for the activation of supraoptic neurones during the release of oxytocin. J Physiol. 1974;242:533–554. doi: 10.1113/jphysiol.1974.sp010722. [DOI] [PMC free article] [PubMed] [Google Scholar]
- Ludwig M, Horn T, Callahan MF, Grosche A, Morris M, Landgraf R. Osmotic stimulation of the supraoptic nucleus: central and peripheral vasopressin release and blood pressure. Am J Physiol. 1994;266:E315–E356. doi: 10.1152/ajpendo.1994.266.3.E351. [DOI] [PubMed] [Google Scholar]
- Mason WT. Supraoptic neurones of the rat hypothalamus are osmosensitive. Nature. 1980;287:154–157. doi: 10.1038/287154a0. [DOI] [PubMed] [Google Scholar]
- Negoro H, Higuchi T, Tadokoro Y, Honda K. Osmoreceptor mechanism for oxytocin release in the rat. Jpn J Physiol. 1988;38:19–31. doi: 10.2170/jjphysiol.38.19. [DOI] [PubMed] [Google Scholar]
- Nissen R, Hu B, Renaud LP. Regulation of spontaneous phasic firing of rat supraoptic vasopressin neurones in vivo by glutamate receptors. J Physiol. 1995;484:415–424. doi: 10.1113/jphysiol.1995.sp020674. [DOI] [PMC free article] [PubMed] [Google Scholar]
- Oliet SH, Bourque CW. Mechanosensitive channels transduce osmosensitivity in supraoptic neurons. Nature. 1993;364:341–343. doi: 10.1038/364341a0. [DOI] [PubMed] [Google Scholar]
- Poulain DA, Wakerley JB. Electrophysiology of hypothalamic magnocellular neurones secreting oxytocin and vasopressin. Neuroscience. 1982;7:773–808. doi: 10.1016/0306-4522(82)90044-6. [DOI] [PubMed] [Google Scholar]
- Rodieck RW, Kiang NY-S, Gerstein GL. Some quantitative methods for the study of spontaneous activity of single neurons. Biophys J. 1962;2:351–367. doi: 10.1016/s0006-3495(62)86860-x. [DOI] [PMC free article] [PubMed] [Google Scholar]
- Sabatier N, Brown CH, Ludwig M, Leng G. Phasic spike patterning in rat supraoptic neurones in vivo and in vitro. J Physiol. 2004;558:161–180. doi: 10.1113/jphysiol.2004.063982. [DOI] [PMC free article] [PubMed] [Google Scholar]
- Shannon CE, Weaver W. The Mathematical Theory of Communication. Urbana: University of Illinois Press; 1949. [Google Scholar]
- Stern JE, Armstrong WE. Electrophysiological differences between oxytocin and vasopressin neurons recorded from female rats in vitro. J Physiol. 1995;488:701–708. doi: 10.1113/jphysiol.1995.sp021001. [DOI] [PMC free article] [PubMed] [Google Scholar]
- Wells T, Forsling ML, Windle RJ. The vasopressin response to centrally administered hypertonic solutions in the conscious rat. J Physiol. 1990;427:483–493. doi: 10.1113/jphysiol.1990.sp018183. [DOI] [PMC free article] [PubMed] [Google Scholar]
- Yagi K, Azuma T, Matsuda K. Neurosecretory cell: capable of conducting impulse in rats. Science. 1966;154:778–779. doi: 10.1126/science.154.3750.778. [DOI] [PubMed] [Google Scholar]
- Yamashita H, Kasai M, Inenage K. Effects of corticotropin-releasing factor on nuerones in the hypothalamic paraventricular nucleus in vitro. Brain Res Bull. 1991;27:321–325. doi: 10.1016/0361-9230(91)90119-5. [DOI] [PubMed] [Google Scholar]