Abstract
The incretin hormone, glucagon-like peptide-1 (GLP-1) is released from intestinal L-cells following food ingestion. Its secretion is triggered by a range of nutrients, including fats, carbohydrates and proteins. We reported previously that Na+-dependent glutamine uptake triggered electrical activity and GLP-1 release from the L-cell model line GLUTag. However, whereas alanine also triggered membrane depolarization and GLP-1 secretion, the response was Na+ independent. A range of alanine analogues, including d-alanine, β-alanine, glycine and l-serine, but not d-serine, triggered similar depolarizing currents and elevation of intracellular [Ca2+], a sensitivity profile suggesting the involvement of glycine receptors. In support of this idea, glycine-induced currents and GLP-1 release were blocked by strychnine, and currents showed a 58.5 mV shift in reversal potential per 10-fold change in [Cl−], consistent with the activation of a Cl−-selective current. GABA, an agonist of related Cl− channels, also triggered Cl− currents and secretion, which were sensitive to picrotoxin. GABA-triggered [Ca2+]i increments were abolished by bicuculline and partially impaired by (1,2,5,6-tetrahydropyridine-4-yl)methylphosphinic acid (TPMPA), suggesting the involvement of both GABAA and GABAC receptors. Expression of GABAA, GABAC and glycine receptor subunits was confirmed by RT-PCR. Glycine-triggered GLP-1 secretion was impaired by bumetanide but not bendrofluazide, suggesting that a high intracellular [Cl−] maintained by Na+–K+–2Cl− cotransporters is necessary for the depolarizing response to glycine receptor ligands. Our results suggest that GABA and glycine stimulate electrical activity and GLP-1 release from GLUTag cells by ligand-gated ion channel activation, a mechanism that might be important in responses to endogenous ligands from the enteric nervous system or dietary sources.
Glucagon-like peptide-1 (GLP-1) is an incretin hormone released from the intestinal mucosa. It is synthesized and secreted by L-cells, an enteroendocrine cell type present in the mucosal epithelium, and its secretion is stimulated by the presence of nutrients in the lumen of the gut following food ingestion (Kieffer & Habener, 1999). It plays an important role in glucose homeostasis, because it enhances glucose-dependent insulin release from the endocrine pancreas (Kieffer & Habener, 1999; Drucker, 2002). It has also been found to stimulate beta cell neogenesis and inhibit apoptosis (Brubaker & Drucker, 2004; Edwards, 2004). These actions suggest that GLP-1 or its longer-lived analogues may have advantages over current therapies for type 2 diabetes (Holst, 2002; Gromada et al. 2004; Small & Bloom, 2004). Since L-cells also secrete the anorectic peptide, peptide YY (PYY) (Nilsson et al. 1991), targeting the pathways involved in stimulus-secretion coupling in L-cells could provide an alternative strategy for the treatment of diabetes and obesity. Understanding the normal physiology of the L-cell is a crucial foundation for this approach.
Nutrient sensing by L-cells is believed to involve both direct and indirect mechanisms. As the cells are localized with apical microvilli facing into the gut lumen (Eissele et al. 1992), it seems that they are ideally placed to sense the luminal contents directly. Whilst many of the cells are located in the small intestine and would be expected to experience changes in the concentration of luminal nutrients, such as amino acids released from protein digestion, a significant proportion of the cells are located more distally in the colon and rectum where they are less likely to experience changing nutrient levels directly. Indirect mechanisms involving neural or hormonal pathways might also therefore play a role in enhancing GLP-1 release. The submucosal and myenteric plexi, which make up the local intestinal neural circuitry, might contribute both to stimulus detection and to enhancing or depressing secretion at the level of the L-cell. The idea that neuronal and hormonal pathways can modulate L-cell secretion is supported by the findings that a number of neurotransmitters and hormones can modulate GLP-1 release (Herrmann-Rinke et al. 1995; Kieffer & Habener, 1999; Rocca & Brubaker, 1999). Like the central nervous system, the enteric nervous system consists of a range of neuronal cell types expressing different neurotransmitters and receptors, whose precise interrelationships remain unclear (Galligan, 2002).
The specific nutrients that have been shown to stimulate GLP-1 release are quite diverse, and include carbohydrates, fats and proteins. Using an electrophysiological approach, we have shown previously that glucose and certain amino acids can trigger both electrical activity and GLP-1 secretion from the GLUTag cell line (Reimann & Gribble, 2002; Gribble et al. 2003; Reimann et al. 2004). Since L-cells are scattered throughout the intestinal epithelium and occur at low frequency, they are currently not amenable to study with the patch-clamp technique. Nevertheless, a number of studies support the use of GLUTag cells as a model L-cell. This cell line was established from a colonic tumour taken from a transgenic mouse expressing SV40 large T antigen under the control of the proglucagon promoter, and has been shown to respond appropriately to a range of physiological stimuli (Drucker et al. 1994).
Nutrient stimulated GLP-1 release from GLUTag cells involves a number of separate pathways. Glucose, for example, triggers membrane depolarization by a combination of ATP-sensitive K+-channel (KATP channel) closure secondary to metabolic ATP generation, and direct induction of a depolarizing current as a result of Na+-coupled glucose uptake (Reimann & Gribble, 2002; Gribble et al. 2003). Glutamine was found to be a very potent GLP-1 secretagogue, causing both membrane depolarization due to its Na+-dependent electrogenic uptake, and strong potentiation of the secretory pathway downstream of Ca2+ entry (Reimann et al. 2004). In the course of the latter study we also found that the amino acid alanine stimulated GLP-1 release, although less potently than glutamine. The effect of this amino acid, however, was noted to differ from that of glutamine, as the rise in intracellular Ca2+ was much greater than that induced by glutamine even though the end secretory response was smaller. In this study, we investigated further the mechanisms involved in the detection of alanine and its structural analogues by GLUTag cells, and discovered that the response involves the activation of glycine receptors, a target normally associated with synaptic neurotransmission in the central nervous system. The role of glycine receptors and related ionotropic GABA receptors was then investigated in further detail.
Methods
Cell culture
GLUTag cells were cultured in Dulbecco's modified EAGLE'S medium containing 5.5 mm glucose, as previously described (Drucker et al. 1994; Reimann & Gribble, 2002).
GLP-1 secretion
For secretion experiments cells were plated in 24-well culture plates coated with Matrigel (BDBiosciences, Oxford, UK), and allowed to reach 60–80% confluency. On the day of the experiment cells were washed twice with 500 μl nutrient-free standard bath solution supplemented with 0.1 mm DiprotinA and 0.1% (w/v) bovine serum albumin (BSA). Experiments were performed by incubating the cells with test reagents in the same solution for 2 h at 37°C. The final DMSO concentration was adjusted to 0.1% for all conditions tested, including the control. Bumetanide and bendrofluazide, when used, were added to the culture medium 16 h before the secretion experiment began, and were also included in the test solutions. At the end of the incubation period, medium was collected and centrifuged to remove any floating cells. GLP-1 was assayed using an ELISA specific for GLP-1(7–36) amide and GLP-1(7–37) (Linco GLP-1 active ELISA kit; Biogenesis, Poole, UK).
[Ca2+]i measurements
Cells were plated on Matrigel-coated coverslips 1–3 days prior to use and loaded with fura-2 or fura-FF by incubation in 1 μm of the acetoxymethylester (Molecular Probes, Leiden, The Netherlands) for 30 min in bath solution containing 1 mm glucose. Measurements were made after mounting the coverslip in a perfusion chamber (Warner Instruments, Harvard Apparatus) on an inverted fluorescence microscope (Olympus IX71, Southall, UK) with a ×40 oil-immersion objective. Excitation at 340 and 380 nm was achieved using a combination of a 75 W xenon arc lamp and a monochromator (Cairn Research, Faversham, UK) controlled by MetaFluor software (Universal Imaging, Cairn Research), and emission was recorded with a CCD camera (Hamamatsu Orca ER; Cairn Research, Kent, UK) using a dichroic mirror and a 510 nm long-pass filter. Free cytoplasmic Ca2+ concentrations were estimated for individual cells from background-subtracted fluorescence using the equation of Grynkiewicz et al. (1985) assuming a KD of 5.5 μm for fura-FF. Minimal and maximal signals were recorded in the presence of 5 μm ionomycin in 5 mm EGTA/0 mm Ca2+ and 5 mm Ca2+, respectively, at the end of the experiment.
Electrophysiology
Cells were plated into 35 mm dishes 1–3 days prior to use. Experiments were performed on single cells and well-defined cells in small clusters. Microelectrodes were pulled from borosilicate glass (GC150T; Harvard Apparatus, Edenbridge, UK) and the tips coated with refined yellow beeswax. Electrodes were fire-polished using a microforge (Narishige, London, UK) and had resistances of 2.5–3 MΩ when filled with pipette solution. Membrane potential and currents were recorded using either an Axopatch 200B (Axon Instruments, Union City, CA, USA) linked through a Digidata 1320A interface and pCLAMP software (Axon Instruments), or using a HEKA EPC10 amplifier (Digitimer, Welwyn Garden City, UK) and Patchmaster/Pulse software (HEKA). Electrophysiological recordings were made using either the standard whole-cell or perforated-patch configuration of the patch-clamp setup at 22–24°C.
Solutions and chemicals
The perforated patch pipette solution contained (mm): 76 K2SO4, 10 KCl, 10 NaCl, 55 sucrose, 10 Hepes, 1 MgCl2 (pH 7.2 with KOH), to which amphotericin B was added to a final concentration of 200 μg ml−1. The standard whole-cell patch pipette solution contained (mm): 107 KCl, 1 CaCl2, 7 MgCl2, 11 EGTA, 10 Hepes, 5 Na2ATP (pH 7.2 with KOH). The standard bath solution contained (mm): 5.6 KCl, 138 NaCl, 4.2 NaHCO3, 1.2 NaH2PO4, 2.6 CaCl2, 1.2 MgCl2, 10 Hepes (pH 7.4 with NaOH). Na+-free medium was prepared by replacing Na+ with N-methyl-d-glucamine (NMDG+). For measurement of the Cl− dependency of currents and reversal potentials we used the following solutions (mm): pipette: 107 CsCl, 1 CaCl2, 5 MgCl2, 11 EGTA, 10 Hepes, 5 Na2ATP (pH 7.2 with CsOH; final [Cl−]∼119 mm), or a similar solution in which the total [Cl−] was reduced to ∼12 mm by substitution of CsCl with caesium methanesulphonate; bath: 115 NaCl, 2.6 CaCl2, 1.2 MgCl2, 5 CsCl, 5 CoCl2, 20 TEACl, 10 4-aminopyridine (4-AP), 10 Hepes, 0.3 μm TTX (pH 7.4 with HCl; final [Cl−]∼162 mm), or a similar solution in which total [Cl−] was reduced to ∼40 mm by substitution of NaCl, MgCl2 and CaCl2 by their respective gluconate salts. Drugs and chemicals were purchased from Sigma-Aldrich (Poole, UK) unless otherwise stated. CsCl and CsOH were from Alfa Aesar (Avocado Research Chemicals, Heysham, UK).
Data analysis
Data were analysed with Microcal Origin (Aston Scientific, Milton Keynes, UK), pCLAMP, PulseFit/PatchMaster and Microsoft Excel software. For the evaluation of the half-maximal effective agonist concentrations and Hill coefficients data were fitted by the equation: G=Gmax/(1 + (EC50/[C])n) where G/Gmax is the normalized conductance, C is the ligand concentration, EC50 is the half-maximal activating ligand concentration, and n is the Hill coefficient.
Corrections were made for liquid junction potentials in the experiments to measure the Cl− dependency of glycine and GABA-induced currents, as calculated by the program JPCalc within the pCLAMP software.
Statistical analysis
Results are presented as means ± standard error of the mean. Statistical significance was tested by Student's t test, using a threshold for significance of P < 0.05.
RT-PCR
RNA was extracted from a whole mouse brain or ∼2.5 × 10⁷ GLUTag cells using Tri-Reagent (Sigma), according to the manufacturer's instructions. First-strand cDNA synthesis was performed for 10 min at 25°C, followed by 50 min at 42°C, in a total reaction volume of 25 μl containing ∼1 μg total RNA and 500 ng random hexamer primers (Promega) using SuperScriptII Reverse Transcriptase (Invitrogen). A 0.5 μl volume of this reaction was used for subsequent PCR amplification in a 50 μl volume containing 50 pmol of each primer of a specific sense/antisense pair (see Table 1) using Taq-Polymerase (Promega). PCRs were performed in a PTC-200 DNA engine cycler (MJ Research) using the following cycling protocol: initial 3 min 94°C followed by 35 cycles of 94°C, 58°C and 72°C for 1 min each, followed by a final elongation at 72°C for 5 min. 20 μl of the reaction was used for subsequent analysis by agarose gel electrophoresis and products were visualized by ethidium bromide fluorescence. Using this protocol GABAC receptor signals were not detected using either GLUTag or mouse brain cDNA as a template. An additional PCR using 0.5 μl of the initial amplification reaction as template and nested primers was therefore performed. All primer pairs were verified to give no bands when H2O was used instead of template cDNA in the initial PCR.
Table 1.
Primers used for RT-PCR reactions
| Sense | Antisense | Predicted (bp) | |
|---|---|---|---|
| GlyRα1 | CTTCCAAAGAGGCTGAAGCCG | GGCTGGGGATGTACATCTGG | 712 |
| GlyRα2 | GACCATGACTCCAGGTCTGG | GGCTGGGGATGTACATCTGG | 712 |
| GlyRα3 | GTGCGCGATCTCGAAGTGC | GGCTGGGGATGTACATCTGG | 695 |
| GABRα1 | CTCATTCTGAGCACACTGTCG | ATGGTGTACAGCAGAGTGCC | 424 |
| GABRα2 | CTTTGGCAACAAGAAGATGAAGAC | CCATCATCCTGGATTCGAAGC | 470 |
| GABRα3 | GACCAGAGTTGTACTTCTTCTCC | CCATCCTGTGCTACTTCCAC | 677 |
| GABRα4 | GGACAGAACTCAAAGGACGAG | TACAGTCTGCCCAATGAGGTC | 590 |
| GABRα5 | GGACGGACTCTTGGATGGC | TGCTGGTGCTGATGTTCTCAG | 542 |
| GABRα6 | AAGATGAAGGCAACTTCTACTCTG | ACTGTCATGATGCACGGAGTG | 699 |
| GABRρ1 | GACACCACCACAGACAACGTC | CTCATGCTCACATAGCTGCC | 838 |
| GABRρ1 (nested) | GCTGTGCCTGCTAGAGTCC | GAGTCAGCTGCACCATCATCC | 360 |
| GABRρ2 | GTCACTGCCATGTGCAACATG | TGGCAGAATGTGGCTTCTTGG | 677 |
| GABRρ2 (nested) | TTCACACGACTTCCAGACTGG | TCACTGTAGCTTCCATCCAGC | 450 |
| GABRρ3 | CGACACAACCGTGGAGAATATC | CTGAGATGAATCTGCACAGGG | 801 |
| GABRρ3 (nested) | CATTGAGGAGTTCAGCGCATC | CCCTCCTGTTGAGTTGTTTCC | 395 |
Primers were designed to span intron/exon borders using sequence information from the mouse genomic database at http://www.ensembl.org to distinguish amplification from genomic DNA contamination. Sequences are 5′–3′.
Results
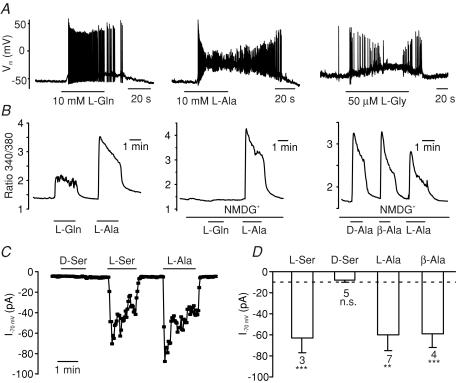
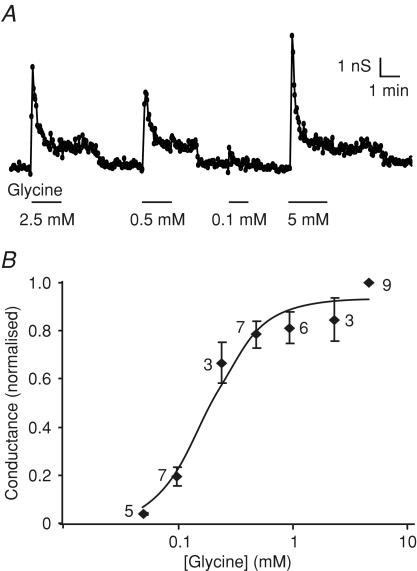
We showed previously that a range of amino acids, including glutamine, alanine and serine, stimulate GLP-1 release from GLUTag cells (Reimann et al. 2004). The response to alanine was accompanied by an increase in intracellular [Ca2+] that was both larger than that induced by glutamine and independent of extracellular Na+ (Fig. 1B), and which correlated, in electrophysiological recordings, with a strong membrane depolarization and action potential firing, often followed by a plateau phase during which the membrane remained depolarized at ∼−30 mV but no further action potentials were fired (Fig. 1A). The Na+ independence of the response indicated that the mechanism was different from that triggered by glutamine, and we speculated that it might involve either the opening of ligand-gated ion channels or electrogenic amino acid uptake coupled to an ionic gradient other than Na+ (e.g. H+). As these mechanisms might be distinguishable by their amino acid sensitivities, we compared the effects of structurally related amino acids on Ca2+ responses and whole-cell currents. Whereas l-serine, β-alanine and d-alanine reproduced the responses observed with alanine, d-serine was without effect (Fig. 1B, C and D). This pattern of amino acid sensitivity, and in particular the lack of responsiveness to d-serine, is characteristic of the reported sensitivity of glycine-gated Cl− channels (glycine receptors) (Schmieden et al. 1999). Consistent with this idea, whole-cell inward currents were triggered by glycine, with an EC50 of 192 ± 22 μm (Hill coefficient, 1.9 ± 0.3; Fig. 2).
Figure 1. Sensitivity of GLUTag cells to structural analogues of alanine.
A, action potentials triggered by l-glutamine (L-Gln, 10 mm), l-alanine (L-Ala, 10 mm) and l-glycine (L-Gly, 50 μm) in perforated-patch recordings of GLUTag cells. B, intracellular Ca2+ concentrations, monitored as the ratio of the fluorescence at 340 and 380 nm in fura-2-loaded cells. l-Glutamine, l-alanine, d-alanine and β-alanine (all at 10 mm) were added at the times shown by the horizontal bars. Substitution of Na+ with N-methyl-d-glucamine (NMDG+) in the bath solution abolished the effect of l-glutamine, but did not affect responses to l-alanine, d-alanine or β-alanine. C, l-serine, l-alanine and β-alanine, but not d-serine, triggered inward currents (I) at a holding potential of −70 mV in standard whole-cell recordings of GLUTag cells. D, mean currents at −70 mV for cells recorded as in C. The dashed line indicates the mean current in the absence of amino acids, and the numbers of cells are indicated below each bar. ***P < 0.001, **P < 0.01; n.s., not significant, in comparison with the mean background current.
Figure 2. Dose–response relationship for currents triggered by glycine.
A, slope conductance in response to a series of voltage ramps between −90 and −40 mV measured in a cell in standard whole-cell recording mode. Different glycine concentrations were applied as indicated. B, mean slope conductance of five ramps at each glycine concentration was calculated and the mean of the control conductances measured before and after each test application was subtracted. Data were normalized to the 5 mm glycine response, measured on the same patch. The numbers of cells are indicated next to the data points. Data were fitted with a Hill equation, with an EC50 of 0.2 mm and Hill coefficient of 1.9.
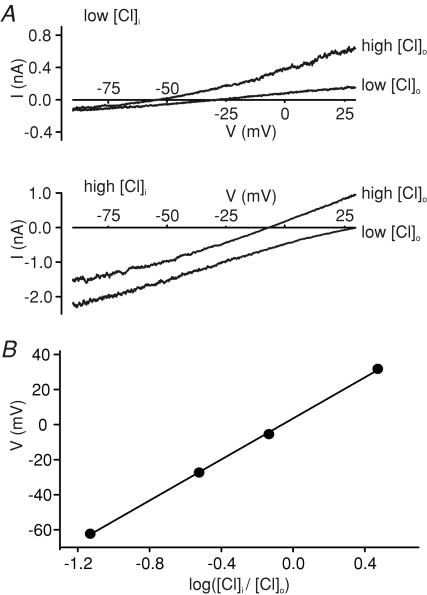
To further investigate the possibility that GLUTag cells express functional glycine receptors, we measured the dependence of glycine-induced currents on intracellular and extracellular Cl− concentrations in whole-cell voltage-clamp experiments. Voltage-gated K+, Na+ and Ca2+ channels were inhibited by a combination of Cs+, TEA+, TTX, 4-AP and Co2+ to enable membrane depolarization to positive potentials, without activating the known voltage-gated cation channels (Reimann et al. 2005). Different combinations of high and low Cl− in the intracellular (pipette) and extracellular (bath) solutions affected both the current magnitude and the reversal potential (Erev) of glycine-induced currents (Fig. 3). A plot of Erevversus log[Cl−]i/[Cl−]o was linear with a gradient of 58.5 mV (n = 5), close to the 58 mV gradient predicted by the Nernst equation for a Cl−-selective current, and consistent with activation of glycine receptors (Bormann et al. 1987).
Figure 3. Glycine-induced currents are dependent on the Cl− gradient.
A, current–voltage relationships for currents triggered by 100 μm glycine in the presence of different combinations of low and high [Cl−] in the patch pipette (low [Cl−]i, high [Cl−]i) and bath solution (low [Cl−]o, high [Cl−]o). The estimated chloride concentrations of the different solutions were (mm): low [Cl−]i∼12, high [Cl−]i∼119, low [Cl−]o∼40, high [Cl−]o∼162. Recordings were made in standard whole-cell mode, in response to a voltage ramp from −90 to +50 mV, and the response to a single voltage ramp is shown for each condition. Corrections were made for liquid junction potentials, as calculated by the program JPCalc within the pCLAMP software. Control current responses, recorded immediately prior to glycine addition, were subtracted. Voltage-gated cation currents were blocked by TEA+, 4-aminopyridine (4-AP), TTX, Co2+ and Cs+. B, relationship between the reversal potential (V) and log([Cl−]i/[Cl−]o) for cells recorded as in A (n = 5 for each data point). Error bars are obscured by the data points. The data were best fitted with a straight line of gradient 58.5 mV.
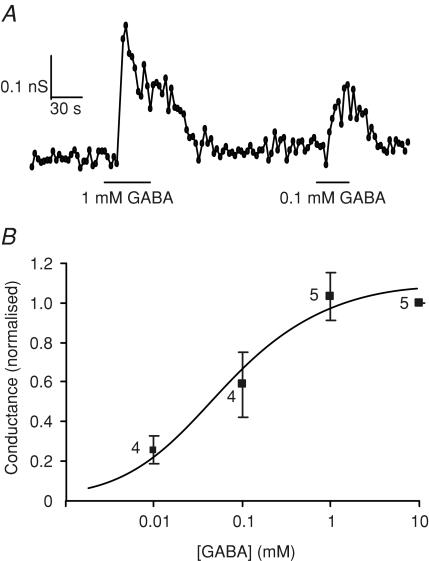
Since ionotropic GABA receptors are structurally related to glycine receptors and have been identified previously in the enteroendocrine cell line STC-1 (Glassmeier et al. 1998; Jansen et al. 2000), we also investigated the effect of GABA on GLUTag cells. GABA triggered conductances that were smaller than those induced by glycine (0.44 ± 0.11 nS per cell for 10 mm GABA, versus 6.0 ± 1.8 nS per cell for 1 mm glycine), and which were half-maximal at a GABA concentration of 58 ± 34 μm (Hill coefficient, 0.8 ± 0.3; Fig. 4). Reduction of the extracellular [Cl−] from 162 mm to 40 mm caused a 35 mV shift in the reversal potential of the GABA current from −2.3 ± 1.7 mV to +32.6 ± 1.5 mV (n = 4), consistent with the 35.2 mV shift predicted by the Nernst equation for a Cl− selective current, and suggestive of the involvement of ionotropic GABA receptors.
Figure 4. Dose–response relationship for currents triggered by GABA.
A, slope conductance in response to a series of voltage ramps between −90 and −40 mV measured in a cell in standard whole-cell recording mode. Different GABA concentrations were applied as indicated. B, mean slope conductance of five ramps at each GABA concentration was calculated and the mean of the control conductances measured before and after each test application was subtracted. Data were normalized to the 10 mm GABA response, measured on the same patch. The number of cells is indicated next to the data points. Data were fitted with a Hill equation, with an EC50 of 0.06 mm, and a Hill coefficient of 0.8.
To assess the functional responses to glycine and GABA, we measured their effects on intracellular Ca2+ concentrations. The Ca2+ levels reached following application of 1 mm glycine or GABA were beyond the range that could be reliably resolved using fura-2, and were therefore measured using the lower affinity Ca2+ indicator, fura-FF. The peak intracellular [Ca2+] triggered by 1 mm glycine was 6.9 ± 0.8 μm (n = 23 cells from six independent experiments) and that triggered by 1 mm GABA was 6.3 ± 0.6 μm (n = 16 cells from four independent experiments).
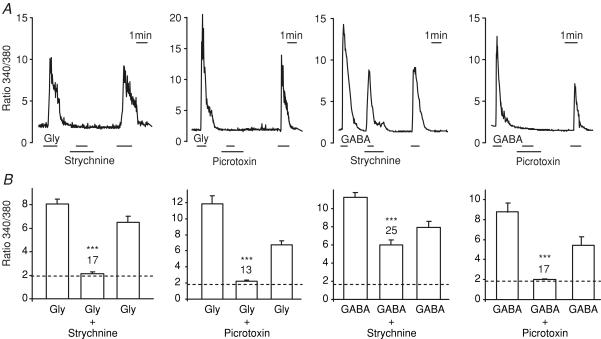
To confirm that the observed responses represented the activation of glycine and ionotropic GABA receptors, we also tested their toxin sensitivity. Strychnine is a relatively selective inhibitor of glycine receptors with some cross-reactivity with GABA receptors at higher concentrations (>1 μm; Li et al. 2003), whereas picrotoxin blocks both ionotropic GABA receptors and some isoforms of the glycine receptor. The intracellular [Ca2+] rise triggered by glycine (monitored as the 340/380 nm fluorescence ratio in fura-2-loaded cells) was inhibited by both strychnine (10 μm) and picrotoxin (100 μm), whereas the response to GABA was abolished by picrotoxin but only marginally impaired by strychnine (Fig. 5). Whole-cell currents at −70 mV triggered by 1 mm glycine were also blocked 98 ± 2% (n = 4) by 10 μm strychnine, and currents induced by 1 mm GABA were inhibited 91 ± 3% (n = 3) by 100 μm picrotoxin.
Figure 5. Intracellular Ca2+ responses to glycine and GABA.
A, intracellular [Ca2+] was monitored as the ratio of fluorescence at 340 and 380 nm in fura-2-loaded GLUTag cells. Glycine (0.1 mm), GABA (1 mm), strychnine (10 μm) and picrotoxin (100 μm) were added as indicated by the horizontal bars. B, mean peak fluorescence ratio (averaged over 5 s) of cells recorded as in A. Bars indicate the mean response to glycine or GABA before addition of the toxin, in the presence of toxin, and following toxin washout. The dashed line represents the background fluorescence ratio in the absence of test agent, and the numbers of cells measured are indicated above the bars. Statistical significance was tested by comparing the ratio in the presence of the toxin with the mean of the responses before and after the toxin application, using Student's paired t test; ***P < 0.001.
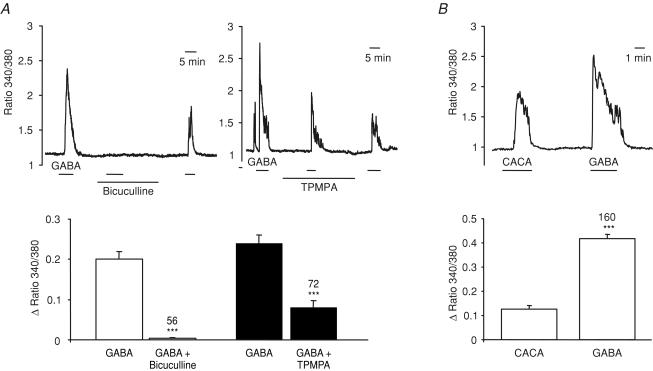
To distinguish between the two subclasses of ionotropic GABA receptor (GABAA and GABAC), we tested the effects of the specific GABAA and GABAC receptor antagonists, bicuculline methiodide and TPMPA ((1,2,5,6-tetrahydropyridine-4-yl)methylphosphinic acid), respectively (Chebib, 2004). The rise in [Ca2+]i triggered by 100 μm GABA was almost completely abolished by bicuculline (100 μm), and more than 50% blocked by TPMPA (100 μm) (Fig. 6A), suggesting the presence of both GABAA and GABAC receptor classes in the GLUTag cell. In support of the idea that GLUTag cells express GABAC in addition to GABAA receptors, a [Ca2+]i rise was also triggered by the specific GABAC receptor agonist, CACA (cis-4-aminocrotonic acid; 100 μm) (Fig. 6B).
Figure 6. Pharmacological characterization of the GABA-triggered Ca2+ responses.
Intracellular [Ca2+] was monitored as the ratio of fluorescence at 340 and 380 nm in fura-2-loaded GLUTag cells. A, top, responses to GABA (100 μm) in the absence and presence of bicuculline methiodide (100 μm) and (1,2,5,6-tetrahydropyridine-4-yl)methylphosphinic acid (TPMPA) (100 μm), as indicated by the horizontal bars; bottom, mean change in the fluorescence ratio (averaged over 150 s) of cells recorded as above during the application of GABA before addition and after washout of the antagonist or in the presence of the antagonist. The numbers of cells measured (in three independent experiments each) are indicated above the bars. Statistical significance was tested by comparing the ratio change in the presence of the antagonist with the mean of the responses before and after the antagonist application, using Student's paired t test; ***P < 0.001. B, top, responses to cis-4-aminocrotonic acid (CACA) (100 μm) and GABA (100 μm) applied as indicated by the horizontal bars in an example cell; bottom, mean change in the fluorescence ratio (averaged over 150 s) of cells recorded as above. The numbers of cells measured (in five independent experiments) are indicated above the bars. Statistical significance was tested by comparing the ratio changes triggered by CACA and GABA in the same cell, using Student's paired t test; ***P < 0.001.
Subunit identification by RT-PCR
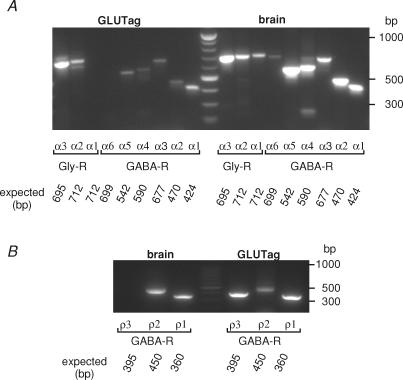
Ionotropic GABA and glycine receptors are formed by the pentameric assembly of different subunits. Glycine receptor subunits (α1−3, β) are commonly arranged as either 3α:2β heteromers or as α-homomers. GABAA subunits (currently α1−6, β1−3, γ1−3, δ, ɛ, θ and π) associate more variably to form functional GABAA receptors, whereas GABAC receptors are composed exclusively of ρ1−3 subunits. To confirm the presence of glycine and GABA receptor subunits in GLUTag cells, we performed RT-PCR reactions for the different glycine and GABAA receptor α subunits (GlyR α1−3, GABA-R α1−6), and ρ1−3. Glycine receptor subunits α2 and α3, and GABAA receptor subunits α1, α2, α3, α4 and α5 were clearly detected (Fig. 7A). GABAC receptor signals were not, however, detected using either GLUTag or control mouse brain cDNA as a template, so an additional PCR was performed using 0.5 μl of the initial amplification reaction as template and nested primers. Using this protocol, ρ1, ρ2 and ρ3 subunits were detected in GLUTag cells (Fig. 7B).
Figure 7. Expression of glycine and GABA receptor subunits.
A, RT-PCR detected GABA receptor α1, α2, α3, α4 and α5 and glycine receptor α2 and α3 expression in the GLUTag cell line, but not GABA receptor α6 and glycine receptor α1. Expression of all α subunits was detectable when whole mouse brain RNA was used as a template (right-hand side) and no bands were detectable when H2O was used as a template (not shown). Predicted band sizes are as indicated. The marker in the centre lane of the gel has a band every 100 bp from 200 to 1000 bp. B, nested RT-PCR detected GABA receptor ρ1, ρ2 and ρ3 subunit expression in the GLUTag cell line, and ρ1 and ρ2 subunit in mouse brain. Predicted band sizes are as indicated. The marker in the centre lane of the gel has a band every 100 bp from 200 to 1000 bp.
GLP-1 secretion
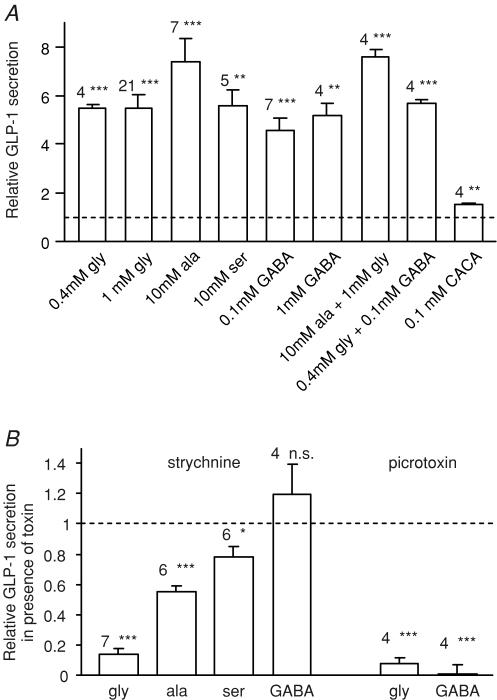
To further characterize GLUTag responses to glycine and GABA receptor activation, we measured GLP-1 release from cells incubated in Hepes-buffered saline containing different glycine and GABA receptor agonists (Fig. 8A). Glycine (0.4 and 1 mm), serine (10 mm) and GABA (0.1 and 1 mm) each stimulated GLP-1 release to a similar degree, whereas alanine (10 mm) was more potent. The GABAC selective agonist, CACA (0.1 mm), also stimulated GLP-1 release, but was less effective than GABA. Combinations of glycine (0.4 mm) plus GABA (0.1 mm), or glycine (1 mm) plus alanine (10 mm), were no more effective than 0.4 mm glycine or 10 mm alanine alone. The non-additive effects of glycine and GABA may explain a previous report that 0.1 mm GABA did not trigger GLP-1 release from GLUTag cells in the presence of DMEM (Brubaker et al. 1998), since 0.4 mm glycine is one of the standard components of this medium. Strychnine largely abolished the response to 1 mm glycine, and partially impaired the responses to 10 mm alanine and serine (Fig. 8B), indicating that glycine receptor-dependent mechanisms contribute to the effects of these three amino acids, but that alanine and serine also have glycine receptor-independent effects at these concentrations. Strychnine did not impair GABA-triggered secretion. Picrotoxin inhibited both glycine and GABA triggered GLP-1 release, consistent with its inhibitory effect on the intracellular Ca2+ responses.
Figure 8. GLP-1 secretion triggered by glycine and GABA receptor agonists.
A, GLP-1 secretion from GLUTag cells incubated for 2 h in standard bath solution containing glycine, alanine, serine, GABA or CACA at the concentrations indicated, either alone or in combination. Secretion was normalized to the baseline release in the absence of nutrients measured in parallel on the same day (mean baseline secretion 16 ± 1 fmol per well per 2 h). The number of wells is indicated above each bar. Statistical significance was tested by single-sample t test: **P < 0.01, ***P < 0.001. B, inhibition of amino acid triggered GLP-1 release by strychnine (10 μm) or picrotoxin (100 μm). GLP-1 released by addition of amino acid plus toxin is expressed relative to that released by the corresponding amino acid alone, applied in parallel on the same day. The number of wells is indicated above each bar. Statistical significance was tested by single sample t test; *P < 0.05, ***P < 0.001; n.s., not significant.
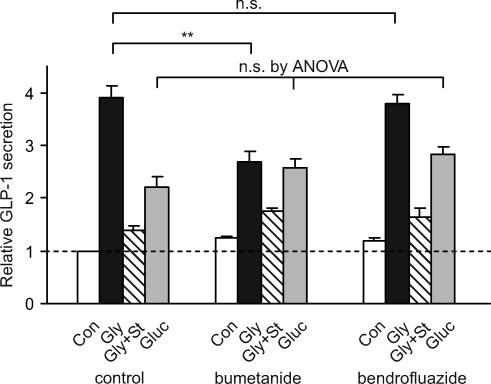
The stimulatory response to GABA and glycine receptor activation indicates that the electrochemical gradient in GLUTag cells favours Cl− efflux, and that the cells must therefore possess an active uptake mechanism for Cl− ions. Two Cl− transporters that are commonly found in epithelial cells are the bumetanide-sensitive Na+–K+–2Cl− cotransporter and the thiazide-sensitive Na+–Cl− cotransporter, both of which make use of the Na+ gradient to drive Cl− uptake. To investigate whether either of these transporters is involved in concentrating Cl− in GLUTag cells, we preincubated cells overnight with either bumetanide or bendrofluazide to allow time for Cl− gradients to dissipate, before testing their secretory response to either glycine or glucose (Fig. 9). Whereas bumetanide significantly impaired the response to glycine without affecting glucose-stimulated GLP-1 release, bendrofluazide was without effect. The results therefore suggest that Cl− uptake by the bumetanide sensitive Na+–K+–2 Cl− cotransporter is involved in maintaining the Cl− gradient in GLUTag cells.
Figure 9. Effect of diuretics on glycine-triggered GLP-1 release.
GLUTag cells were cultured overnight with bendrofluazide (50 μm), bumetanide (10 μm) or no diuretic added to the standard culture medium. GLP-1 secretion was measured the following day in response to a 2 h incubation period in standard bath solution containing the same diuretic (or no diuretic) and either glucose (Gluc, 10 mm), glycine (Gly, 1 mm), glycine plus strychnine (Gly + St, 1 mm and 10 μm), or no additions (Con) (n = 4 for each). Secretion was normalized to the baseline release in the absence of nutrients and diuretics measured in parallel on the same day. Statistical significance was tested firstly by ANOVA, and subsequently by Student's unpaired t test, if appropriate; **P < 0.01; n.s., not significant.
Discussion
In the present study we show that GLUTag cells express functional glycine and ionotropic GABA receptors, which mediate the depolarizing responses to a variety of amino acids, including glycine, alanine, serine and GABA. Activation of either of these ligand-gated Cl− channels resulted in membrane depolarization, opening of voltage-gated Ca2+ channels, an increase in intracellular [Ca2+], and the consequent triggering of GLP-1 release. The currents triggered by glycine and GABA differed both in magnitude and Na+ dependence from those previously reported for glutamine and asparagine (Reimann et al. 2004), in support of the idea that the underlying mechanism is distinct. Thus, whereas glutamine triggered a Na+-dependent current of ∼−3 pA per cell, glycine and GABA triggered Na+-independent currents of ∼−400 and −30 pA per cell at −70 mV, respectively. The involvement of glycine and GABA receptors was established by their inhibition by strychnine and picrotoxin, respectively, and their dependence on intracellular and extracellular Cl− concentrations.
Involvement of glycine and GABA receptors in GLP-1 release has not previously been demonstrated, although GABAA receptor agonists have been shown to trigger Cl− currents and CCK release from the enteroendocrine cell line STC-1 (Glassmeier et al. 1998). The present finding that GABA triggers GLP-1 release from GLUTag cells contrasts with previous reports that GABA was not found to be a secretagogue in either perfused intestine or GLUTag cells (Herrmann-Rinke et al. 1995; Brubaker et al. 1998). In the perfused intestine, however, it is possible that GABA responses were masked by the use of the GABAA receptor agonist, pentobarbitol, as the anaesthetic for the surgical preparation. In the GLUTag cells, the previously reported lack of effect of GABA on GLP-1 release may be explained by the finding that 0.1 mm GABA did not further enhance secretion when added with 0.4 mm glycine, a normal constituent of the DMEM used as an incubation buffer in the previous experiments. The ability of both GABA and glycine receptor agonists to act as GLP-1 secretagogues in GLUTag cells is supported by the intracellular Ca2+ responses, which peaked at ∼6 μm in response to glycine and GABA, approximately five times higher than the levels reached in 10 mm glutamine (Reimann et al. 2004).
There is a large body of evidence supporting a role for GABAergic neurotransmission in the enteric nervous system (Krantis, 2000). GABA has been identified in 5–8% of myenteric nerves, including fibres that ramify around the mucosal crypts, and is also localized in mucosal endocrine-like cells in the rat (Krantis et al. 1994). Whereas GABAA receptor activation in the central nervous system is frequently associated with inhibitory (hyperpolarizing) responses (Owens & Kriegstein, 2002), however, GABAA responses in enteric nerves, as in GLUTag cells, were found to be depolarizing. The pharmacology of the GABA responses in GLUTag cells suggests the presence of both GABAA and GABAC receptors, as supported by the identification of GABA receptor α1−5 and ρ1−3 subunits by RT-PCR. Although it appears surprising that the intracellular [Ca2+] response to GABA was almost completely abolished by the specific GABAA receptor antagonist bicuculline, despite the evidence suggesting that GABAC receptor activation contributes to the GABA response, similar findings in neurones have recently led to the proposal that GABAA and GABAC receptor subunits can coassemble to form heteromeric channels with mixed properties (Hartmann et al. 2004; Milligan et al. 2004). Both GABAA and GABAC receptors have also been identified in the enteroendocrine cell line, STC-1 (Glassmeier et al. 1998; Jansen et al. 2000).
Glycinergic neurotransmission, by contrast, has not been documented in the enteric nervous system, although stimulatory responses to exogenous glycine have been detected in studies of myenteric neurones from adult guinea pigs (Neunlist et al. 2001). Expression of the glycine transporter GLYT1, which is often localized in proximity to sites of glycinergic transmission in the CNS, has also been detected in human intestine and the enterocyte cell line Caco-2 (Christie et al. 2001). The composition of glycine receptors varies according to the stage of development and location, with the classical adult neuronal receptors generally having a heteromeric composition of α and β subunits, and receptors in immature neurones comprising α2 homomers (Lynch, 2004). Although picrotoxin is not a potent inhibitor of adult neuronal glycine receptors, it inhibits channels comprised of homomeric α2 subunits (Pribilla et al. 1992). The picrotoxin sensitivity of glycine-induced Ca2+ transients and secretion in GLUTag cells would therefore suggest a homomeric α2 composition, as also suggested previously for myenteric neurones (Neunlist et al. 2001). This idea is supported by the identification of glycine receptor α2 and α3 subunits in GLUTag cells by RT-PCR. Similar to the responses we observed in GLUTag cells, glycine receptors have also been identified in the pancreatic cell line GK-P3 where their activation resulted in membrane depolarization and Ca2+ entry (Weaver et al. 1998).
Glycine and GABA receptors have diverse physiological roles, as their activation can result in either membrane hyperpolarization or depolarization, depending on the direction of the Cl− gradient across the plasma membrane. Excitatory responses to glycine and GABA, as observed in GLUTag cells, indicate that receptor activation triggers Cl− efflux, and that the cells must therefore possess a mechanism to concentrate Cl− in the cytoplasm. As overnight preincubation with the loop diuretic bumetanide impaired the GLP-1 secretory response to glycine without affecting glucose-triggered secretion, the results suggest that high intracellular Cl− concentrations in GLUTag cells are maintained by the bumetanide-sensitive Na+–K+–2Cl− cotransporter. This transporter is known to play a role in intestinal transepithelial Cl− fluxes (Haas, 1994) and was also implicated in Cl− accumulation by myenteric neurones (Neunlist et al. 2001). Although the Na+ dependence of the Cl− transporter suggests that responses to glycine and GABA receptor ligands might also be Na+ dependent, there would be no predicted immediate effect on Cl− currents of blocking Na+-dependent Cl− influx because of the large reservoir of intracellular Cl− ions.
Physiological role of glycine and GABA responses
In human studies, oral amino acids were found to be a potent trigger of GLP-1 release (Herrmann et al. 1995), although it remains unclear whether amino acids stimulate L-cells directly or activate a neuronal or hormonal pathway. The identification of functional glycine and GABA receptors in GLUTag cells suggests that glycinergic and GABAergic signalling pathways may play a role in regulating GLP-1 release from L-cells. As GABA is a recognized neurotransmitter of the enteric nervous system, activation of GABAA receptors on the L-cell might contribute to neural stimulation of GLP-1 release. Glycinergic nerves have not, however, been identified in the enteric nervous system, and although glycinergic responses have been observed in myenteric neurones, strychnine did not interfere with synaptic transmission, leading the authors to suggest that these neurones might respond directly to dietary amino acids (Neunlist et al. 2001). The similarity between the measured EC50 of glycine receptors and normal plasma glycine concentrations (∼0.2 mm, Gannon et al. 2002), raises the possibility that glycine receptors on L-cells might similarly respond to dietary amino acids such as glycine, alanine and serine.
Acknowledgments
We thank Daniel Drucker (Toronto) for permission to work with GLUTag cells. F. M. Gribble is a Wellcome Trust Senior Research Fellow in Clinical Science and F. Reimann is a Diabetes UK R. D. Lawrence Fellow. Their work was also supported by the equipment grant BDA: RD02/0002539.
References
- Bormann J, Hamill OP, Sakmann B. Mechanism of anion permeation through channels gated by glycine and gamma-aminobutyric acid in mouse cultured spinal neurones. J Physiol. 1987;385:243–286. doi: 10.1113/jphysiol.1987.sp016493. [DOI] [PMC free article] [PubMed] [Google Scholar]
- Brubaker PL, Drucker DJ. Glucagon-like peptides regulate cell proliferation and apoptosis in the pancreas, gut, and central nervous system. Endocrinology. 2004;145:2653–2265. doi: 10.1210/en.2004-0015. [DOI] [PubMed] [Google Scholar]
- Brubaker PL, Schloos J, Drucker DJ. Regulation of glucagon-like peptide-1 synthesis and secretion in the GLUTag enteroendocrine cell line. Endocrinology. 1998;139:4108–4114. doi: 10.1210/endo.139.10.6228. [DOI] [PubMed] [Google Scholar]
- Chebib M. GABAC receptor ion channels. Clin Exp Pharmacol Physiol. 2004;31:800–804. doi: 10.1111/j.1440-1681.2004.04083.x. [DOI] [PubMed] [Google Scholar]
- Christie GR, Ford D, Howard A, Clark MA, Hirst BH. Glycine supply to human enterocytes mediated by high-affinity basolateral GLYT1. Gastroenterology. 2001;120:439–448. doi: 10.1053/gast.2001.21207. [DOI] [PubMed] [Google Scholar]
- Drucker DJ. Biological actions and therapeutic potential of the glucagon-like peptides. Gastroenterology. 2002;122:531–544. doi: 10.1053/gast.2002.31068. [DOI] [PubMed] [Google Scholar]
- Drucker DJ, Jin T, Asa SL, Young TA, Brubaker PL. Activation of proglucagon gene transcription by protein kinase A in a novel mouse enteroendocrine cell line. Mol Endocrinol. 1994;8:1646–1655. doi: 10.1210/mend.8.12.7535893. [DOI] [PubMed] [Google Scholar]
- Edwards CM. GLP-1: target for a new class of antidiabetic agents? J R Soc Med. 2004;97:270–274. doi: 10.1258/jrsm.97.6.270. [DOI] [PMC free article] [PubMed] [Google Scholar]
- Eissele R, Göke R, Willemer S, Harthus HP, Vermeer H, Arnold R, Göke B. Glucagon-like peptide-1 cells in the gastrointestinal tract and pancreas of rat, pig and man. Eur J Clin Invest. 1992;22:283–291. doi: 10.1111/j.1365-2362.1992.tb01464.x. [DOI] [PubMed] [Google Scholar]
- Galligan JJ. Ligand-gated ion channels in the enteric nervous system. Neurogastroenterol Motil. 2002;14:611–623. doi: 10.1046/j.1365-2982.2002.00363.x. [DOI] [PubMed] [Google Scholar]
- Gannon MC, Nuttall JA, Nuttall FQ. The metabolic response to ingested glycine. Am J Clin Nutr. 2002;76:1302–1307. doi: 10.1093/ajcn/76.6.1302. [DOI] [PubMed] [Google Scholar]
- Glassmeier G, Herzig KH, Hopfner M, Lemmer K, Jansen A, Scherubl H. Expression of functional GABAA receptors in cholecystokinin-secreting gut neuroendocrine murine STC-1 cells. J Physiol. 1998;510:805–814. doi: 10.1111/j.1469-7793.1998.805bj.x. [DOI] [PMC free article] [PubMed] [Google Scholar]
- Gribble FM, Williams L, Simpson AK, Reimann F. A novel glucose-sensing mechanism contributing to glucagon-like peptide-1 secretion from the GLUTag cell line. Diabetes. 2003;52:1147–1154. doi: 10.2337/diabetes.52.5.1147. [DOI] [PubMed] [Google Scholar]
- Gromada J, Brock B, Schmitz O, Rorsman P. Glucagon-like peptide-1: regulation of insulin secretion and therapeutic potential. Basic Clin Pharmacol Toxicol. 2004;95:252–262. doi: 10.1111/j.1742-7843.2004.t01-1-pto950502.x. [DOI] [PubMed] [Google Scholar]
- Grynkiewicz G, Poenie M, Tsien RY. A new generation of Ca2+ indicators with greatly improved fluorescence properties. J Biol Chem. 1985;260:3440–3450. [PubMed] [Google Scholar]
- Haas M. The Na–K–Cl cotransporters. Am J Physiol. 1994;267:C869–C885. doi: 10.1152/ajpcell.1994.267.4.C869. [DOI] [PubMed] [Google Scholar]
- Hartmann K, Stief F, Draguhn A, Frahm C. GABA receptors with mixed pharmacological properties of GABAA and GABAC receptors. Eur J Pharmacol. 2004;497:139–146. doi: 10.1016/j.ejphar.2004.06.044. [DOI] [PubMed] [Google Scholar]
- Herrmann C, Göke R, Richter G, Fehmann HC, Arnold R, Göke B. Glucagon-like peptide-1 and glucose-dependent insulin-releasing polypeptide plasma levels in response to nutrients. Digestion. 1995;56:117–126. doi: 10.1159/000201231. [DOI] [PubMed] [Google Scholar]
- Herrmann-Rinke C, Vöge A, Hess M, Göke B. Regulation of glucagon-like peptide-1 secretion from rat ileum by neurotransmitters and peptides. J Endocrinol. 1995;147:25–31. doi: 10.1677/joe.0.1470025. [DOI] [PubMed] [Google Scholar]
- Holst JJ. Therapy of type 2 diabetes mellitus based on the actions of glucagon-like peptide-1. Diabetes Metab Res Rev. 2002;18:430–441. doi: 10.1002/dmrr.328. [DOI] [PubMed] [Google Scholar]
- Jansen A, Hoepfner M, Herzig KH, Riecken EO, Scherubl H. GABAC receptors in neuroendocrine gut cells: a new GABA-binding site in the gut. Pflugers Arch. 2000;441:294–300. doi: 10.1007/s004240000412. [DOI] [PubMed] [Google Scholar]
- Kieffer TJ, Habener JF. The glucagon-like peptides. Endocr Rev. 1999;20:876–913. doi: 10.1210/edrv.20.6.0385. [DOI] [PubMed] [Google Scholar]
- Krantis A. GABA in the mammalian enteric nervous system. News Physiol Sci. 2000;15:284–290. doi: 10.1152/physiologyonline.2000.15.6.284. [DOI] [PubMed] [Google Scholar]
- Krantis A, Tufts K, Nichols K, Morris GP. [3H]GABA uptake and GABA localization in mucosal endocrine cells of the rat stomach and colon. J Auton Nerv Syst. 1994;47:225–232. doi: 10.1016/0165-1838(94)90183-x. [DOI] [PubMed] [Google Scholar]
- Li Y, Wu LJ, Legendre P, Xu TL. Asymmetric cross-inhibition between GABAA and glycine receptors in rat spinal dorsal horn neurons. J Biol Chem. 2003;278:38637–38645. doi: 10.1074/jbc.M303735200. [DOI] [PubMed] [Google Scholar]
- Lynch JW. Molecular structure and function of the glycine receptor chloride channel. Physiol Rev. 2004;84:1051–1095. doi: 10.1152/physrev.00042.2003. [DOI] [PubMed] [Google Scholar]
- Milligan CJ, Buckley NJ, Garret M, Deuchars J, Deuchars SA. Evidence for inhibition mediated by coassembly of GABAA and GABAC receptor subunits in native central neurons. J Neurosci. 2004;24:7241–7450. doi: 10.1523/JNEUROSCI.1979-04.2004. [DOI] [PMC free article] [PubMed] [Google Scholar]
- Neunlist M, Michel K, Reiche D, Dobreva G, Huber K, Schemann M. Glycine activates myenteric neurones in adult guinea-pigs. J Physiol. 2001;536:727–739. doi: 10.1111/j.1469-7793.2001.00727.x. [DOI] [PMC free article] [PubMed] [Google Scholar]
- Nilsson O, Bilchik AJ, Goldenring JR, Ballantyne GH, Adrian TE, Modlin IM. Distribution and immunocytochemical colocalization of peptide YY and enteroglucagon in endocrine cells of the rabbit colon. Endocrinology. 1991;129:139–148. doi: 10.1210/endo-129-1-139. [DOI] [PubMed] [Google Scholar]
- Owens DF, Kriegstein AR. Is there more to GABA than synaptic inhibition? Nat Rev Neurosci. 2002;3:715–727. doi: 10.1038/nrn919. [DOI] [PubMed] [Google Scholar]
- Pribilla I, Takagi T, Langosch D, Bormann J, Betz H. The atypical M2 segment of the beta subunit confers picrotoxinin resistance to inhibitory glycine receptor channels. EMBO J. 1992;11:4305–4311. doi: 10.1002/j.1460-2075.1992.tb05529.x. [DOI] [PMC free article] [PubMed] [Google Scholar]
- Reimann F, Gribble FM. Glucose sensing in GLP-1 secreting cells. Diabetes. 2002;51:2757–2763. doi: 10.2337/diabetes.51.9.2757. [DOI] [PubMed] [Google Scholar]
- Reimann F, Maziarz M, Flock G, Habib AM, Drucker DJ, Gribble FM. Characterisation and functional role of voltage gated cation conductances in the glucagon-like peptide-1 secreting GLUTag cell line. J Physiol. 2005;563:161–175. doi: 10.1113/jphysiol.2004.076414. [DOI] [PMC free article] [PubMed] [Google Scholar]
- Reimann F, Williams L, da Silva Xavier G, Rutter GA, Gribble FM. Glutamine potently stimulates glucagon-like peptide-1 secretion from GLUTag cells. Diabetologia. 2004;47:1592–1601. doi: 10.1007/s00125-004-1498-0. [DOI] [PubMed] [Google Scholar]
- Rocca AS, Brubaker PL. Role of the vagus nerve in mediating proximal nutrient-induced glucagon-like peptide-1 secretion. Endocrinology. 1999;140:1687–1694. doi: 10.1210/endo.140.4.6643. [DOI] [PubMed] [Google Scholar]
- Schmieden V, Kuhse J, Betz H. A novel domain of the inhibitory glycine receptor determining antagonist efficacies: further evidence for partial agonism resulting from self-inhibition. Mol Pharmacol. 1999;56:464–472. doi: 10.1124/mol.56.3.464. [DOI] [PubMed] [Google Scholar]
- Small CJ, Bloom SR. Gut hormones and the control of appetite. Trends Endocrinol Metab. 2004;15:259–263. doi: 10.1016/j.tem.2004.06.002. [DOI] [PubMed] [Google Scholar]
- Weaver CD, Partridge JG, Yao TL, Moates JM, Magnuson MA, Verdoorn TA. Activation of glycine and glutamate receptors increases intracellular calcium in cells derived from the endocrine pancreas. Mol Pharmacol. 1998;54:639–646. [PubMed] [Google Scholar]


