Abstract
Long-QT3 syndrome (LQT3) is linked to cardiac sodium channel gene (SCN5A) mutations. In this study, we used the ‘dynamic action potential clamp’ (dAPC) technique to effectively replace the native sodium current (INa) of the Priebe–Beuckelmann human ventricular cell model with wild-type (WT) or mutant INa generated in a human embryonic kidney (HEK)-293 cell that is voltage clamped by the free-running action potential of the ventricular cell. We recorded INa from HEK cells expressing either WT or LQT3-associated Y1795C or A1330P SCN5A at 35°C, and let this current generate and shape the action potential (AP) of subepicardial, mid-myocardial and subendocardial model cells. The HEK cell's endogenous background current was completely removed by a real-time digital subtraction procedure. With WT INa, AP duration (APD) was longer than with the original Priebe–Beuckelmann model INa, due to a late INa component of ∼30 pA that could not be revealed with conventional voltage-clamp protocols. With mutant INa, this late component was larger (∼100 pA), producing a marked increase in APD (∼70–80 ms at 1 Hz for the subepicardial model cell). The late INa magnitude showed reverse frequency dependence, resulting in a significantly steeper APD–frequency relation in the mutant case. AP prolongation was more pronounced for the mid-myocardial cell type, resulting in increased APD dispersion for each of the mutants. For both mutants, a 2 s pause following rapid (2 Hz) pacing resulted in distorted AP morphology and beat-to-beat fluctuations of INa. Our dAPC data directly demonstrate the arrhythmogenic nature of LQT3-associated SCN5A mutations.
The human cardiac Na+ channel (hH1), encoded by the SCN5A gene, is primarily responsible for the initiation and propagation of cardiac action potentials (APs). Mutations in SCN5A have long been known to cause a variety of cardiac rhythm disorders, including type 3 of the congenital long-QT (LQT3) syndrome (Jiang et al. 1994; Wang et al. 1995). It is accepted that the LQT3 arises from a delayed repolarization of the ventricular myocytes, due to a shift in the delicate balance between inward and outward currents during the plateau of the AP (Bennett et al. 1995), leading to an increased propensity for ventricular tachyarrhythmias and sudden arrhythmic death (Moss et al. 1995); for instance, an increase of Na+ influx during depolarized membrane potentials is proposed to impair membrane repolarization, and thus render APs more prolonged.
At present, most effort has been devoted to documenting the effects of identified mutations on amplitudes and kinetics of various sodium currents (INa) upon heterologous expression, and the consequences of channelopathies for cardiac function are inferred by extrapolation (Wehrens et al. 2002). Advanced computer models of the ventricular AP can link a genetic defect to its cellular phenotype in a cardiac arrhythmia (Clancy & Rudy, 1999). However, since voltage-gated cardiac Na+ channels (NaV1.5) are often studied under conditions that severely affect gating (e.g. room temperature), the mathematical description of channel kinetics can be difficult when mutations have subtle effects on INa. Furthermore, the time-course of INa during square voltage-clamp steps is different from what is recorded during an AP. This is explained by the fact that NaV1.5 channels not only open and inactivate rapidly during depolarization, but also reopen during the plateau and repolarization phases, carrying ‘persistent’ or ‘late’ inward current (late INa). Late INa has been demonstrated in cardiac ventricular specimens of various mammalian species including humans (Maltsev et al. 1998), and its role has been documented in the generation of normal as well altered AP durations. Recent studies strongly suggest that complex features of SCN5A channel kinetics can best be studied during physiological voltage waveforms (Clancy et al. 2003; Magyar et al. 2004).
With the dynamic action potential clamp (dAPC) technique (Berecki et al. 2005), the contribution of wild-type (WT) and mutated channels to the AP morphology can be determined without making assumptions regarding kinetic properties of the channels. With the dAPC approach, the original INa of a ventricular cell can effectively be replaced by INa recorded from a transfected human embryonic kidney (HEK)-293 cell that is voltage clamped by the free-running AP of the ventricular cell. To this end, INa of the Priebe–Beuckelmann (PB) human ventricular cell model (Priebe & Beuckelmann, 1998) is replaced with HEK cell INa applied to the ventricular cell model as an external current input. When WT HEK cell INa is added to the net membrane current of this ventricular cell, the resulting AP should be considered as ‘normal’, whereas a mutant HEK cell INa should cause distortion of the AP.
We hypothesize that rapid and refined interpretation of the altered SCN5A channel function and changed AP morphology is possible with an experimental setting in which mutant channels are allowed to follow a ‘natural’ time-course of membrane potential (Vm) change, while they are simultaneously allowed to contribute current to the AP as they would have when incorporated into a real ventricular cell. In this study, we assess the functional implications of Y1795C and A1330P missense mutations, associated with ‘classic’ LQT3 gain-of-function phenotypes caused by distinct molecular mechanisms: the Y1795C mutation (substitution of a tyrosine by a cysteine) leads to dysfunction by slowing the onset of inactivation and causing channel bursting that significantly increases late INa at depolarized membrane potentials (Rivolta et al. 2001; Clancy et al. 2002), while the A1330P mutation (substitution of an alanine to proline) results in a positive shift in the voltage dependence of inactivation, a slowing of the time-course of inactivation, and a faster recovery from inactivation rather than a late INa (Wedekind et al. 2001). These changes in kinetics are thought to severely disrupt cellular repolarization and lead to AP prolongation. Computer simulations (Clancy et al. 2002) based on the ‘dynamic Luo-Rudy’ (LRd) model of a ventricular cell suggest that the Y1795C mutation, if expressed homozygously, increases APD by 10–25 ms (at 2 and 1 Hz, respectively).
We took advantage of the dAPC approach to directly establish effects of various clinically relevant stimulation frequencies, as well the consequence of a pause, on AP morphology and on the time-course and magnitude of late INa during the plateau and repolarizing phases of the AP.
Methods
Plasmid construction
Site-directed (tyrosine to cysteine) mutagenesis was performed on the SCN5Aα-subunit cDNA cloned into pSP64T. The Y1795C cDNA was then subcloned using the HindIII–XbaI sites of the expression vector pCGI for bicistronic expression of the channel protein and GFP reporter in HEK cells. The A1330P cDNA was prepared as previously described (Wedekind et al. 2001). To express WT or mutant hH1, HEK cells were transiently cotransfected with 1 μg of Na+ channel α-subunit cDNA and 1 μg hβ1-subunit cDNA using lipofectamine (Gibco BRL, Life Technologies, Scotland) and cultured at 37°C.
Electrophysiology
HEK cells were superfused with a solution containing (mm): NaCl 140, CsCl 10, CaCl2 2, MgCl2 1, glucose 5, sucrose 10, Hepes 10 (pH 7.4 with NaOH). Patch pipettes (1–1.2 MΩ tip resistance) were filled with a solution containing (mm): CsCl 10, CsF 110, NaF 10, EGTA 11, CaCl2 1, MgCl2 1, Na2ATP 2, Hepes 10 (pH 7.3 with CsOH). The pH of solutions was corrected for temperature; potentials were corrected for liquid junction potential; and osmolarity was measured with a semimicro osmometer (Knauer, Berlin). Membrane currents were recorded with an Axopatch 200B amplifier (Axon Instruments, Inc., Union City, CA, USA) in the whole-cell configuration of the patch-clamp technique, at 35 ± 0.5°C. Series resistance (Rs) values, typically of 2–2.5 MΩ, were 90–95% compensated. To minimize possible voltage errors, small HEK cells of 8–12 pF cell capacitance (Cm= 10.4 ± 0.04, n = 33), expressing peak INa amplitudes < 10 nA were selected (Nagatomo et al. 1998). With the given Rs and Cm values, the true membrane potential could be established within about 25 μs after the start of the step command without overshoot or ringing (Sigworth, 1983), fast enough to voltage clamp rapid ionic currents. The estimated residual (uncompensated) Rs of < 200 kΩ could theoretically cause a < 2 mV voltage error in the membrane potential relative to the command potential in the presence of 10 nA amplitude INa. Currents and potentials were low-pass filtered (cut-off frequency 5 or 10 kHz) and digitized at 20 kHz. Voltage control, data acquisition and analysis were accomplished using custom software. In the experiments using TTX, INa was determined as the current blocked by 50 μm TTX (Alomone Laboratories, Israel). Only those data were analysed in which no shift in holding current at −90 mV was observed during TTX superfusion. To quantify late INa, the largest inward current amplitude was measured during a sustained step depolarization or during phase 2 (plateau) or 3 (rapid repolarization) of the AP.
Dynamic action potential clamp
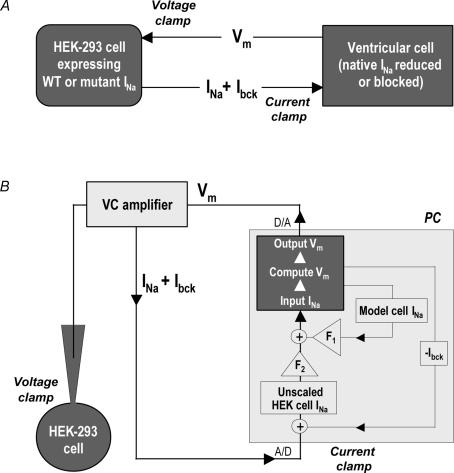
The overall design of the dAPC technique is represented in Fig. 1A. A single cardiac ventricular cell and a transfected HEK cell can be electrically coupled by means of an electrical circuit. The ventricular cell is in current clamp mode on one patch-clamp setup, whereas the HEK cell is in voltage-clamp mode on another setup. The command potential for the HEK cell is the free-running Vm of the ventricular cell (‘action potential clamp’), and the input INa applied to the ventricular cell is the INa recorded from the transfected HEK cell, a connection resulting in the dAPC condition (Berecki et al. 2005). We used the model cell variant of the dAPC technique (Fig. 1B) to (partly) replace the INa of the human ventricular PB cell model with transiently expressed SCN5A INa (see below). DynaClamp, the user program for dAPC, allows a guaranteed-timing real-time process (i.e. 40 μs periodic time steps with the PB cell model), and allows scaling of the model cell currents and that of input INa to any desired magnitude. In the original PB cell model, peak amplitude of the native INa during the AP upstroke is ∼58.3 nA (380 A F−1, at 1 Hz) and the late INa component is not implemented. Reducing the ventricular cell's original (peak) INa density by 34% or 60% results in proportionate model cell AP upstroke velocity decreases. At the same time, these gradual INa-density reductions do not have APD-shortening effects at physiologically relevant stimulation rates (see Supplemental Fig. S1). In all dAPC experiments, we used 40% of model cell INa density (152 A F−1, at 1 Hz), combined with the implemented HEK cell (input) INa, the peak amplitude of which was up scaled to ∼20 nA (∼130 A F−1). The resulting (combined) INas provided realistic rates of membrane depolarizations (Table 1) and approach the heterozygous INa expression in carriers of LQT3 mutations. When scaling input INa, we first determined the maximal INa amplitude in voltage-clamped HEK cells during 30 ms depolarizing voltage steps to voltages ranging from −60 to +10 mV (from a holding potential, Vhold=−90 mV, in 10 mV steps). Here, graded activation of the INa during voltage steps also served as an index for reliable voltage control (Nagatomo et al. 1998). We then used the largest INa amplitude value to estimate the scaling factor (F2) for current input to the PB model cell (Fig. 1B). In order to minimize the endogenous HEK cell ‘background’ currents (Ibck), as well as noise from several sources including the operational amplifier and associated circuitry, F2 values were kept below 3. Experiments requiring F2 > 3 were rejected. To further improve recording conditions, it proved necessary to develop a procedure to compute and real-time subtract Ibck (see Results). Having completed the described preparative steps, the program could establish dAPC configuration between the ventricular cell and the HEK cell. For this, a series of 2 ms, 4 nA, suprathreshold stimuli were applied to the ventricular cell model at a fixed rate, for 10 s. At each stimulus, the Vm of the HEK cell followed that of the model cell. Suprathreshold stimuli would thus generate INa in the HEK cell, which – along with 40% of original (cell model) INa– provided the inward current needed for the upstroke of the AP. Optionally, a 2 s pause was implemented during stimulation, starting at 5 s after onset of pacing. The combination of ionic currents of the model cell and WT INa of the HEK cell revealed APs, which could be considered as ‘normal’, representing healthy individuals. Using the same method for HEK cells containing mutant channels resulted in APs that were considered to be characteristic for cells from the ventricular tissue of a patient from which the mutant was derived.
Figure 1. Dynamic action potential clamp (dAPC) technique.
A, general experimental design. The cardiac ventricular cell is in current clamp. The SCN5A cDNA-transfected HEK cell is voltage clamped with Vm of the ventricular cell. INa from the HEK cell is continuously applied to the ventricular cell as an external current input, partly or entirely replacing INa in the myocyte. B, model cell mode of dAPC technique: after real-time digital subtraction of HEK cell Ibck, INa from the HEK cell is scaled by factor F2; model cell INa density is reduced to 40% of the original value (scaling factor F1). The INa of the PB model cell incorporates a ‘heterozygous’INa composed of reduced model cell INa and scaled HEK cell (input) INa(+). The Vm of the human ventricular cell model is computed in real time using the thus-obtained INa and applied as voltage-clamp command potential to the HEK cell, thus establishing dAPC.
Table 1.
Action potential parameters of the human ventricular ‘subepicardial’ model cell with WT, Y1795C, and A1330P INa
| 1 Hz | 2 Hz | |||||
|---|---|---|---|---|---|---|
| WT (n = 11) | Y1795C (n = 8) | A1330P (n = 6) | WT (n = 8) | Y1795C (n = 7) | A1330P (n = 6) | |
| Overshoot (mV) | 34.3 ± 0.7 | 33.8 ± 1.8 | 32.8 ± 0.8 | 33.2 ± 1.2 | 32.3 ± 1.4 | 30.8 ± 0.4 |
| MDP (mV) | −91.2 ± 0.1 | −91.8 ± 0.3 | −91.5 ± 0.3 | −90.2 ± 0.2 | −89.4 ± 0.4 | −90.5 ± 0.4 |
| APA (mV) | 125.5 ± 0.7 | 125.6 ± 2.0 | 124.3 ± 0.8 | 123.4 ± 1.1 | 121.7 ± 1.6 | 121.3 ± 0.7 |
| Vmax (V s−1) | 263.5 ± 7.7 | 262.5 ± 15.3 | 259.2 ± 8.5 | 251.3 ± 5.9 | 251.0 ± 9.9 | 248.0 ± 5.2 |
| APD20 (ms) | 6.4 ± 0.3 | 7.0 ± 0.8 | 7.3 ± 0.8 | 6.0 ± 0.3 | 7.3 ± 1.1 | 7.4 ± 0.9 |
| APD50 (ms) | 312.3 ± 3.2 | 389.9 ± 13.8* | 409.3 ± 19.7* | 281.5 ± 2.3 | 306.1 ± 7.3* | 301.1 ± 12.1 |
| APD90 (ms) | 404.7 ± 3.7 | 475.6 ± 16.1* | 486.0 ± 17.0* | 366.5 ± 1.8 | 401.2 ± 8.9* | 379.7 ± 9.8 |
| PA20 (mV) | 10.2 ± 0.1 | 11.6 ± 0.2* | 16.1 ± 0.9* | 10.4 ± 0.1 | 10.5 ± 0.2 | 14.8 ± 1.0* |
| PA60 (mV) | 18.0 ± 0.1 | 20.3 ± 0.6 | 25.6 ± 1.8* | 17.8 ± 0.2 | 17.3 ± 0.4 | 22.3 ± 1.5* |
MDP, maximum diastolic potential; APA, action potential amplitude; Vmax, maximum upstroke velocity; APD20, APD50, and APD90, AP duration at 20, 50, and 90% repolarization, respectively; PA20 and PA60, plateau amplitude at 20 and 60 ms repolarization, respectively. Values are mean ± s.e.m.
Significant difference versus control (P < 0.05 for mutant versus WT).
Statistics
All values are represented as mean ± s.e.m. (n, number of cells). Two sets of data are considered significantly different if P < 0.05 in unpaired Student's t test or in one-way analysis of variance (ANOVA) followed by pair-wise comparison using the Holm–Sidak test.
Results
Real-time digital subtraction of HEK-293 cell background currents (Ibck)
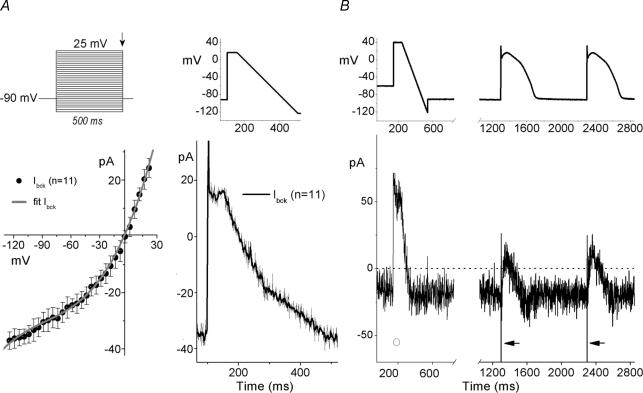
To adequately record and implement INa in dAPC experiments, Ibck-removal is essential. A large component of this current is carried through endogenous volume-regulated anion channels (Helix et al. 2003). A significant Ibck-reduction could first be obtained by adjusting the osmolarity of the extracellular solution with sucrose (to 310 mosmol l−1, slightly hypertonic with respect to the 290 mosmol l−1 pipette solution) (not shown). We used square wave as well as various ramp and AP-shaped protocols to characterize the remaining Ibck in empty and transfected HEK cells (Fig. 2). At −90 mV, in most HEK cells Ibck amplitude was < 40 pA (32.4 ± 3.4 pA, n = 11) (Fig. 2A). AP-like waveforms, consisting of a depolarizing step followed by a 0.43 V s−1 repolarizing ramp (‘step-ramp’), were applied at 1 s inter-ramp intervals. The averaged Ibck traces during the ramp, plotted against Vm (Fig. 2A, right) resulted in Ibck–V relationships similar to that obtained with step protocols (Fig. 2A, left), and were not influenced by lengthening (to 2 s) or shortening (to 0.2 s) of the interramp intervals (not shown). The average current-voltage (Ibck–V) relationship shows that Ibck is slightly outwardly rectifying, reverses around 0 mV, and can be well-described with a third order polynomial equation:
 |
(1) |
where Ibck is in picoamps, and Vm is in millivolts (Fig. 2A, left).
Figure 2. Square wave-, step-ramp-, and AP-elicited currents in HEK-293 cells.
A, Ibck in non-transfected HEK cells. Upper left panel depicts the voltage-step protocol; lower left panel shows the corresponding Ibck–V, determined from amplitudes at the end of the 500-ms voltage steps (arrow). The fit (continuous line) is a third-order polynomial equation (see text for details). A step-ramp waveform (upper right panel) was used to determine time-course of averaged Ibck (lower right panel). B, step-ramp and ‘subepicardial’-type AP-waveforms (top) to activate Ibck (bottom) in a WT SCN5A cDNA-transfected HEK cell (representative examples). Note the absence (○) and the presence (arrows) of fast INa, as a function of Vhold of −60 mV and −90 mV, respectively (see text for details). APs were generated using the PB model cell; broken line shows zero current level; peak INa is off scale.
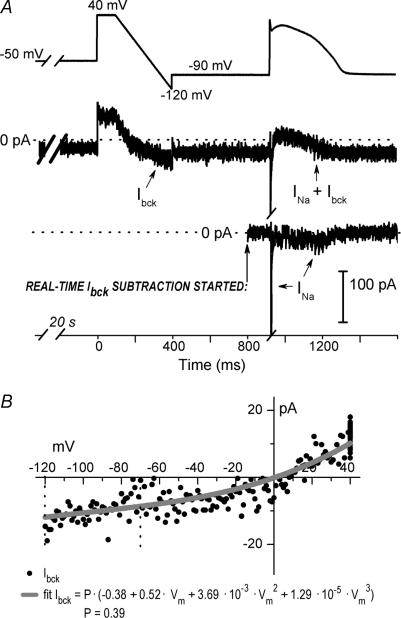
A step-ramp waveform, preceded by a 20 s voltage step to −50 or −60 mV, was implemented in dAPC experiments. The long depolarizing holding potential (Vhold) before the step-ramp served to inactivate INa (Fig. 2B and Supplemental Fig. S2), while the step-ramp allowed defining of Ibck–V relationships in (transfected) individual HEK cells. Figure 3 illustrates Ibck subtraction in a dAPC experiment. The ramp-evoked Ibck–V relationship is stored in a lookup table. Equation (1) is fitted to the data points between −120 and −70 mV, using a least squares fitting procedure and a scaling factor P as the only variable. Thus, the Ibck amplitude values for the whole voltage range are based on the scaled Ibck–V of non-transfected HEK cells (see Fig. 2A). This was done to avoid any possible interference of late INa for cases when INa inactivation during the 20 s Vhold of −60 or −50 mV was incomplete (see Supplemental Fig. S3). To assess the fit, offline results were generated in a separate file (Fig. 3B). In summary, when the program establishes dAPC condition, Ibck is characterized and then entirely subtracted from the input current, without affecting INa, including late components.
Figure 3. Real-time HEK-293 cell Ibck subtraction in a dAPC experiment, using a WT SCN5A cDNA-transfected HEK-293 cell.
A, step-ramp voltage protocol and the first AP elicited in a subepicardial model cell. The maximum diastolic potential (MDP) during dAPC was −90 mV (top); Middle: INa in the presence of Ibck (arrows) and after Ibck removal (bottom). Note the transient WT late INa during AP repolarization. Broken line shows zero current level. B, I–V relationship of Ibck in the experiment shown in A, fit with the scaled polynomial equation (P= 0.39) (see text for details).
Time-course of the WT and mutant Na+ currents
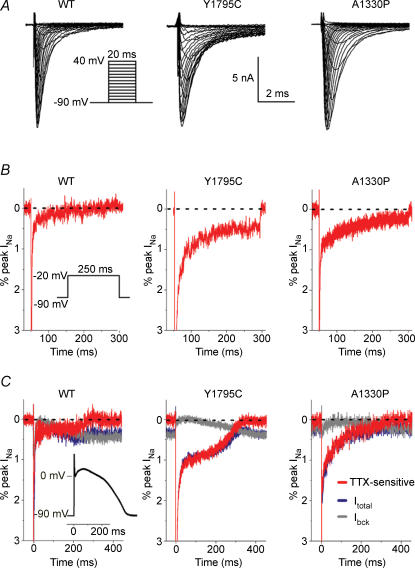
Transient transfections of WT or mutant sodium channel subunits into HEK cells resulted in variable ion channel protein expression levels, with the highest INa amplitudes often exceeding 10 nA. We studied these currents in a series of conventional whole-cell voltage clamp experiments, at 35°C (Fig. 4). To demonstrate the effects of AP morphology on INa, we compared pairs of current traces evoked by a step depolarization, and subsequently by a PB model cell AP waveform (AP clamp). INas were identified as TTX-sensitive current components obtained by digitally subtracting traces recorded before and after addition of 50 μm TTX. In these experiments, Ibck could also be identified as the TTX-resistant component. Within a cell, both depolarizing waveforms (step and AP) resulted in similar peak INa amplitudes (not shown). By using an AP waveform as voltage command, the TTX-sensitive late INa was detectable as an inward component during the plateau and repolarization phases in all tranfected cells. With a voltage step however, an inward late INa component could clearly be revealed only in cells transfected with the mutant channels.
Figure 4. Whole-cell currents in HEK-293 cells transfected with WT, Y1795C, or A1330P cDNAs.
A, representative INa traces. The voltage protocol is shown as an inset. Interpulse interval was 2 s. B, typical, 250 ms step depolarization-evoked TTX-sensitive whole-cell INa traces obtained by subtraction and plotted as percentage of peak INa; inset: protocol. Note that late INa is hardly detectable with WT SCN5A channels upon a step depolarization. Peak currents are off scale; broken lines indicate zero current level. C, superimposed tracing of AP clamp-evoked currents: control (Itotal, blue), TTX-resistant (Ibck, grey), and difference (TTX-sensitive, red). Currents were plotted as percentage of peak INa; to record WT and mutant INa traces, the same cells were used as in B; in all cases INa was ∼10 nA; peak currents are off scale; broken line shows zero current level. AP clamp waveform shown as inset.
Replacing INa of the ventricular model cell with wild-type or mutant INa
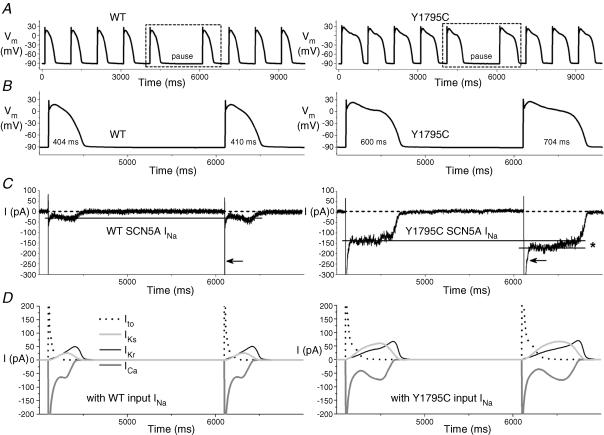
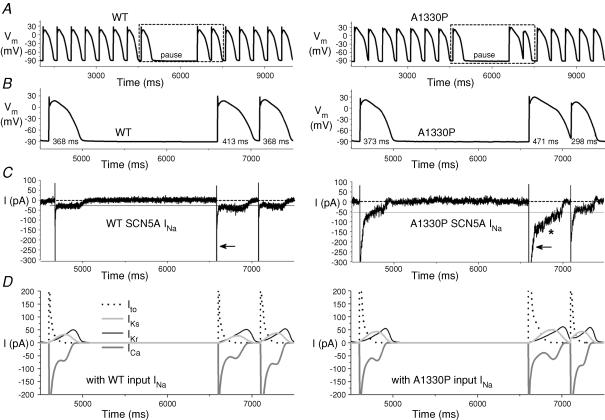
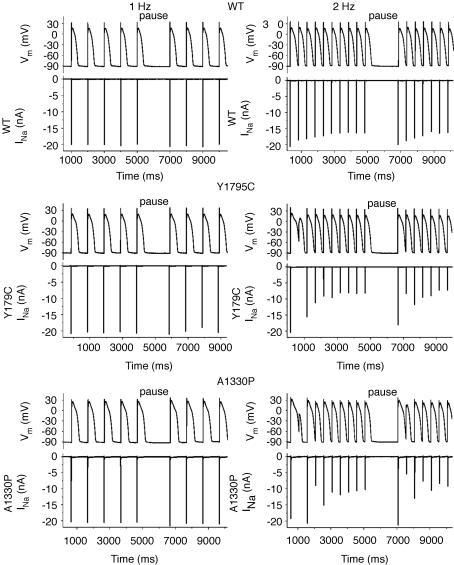
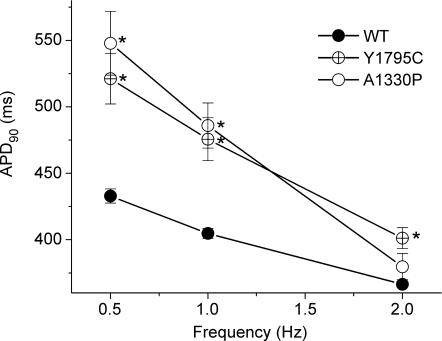
To study the functional consequences of the Y1795C and A1330P mutations, we performed dAPC experiments by implementing WT or mutant INa in ‘model cell mode’ (Fig. 1B). With WT INa, APs were considered as ‘normal’, although they exhibited longer AP durations (APDs) than those of the original PB model (where, e.g. APD90 is ∼355 ms at 1 Hz) (Table 1). The inward current responsible for the additional prolongation originates from WT NaV1.5 channel reopening that occurs under non-equilibrium conditions (Clancy et al. 2003); this mechanism is not implemented in the original PB model. To demonstrate that deleterious effects of LQT3 mutations preferentially occur at slow stimulation rates (Clancy et al. 2002; Nagatomo et al. 2002), and to investigate the effects of a pause on the APD and INa, we implemented a 2 s pause during pacing at various rates. The cellular repolarization–disruption effect of the Y1795C mutation is shown in Fig. 5. Time-course and amplitude of late INa show beat-to-beat fluctuations, probably due to the stochastic nature of NaV1.5 channel openings (Zaniboni et al. 2000). Consistent with the complex gating mechanism of NaV1.5 channels, both WT and mutant channels exhibit an inward late INa component during the AP plateau and repolarization phases. However, the Y1795C mutant clearly generates larger late INas (∼80–120 pA) and longer APDs than the WT (∼25–30 pA) (Fig. 5, Table 1). When the AP prolongs, several current components of the model cell also undergo changes (Fig. 5D) that contribute to the shift in balance between inward (increased ICa) and outward (e.g. increased IKs) currents. The AP-prolonging effect of the A1330P mutation was evident only at slower pacing (Table 1). The effect of this mutation was moderate at 2 Hz, but also here, pause-dependent prolongation was clearly revealed (Fig. 6). Late INa became larger as the stimulation rate was slowed or after a pause, exaggerating the extent of AP prolongation. In traditional voltage-clamp experiments carried out at room temperature, several LQT3 mutants, including the Y1795C, display a progressive reduction of peak INa at fast stimulation rates (Rivolta et al. 2001). This was confirmed also by our dAPC data at physiological temperature, which show that successive depolarizations within the pulse train result in a progressive decrease of the peak INa amplitudes to a (frequency-dependent) quasi steady-state value (Fig. 7). This decrease was more enhanced with mutant channels, suggesting a ‘more absorbing’ intermediate inactivation with both mutants. We analysed in detail AP characteristics of the epicardial model cell (Table 1), and plotted the frequency dependence of APD90 values generated with WT or mutant input INas. (Fig. 8). For both WT and mutant INas, APD90 values increased when pacing rate was reduced from 2 to 1 or 0.5 Hz as a result of adaptation (Franz et al. 1983). However, at 0.5 and 1 Hz, both mutations showed a more pronounced AP prolongation than WT, resulting in steeper APD–frequency relationships, demonstrating that deleterious effects preferentially occur at slow stimulation rates.
Figure 5. Dynamic action potential clamp with WT or Y1795C INa.
A, subepicardial cell APs elicited at 1 Hz before and after a 2 s pause. APs with mutant INa are prolonged compared to WT (see Table 1). B, boxed APs from A and associated INa in C, on expanded time scale. HEK cell INas were scaled to identical peak amplitudes (21 nA), and applied to the ‘subepicardial’ PB model cell as an external current input. Note that late INa-increase after the pause is more pronounced with the mutant (*). Broken line shows zero current level; peak INa is off scale; note the slower time-course of peak INa-inactivation of the mutant compared to the WT (arrows). D, relationship between the APs from B and selected membrane current components of the PB model cell, showing the changes in the time-course of transient outward K+ current (Ito), slowly and rapidly activating components of the delayed rectifier K+ current (IKs and IKr, respectively), and L-type Ca2+ current (ICa), along with changes in mutant INa.
Figure 6. Prolonging effects of the A1330P mutation are reduced at fast stimulation rate.
A, subepicardial cell APs generated with WT or A1330P INa, at 2 Hz. B, boxed APs from A and C, associated INas. After a 2 s pause, late A1330P INa increases (*), resulting in a prolonged AP; note the slower time-course of peak A1330P INa inactivation compared to that of WT (arrows). D, selected associated individual membrane currents in the PB model cell.
Figure 7. Representative examples of the effects of pacing rate and of a pause on WT or mutant peak INas.
APs were recorded from a ‘subepicardial’ cell successively coupled to HEK cells transfected with WT (top), Y1795C (middle) or A1330P (bottom) channels. A normal (WT) response is shown in the top panels, while APs in LQT syndrome are prolonged compared to normal (middle and bottom). At 2 Hz, after the pause, the extent of AP prolongation is exaggerated and heterogeneous. Note the corresponding INas.
Figure 8. AP duration at 90% repolarization (APD90) with the subepicardial cell with WT or mutant INas.
See Table 1 for n at 1 and 2 Hz; at 0.5 Hz n was ≥ 6 in all cases. *Significant difference versus control (P < 0.05 for mutant versus WT).
Action potential heterogeneity in the PB model cell with WT and mutant INa
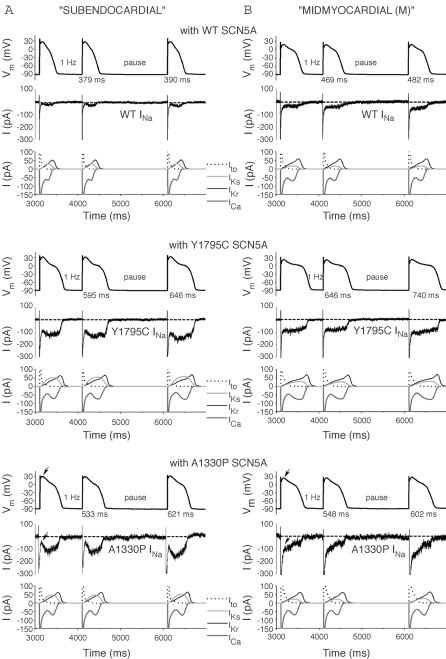
The time-course of the late INa depends on the applied depolarizing voltage waveforms (Fig. 4). To investigate the effects of distinct AP morphologies on late INa, we generated mid-myocardial (M), and subendocardial cells by altering relative densities of selected membrane ionic currents in the ‘subepicardial’ PB model cell as described in our previous study (Berecki et al. 2005), and by implementing HEK cell INa to these cell models; the resulting APs were of different shape: AP heterogeneity (Supplemental Fig. S4A). Similar to results obtained with the subepicardial cell, the Y1795C and A1330P mutations caused AP prolongation also with ‘subendocardial’ and ‘M’ cells (Fig. 9). The mutation-induced APD-prolonging effects were most notable in M cells (Supplemental Fig. S4B and C), probably due to smaller repolarizing IKs densities in these cells. As a result, dispersion in AP duration was considerably larger for the mutants than for WT. At 1 Hz, the difference between longest (M cell) and shortest (epicardial cell) APD90 was ∼197 ms and ∼199 ms for the Y1795C and A1330P mutants, respectively, whereas it was ∼77 ms for WT (Supplemental Fig. S4B). When implementing mutant (Y1795C or A1330P) input INa, we were unable to perform dAPC experiments with the M cell at 2 Hz, since the evoked APs did not repolarize within 500 ms. Figure 9 further reveals a major difference with regard to the time-course of INa in the subendocardial and M cells, partly attributable to a change in driving force for Na+ during the AP. With WT INa at 1 Hz, the plateau amplitude at 60 ms repolarization (PA60) of the subendocardial cell is ∼28.1 mV, compared to that of ∼19.5 mV of the subepicardial and M cells (Supplemental Fig. S4A). The more depolarized plateau results in a decrease of the driving force for Na+ (which in turn results in a smaller momentary late INa). This is easily traceable when comparing, e.g. time-courses of A1330P Vm and INa in the subendocardial and M cells (Fig. 9A and B). The arrows in Fig. 9 indicate the maximal PA and the corresponding late INa amplitudes in the subendocardial and M cells, respectively.
Figure 9. AP prolongation caused by the Y1795C and A1330P mutations in ‘subendocardial’ (A) and ‘M’ (B) cells.
Representative APs (top) at 1 Hz, the corresponding HEK cell INa (middle), and associated individual membrane currents in the PB model cell (bottom). AP prolongation was exaggerated in subendocardial and M cells compared to subepicardial cells. The same input (WT, Y1795C, or A1330P) INa peak amplitude was used in A and B, respectively. Arrows in bottom panels indicate plateau amplitude and the corresponding late INa amplitude.
Discussion
The NaV1.5 channel of the heart is a multisubunit protein complex composed of a single large α-subunit, SCN5A, along with one or more auxiliary β-subunits (Catterall, 2000), fine-tuned for the frequency and the waveform of APs (Ruff, 1998). The majority of LQT3-related mutations cause ‘classic’ gain-of-function due to a late inward INa, although in some LQT3-related SCN5A mutations this late INa seems to be absent (An et al. 1998; Wedekind et al. 2001; Rivolta et al. 2002; Smits et al. 2005), findings that suggest heterogeneity of mechanisms underlying the clinical phenotype of the syndrome.
In this study, we used dAPC technique to investigate the effects of LQT3-related sodium channelopathies in a cardiac (model) cell. This technique is an extension of the ‘dynamic clamp’ approach (Wilders, 2005), and has proven to be a powerful experimental tool allowing unique combinations of cardiac cells and an ion channel expression system (Berecki et al. 2005). The dAPC configuration generates a more physiological setting than the traditional methods of voltage clamp and AP clamp. During each cycle of a real-time feedback loop, membrane potential is calculated by solving ordinary differential equations and is in turn applied to the HEK-293 cell, altering the profile of the elicited INa. We scrutinized the time-course-, voltage- and frequency-dependence of transiently expressed WT and two mutant INas, to directly establish the effects of two LQT3-related mutations on the ventricular (model) cell AP characteristics and on the time-course of the elicited INa. With this technique, kinetic features that remain unnoticed when standard voltage-clamp protocols are used become apparent. Our data directly support the idea that late INa importantly contributes to the AP plateau and plays a crucial role during AP repolarization, where non-equilibrium conditions enhance NaV1.5 channel reopening.
Contrary to our previous dAPC study, where the implemented HERG current was downscaled making Ibck negligible (Berecki et al. 2005), in these experiments INa needed upscaling. This procedure would increase Ibck so that it would interfere with the late INa during the AP plateau. The very efficient Ibck-subtraction method introduced in this study made it possible to record INa traces similar to what could be obtained in experiments where TTX was used to isolate INa. Ideally, higher expression levels could be beneficial to ‘minimize’Ibck, but are also unwanted because of voltage errors they would introduce. Whole-cell INa recordings at physiological temperature are technically challenging due to fast (in)activation kinetics and large current amplitudes (Nagatomo et al. 1998; Dumaine et al. 1999; Wang et al. 2000; Rivolta et al. 2001; Keller et al. 2005). However, the importance of experimental temperatures approaching the physiological range is highlighted by findings that the electrophysiological profile at room temperature may not adequately explain the ECG signature (Dumaine et al. 1999). Similarly, the extent of a mutation-induced change on NaV1.5 channel function can be masked at room temperature: enhancement of intermediate inactivation with the Y1795C mutant is undetected at room temperature, but augmented at 32°C (Rivolta et al. 2001). Our results reveal specific kinetic features of WT and mutant INa under close-to-physiological conditions, i.e. by recording at 35°C and letting INa generate and shape the ventricular AP. Regional AP heterogeneity due to intrinsic differences between cell types was reproduced by adjusting selected membrane ionic currents in the PB model cell and by implementing HEK cell INa to the PB model cell. The method allowed a close investigation of the effects of AP morphology on the time-course of INa. The studied mutations caused AP prolongations in all cell types studied. Our results on the Y1795C mutation confirm those of Clancy et al. (2002), though the resulting APD prolongation in dAPC experiments was more pronounced: a 35–88 ms increase for the Y1795C mutation at 0.5–2 Hz (Fig. 8) in contrast with the 10–30 ms predicted by computer simulations. Similarly, dAPC data on the A1330P mutant give an insight into the mechanism underlying AP prolongation and arrhythmogenesis in the carrier of this mutation. Facilitated (re)openings of the cardiac sodium channels due to mutation are likely to cause a rise in intracellular Na+ concentration ([Na+]i), and, through increased plateau ICa (due to AP prolongation) as well as depressed Na+/Ca2+ exchange, intracellular Ca2+ ([Ca2+]i). By calculating the charge, QNa, from the integral of the WT or mutant INa during the AP plateau and repolarization phases, the assumption that cells with mutant sodium channels have increased [Na+]i values compared to WT can be corroborated (not shown). Besides, an increase of [Ca2+]i by itself can give rise to delayed afterdepolarizations (DADs), which also are a substrate for arrhythmias.
Literature data suggest that sudden pauses play a major role in the genesis of spontaneous arrhythmias in the congenital LQT syndrome (Viskin et al. 2000). Patients with LQT3 are at a greater risk of cardiac events during rest or bradycardia than during exercise when heart rate is elevated (Clancy et al. 2002; Veldkamp et al. 2003). The onset of torsades de pointes arrhythmias in LQT3 tends to be bradycardia- or pause-dependent, contrary to other LQT syndromes that tend to be adrenergic dependent (Schwartz et al. 1995; Schwartz et al. 2001). Frequency-dependent changes of the late and peak INa were studied in detail only with the ΔKPQ mutant. There, rate-dependent reduction of late INa may account for the shortening of QT interval at higher rates (Nagatomo et al. 2002). In dAPC experiments, late INa amplitudes of Y1795C and A1330P mutants were strongly rate dependent, conducting less late INa at faster rates. Similarly, at fast rates, peak INa was more decreased with mutant channels, suggesting a ‘more absorbing’ intermediate inactivation in both cases, compared to the normal situation (WT). In addition to this, the increased AP durations in LQT3 further enhance intermediate inactivation during depolarizations and cause failure of channels to recover during the short hyperpolarizations between the pulses. At the same time, when APs are prolonged, currents through normal and unmodified channels are also modified (Figs 5D, 6D and 9). These currents further shape (by tending to prolong and/or shorten) the AP, supporting the concept of complex nature of interactions between different current components. Our dAPC data show that both mutations cause frequency- and pause-dependent changes of the AP and INa characteristics, and demonstrate that the INa, as well as other selected currents during the AP, not only depends on the instantaneous voltage alone, but depends upon the previous voltages before the applied AP-waveform as well. The pronounced effect of a pause after rapid pacing, combined with elevation of intracellular Ca2+ would provide an ‘ideal breeding ground for afterdepolarizations, triggering, and heterogeneity of APDs that are thought to underlie torsades de pointes’ (Roden & Anderson, 2000).
General considerations
The PB model of the cardiac AP (Priebe & Beuckelmann, 1998) does not include the late component exhibited by WT and mutant Na+ channels. Description of currents in the PB model is based on results from voltage-clamp experiments, and the description of most membrane current components, but not the sodium current, is based on quantitative data from human ventricular cells.
PB model cell APs can exhibit early afterdepolarizations (EADs), but only with significantly enhanced ICa. This represents a shortcoming of all current human ventricular cell models (Priebe & Beuckelmann, 1998; Iyer et al. 2004; ten Tusscher et al. 2004). Experimental data demonstrate that voltage-dependent inactivation of the L-type Ca2+ current (ICa) occurs rather slowly, while Ca2+-induced inactivation of ICa is much faster (Carmeliet, 2004). As discussed in detail by Iyer et al. (2004), human ventricular cell models require an artificial dominant voltage-dependent inactivation of ICa to assure AP stability. This dominant inactivation of ICa tends to prevent formation of EADs by inhibiting reactivation of ICa during the plateau phase of the AP.
Autonomic regulation is not implemented in the PB ventricular cell model. Such regulation would not only cause frequency-dependent changes but would also have additional effects on various ionic currents. For a number of years, transgenic mice proved to be suitable models in cardiovascular research, offering an adequate cellular environment to study autonomic influences on cardiac ion channels (Charpentier et al. 2004). For instance, the knock-in ΔKPQ mice show LQT3 features, including arrhytmogenicity (Nuyens et al. 2001). Although endogenous factors may influence the behaviour of the transgene, and extrapolation of results from mice to the human situation should be done circumspectly (London, 2001), these and similar models might help elucidate the pathophysiology of certain exercise- or emotion-triggered (Schwartz et al. 2001) LQT3 syndromes.
Although much effort was expended on tuning for optimum noise and speed, our attempts to establish dAPC in real-cell mode (HEK cell coupled to a freshly isolated rabbit left ventricular myocyte) were not successful because of instabilities and oscillatory distortions of the upscaled and Ibck-subtracted input INa. The shortcomings were probably related to imperfect Cm and/or Rs compensation when coupling two voltage-clamp amplifiers and/or to a delay during the dAPC time steps, occurring even when using an Alembic VE-2 amplifier (Alembic Instuments, Montreal, Quebec) with state estimator Rs compensation (Sherman et al. 1999). A major problem in connecting to a real ventricular cell is that fast-activating and large-amplitude (∼40–60 nA, when upscaled) input INa might cause inhomogeneities of the membrane potential (Vm) of the real cell. Unfortunately, this cannot be improved with an expression system offering larger currents: as pointed out in the Electrophysiology section of the Methods, the larger the current, the more difficult it is to obtain reliable voltage control. A way out would be to combine ‘conventional APC’ to generate the upstroke and thereafter switch to dAPC with a slower, more stable feedback to study the INa during the plateau phase.
Conclusions
LQT3 syndrome is linked to mutations in the SCN5A gene. Despite this link, the mechanism by which a given mutation leads to the clinically observed electrical disease often remains obscure. We used close-to-physiological conditions to study AP morphology and the time-course and magnitude of late INa during the plateau and repolarizing phases of the AP. With mutant INa, APD was longer than with WT, due to a stimulation-frequency-dependent large late INa component. This late INa importantly contributes to the AP plateau and AP repolarization. Mid-myocardial cells exhibited pronounced AP prolongation compared to subepicardial cells, resulting in increased APD dispersion for each of the mutants. Thus, with the dAPC approach, we were able to demonstrate the effects of various clinically relevant stimulation frequencies as well the consequence of a pause on AP morphology, and to reveal the arrhythmogenic nature of LQT3-associated SCN5A mutations.
Acknowledgments
We thank Berend de Jonge for excellent assistance with the HEK-293 cell culture. This study was supported by Netherlands Heart Foundation Grant 2001B155.
Supplemental-material
The online version of this paper can be accessed at:
DOI: 10.1113/jphysiol.2005.096578
http://jp.physoc.org/cgi/data/jphysiol.2005.096578/DC1 and contains supplemental material including four figures entitled:
Figure S1: The effects of reducing model cell INa density on the AP duration.
Figure S2: Late INa magnitude during depolarising ramps depends on the duration of the depolarising voltage prepulse.
Figure S3: Ibck substration in the presence of Y1795C input INa.
Figure S4: Ap heterogeneity and mutation-induced dispersion of AP duration in dAPC experiments.
This material can also be found as part of the full-text HTML version available from http://www.blackwell-synergy.com
References
- An RH, Wang XL, Kerem B, Benhorin J, Medina A, Goldmit M, Kass RS. Novel LQT-3 mutation affects Na+ channel activity through interactions between α- and β1-subunits. Circ Res. 1998;83:141–146. doi: 10.1161/01.res.83.2.141. [DOI] [PubMed] [Google Scholar]
- Bennett PB, Yazawa K, Makita N, George AL., Jr Molecular mechanism for an inherited cardiac arrhythmia. Nature. 1995;376:683–685. doi: 10.1038/376683a0. [DOI] [PubMed] [Google Scholar]
- Berecki G, Zegers JG, Verkerk AO, Bhuiyan ZA, de Jonge B, Veldkamp MW, Wilders R, van Ginneken AC. HERG channel (dys) function revealed by dynamic action potential clamp technique. Biophys J. 2005;88:566–578. doi: 10.1529/biophysj.104.047290. [DOI] [PMC free article] [PubMed] [Google Scholar]
- Carmeliet E. Intracellular Ca2+ concentration and vate adaptatior of the cardiac action potential. Cell Calcium. 2004;35:557–573. doi: 10.1016/j.ceca.2004.01.010. [DOI] [PubMed] [Google Scholar]
- Catterall WA. From ionic currents to molecular mechanisms: the structure and function of voltage-gated sodium channels. Neuron. 2000;26:13–25. doi: 10.1016/s0896-6273(00)81133-2. [DOI] [PubMed] [Google Scholar]
- Charpentier F, Demolombe S, Escande D. Cardiac channelopathies: from men to mice. Ann Med. 2004;36(Suppl. 1):28–34. doi: 10.1080/17431380410032508. [DOI] [PubMed] [Google Scholar]
- Clancy CE, Rudy Y. Linking a genetic defect to its cellular phenotype in a cardiac arrhythmia. Nature. 1999;400:566–569. doi: 10.1038/23034. [DOI] [PubMed] [Google Scholar]
- Clancy CE, Tateyama M, Kass RS. Insights into the molecular mechanisms of bradycardia-triggered arrhythmias in long QT-3 syndrome. J Clin Invest. 2002;110:1251–1262. doi: 10.1172/JCI15928. [DOI] [PMC free article] [PubMed] [Google Scholar]
- Clancy CE, Tateyama M, Liu H, Wehrens XH, Kass RS. Non-equilibrium gating in cardiac Na+ channels: an original mechanism of arrhythmia. Circulation. 2003;107:2233–2237. doi: 10.1161/01.CIR.0000069273.51375.BD. [DOI] [PubMed] [Google Scholar]
- Dumaine R, Towbin JA, Brugada P, Vatta M, Nesterenko DV, Nesterenko VV, Brugada J, Brugada R, Antzelevitch C. Ionic mechanisms responsible for the electrocardiographic phenotype of the Brugada syndrome are temperature dependent. Circ Res. 1999;85:803–809. doi: 10.1161/01.res.85.9.803. [DOI] [PubMed] [Google Scholar]
- Franz MR, Schaefer J, Schottler M, Seed WA, Noble MI. Electrical and mechanical restitution of the human heart at different rates of stimulation. Circ Res. 1983;53:815–822. doi: 10.1161/01.res.53.6.815. [DOI] [PubMed] [Google Scholar]
- Helix N, Strobaek D, Dahl BH, Christophersen P. Inhibition of the endogenous volume-regulated anion channel (VRAC) in HEK293 cells by acidic di-aryl-ureas. J Membr Biol. 2003;196:83–94. doi: 10.1007/s00232-003-0627-x. [DOI] [PubMed] [Google Scholar]
- Iyer V, Mazhari R, Winslow RL. A computational model of the human left-ventricular epicardial myocyte. Biophys J. 2004;87:1507–1525. doi: 10.1529/biophysj.104.043299. [DOI] [PMC free article] [PubMed] [Google Scholar]
- Jiang C, Atkinson D, Towbin JA, Splawski I, Lehmann MH, Li H, Timothy K, Taggart RT, Schwartz PJ, Vincent GM, Moss AJ, Keating MT. Two long QT syndrome loci map to chromosomes 3 and 7 with evidence for further heterogeneity. Nat Genet. 1994;8:141–147. doi: 10.1038/ng1094-141. [DOI] [PubMed] [Google Scholar]
- Keller DI, Rougier JS, Kucera JP, Benammar N, Fressart V, Guicheney P, Madle A, Fromer M, Schlapfer J, Abriel H. Brugada syndrome and fever: Genetic and molecular characterization of patients carrying SCN5A mutations. Cardiovasc Res. 2005;67:510–519. doi: 10.1016/j.cardiores.2005.03.024. [DOI] [PubMed] [Google Scholar]
- London B. Cardiac arrhythmias: from (transgenic) mice to men. J Cardiovasc Electrophysiol. 2001;12:1089–1091. doi: 10.1046/j.1540-8167.2001.01089.x. [DOI] [PubMed] [Google Scholar]
- Magyar J, Kiper CE, Dumaine R, Burgess DE, Bányász T, Satin J. Divergent action potential morphologies reveal nonequilibrium properties of human cardiac Na+ channels. Cardiovasc Res. 2004;64:477–487. doi: 10.1016/j.cardiores.2004.07.014. [DOI] [PubMed] [Google Scholar]
- Maltsev VA, Sabbah HN, Higgins RS, Silverman N, Lesch M, Undrovinas AI. Novel, ultraslow inactivating sodium current in human ventricular cardiomyocytes. Circulation. 1998;98:2545–2552. doi: 10.1161/01.cir.98.23.2545. [DOI] [PubMed] [Google Scholar]
- Moss AJ, Zareba W, Benhorin J, Locati EH, Hall WJ, Robinson JL, Schwartz PJ, Towbin JA, Vincent GM, Lehmann MH. ECG T-wave patterns in genetically distinct forms of the hereditary long QT syndrome. Circulation. 1995;92:2929–2934. doi: 10.1161/01.cir.92.10.2929. [DOI] [PubMed] [Google Scholar]
- Nagatomo T, Fan ZYeB, Tonkovich GS, January CT, Kyle JW, Makielski JC. Temperature dependence of early and late currents in human cardiac wild-type and long Q-T ΔKPQ Na+ channels. Am J Physiol. 1998;275:H2016–H2024. doi: 10.1152/ajpheart.1998.275.6.H2016. [DOI] [PubMed] [Google Scholar]
- Nagatomo T, January CTYeB, Abe H, Nakashima Y, Makielski JC. Rate-dependent QT shortening mechanism for the LQT3 ΔKPQ mutant. Cardiovasc Res. 2002;54:624–629. doi: 10.1016/s0008-6363(02)00265-1. [DOI] [PubMed] [Google Scholar]
- Nuyens D, Stengl M, Dugarmaa S, Rossenbacker T, Compernolle V, Rudy Y, Smits JF, Flameng W, Clancy CE, Moons L, Vos MA, Dewerchin M, Benndorf K, Collen D, Carmeliet E, Carmeliet P. Abrupt rate accelerations or premature beats cause life-threatening arrhythmias in mice with long-QT3 syndrome. Nat Med. 2001;7:1021–1027. doi: 10.1038/nm0901-1021. [DOI] [PubMed] [Google Scholar]
- Priebe L, Beuckelmann DJ. Simulation study of cellular electric properties in heart failure. Circ Res. 1998;82:1206–1223. doi: 10.1161/01.res.82.11.1206. [DOI] [PubMed] [Google Scholar]
- Rivolta I, Abriel H, Tateyama M, Liu H, Memmi M, Vardas P, Napolitano C, Priori SG, Kass RS. Inherited Brugada and long QT-3 syndrome mutations of a single residue of the cardiac sodium channel confer distinct channel and clinical phenotypes. J Biol Chem. 2001;276:30623–30630. doi: 10.1074/jbc.M104471200. [DOI] [PubMed] [Google Scholar]
- Rivolta I, Clancy CE, Tateyama M, Liu H, Priori SG, Kass RS. A novel SCN5A mutation associated with long QT-3: altered inactivation kinetics and channel dysfunction. Physiol Genomics. 2002;10:191–197. doi: 10.1152/physiolgenomics.00039.2002. [DOI] [PubMed] [Google Scholar]
- Roden DM, Anderson ME. The pause that refreshes, or does it? Mechanisms in torsades de pointes. Heart. 2000;84:235–237. doi: 10.1136/heart.84.3.235. [DOI] [PMC free article] [PubMed] [Google Scholar]
- Ruff RL. Cells use the singular properties of different channels to produce unique electrical songs. Biophys J. 1998;74:2745–2746. doi: 10.1016/S0006-3495(98)77982-2. [DOI] [PMC free article] [PubMed] [Google Scholar]
- Schwartz PJ, Priori SG, Locati EH, Napolitano C, Cantu F, Towbin JA, Keating MT, Hammoude H, Brown AM, Chen LS. Long QT syndrome patients with mutations of the SCN5A and HERG genes have differential responses to Na+ channel blockade and to increases in heart rate. Implications for gene-specific therapy. Circulation. 1995;92:3381–3386. doi: 10.1161/01.cir.92.12.3381. [DOI] [PubMed] [Google Scholar]
- Schwartz PJ, Priori SG, Spazzolini C, Moss AJ, Vincent GM, Napolitano C, Denjoy I, Guicheney P, Breithardt G, Keating MT, Towbin JA, Beggs AH, Brink P, Wilde AA, Toivonen L, Zareba W, Robinson JL, Timothy KW, Corfield V, Wattanasirichaigoon D, Corbett C, Haverkamp W, Schulze-Bahr E, Lehmann MH, Schwartz K, Coumel P, Bloise R. Genotype-phenotype correlation in the long–QT syndrome: gene-specific triggers for life-threatening arrhythmias. Circulation. 2001;103:89–95. doi: 10.1161/01.cir.103.1.89. [DOI] [PubMed] [Google Scholar]
- Sherman AJ, Shrier A, Cooper E. Series resistance compensation for whole-cell patch-clamp studies using a membrane state estimator. Biophys J. 1999;77:2590–2601. doi: 10.1016/S0006-3495(99)77093-1. [DOI] [PMC free article] [PubMed] [Google Scholar]
- Sigworth FJ. Electronic design of the patch clamp. In: Sakmann B, Neher E, editors. Single-Channel Recording. New York: Plenum Press; 1983. pp. 3–35. [Google Scholar]
- Smits JP, Veldkamp MW, Bezzina CR, Bhuiyan ZA, Wedekind H, Schulze-Bahr E, Wilde A. Substitution of a conserved alanine in the domain IIIS4–S5 linker of the cardiac sodium channel causes long QT syndrome. Cardiovasc Res. 2005;67:459–466. doi: 10.1016/j.cardiores.2005.01.017. [DOI] [PubMed] [Google Scholar]
- ten Tusscher KH, Noble D, Noble PJ, Panfilov AV. A model for human ventricular tissue. Am J Physiol Heart Circ Physiol. 2004;286:H1573–H1589. doi: 10.1152/ajpheart.00794.2003. [DOI] [PubMed] [Google Scholar]
- Veldkamp MW, Wilders R, Baartscheer A, Zegers JG, Bezzina CR, Wilde AA. Contribution of sodium channel mutations to bradycardia and sinus node dysfunction in LQT3 families. Circ Res. 2003;92:976–983. doi: 10.1161/01.RES.0000069689.09869.A8. [DOI] [PubMed] [Google Scholar]
- Viskin S, Fish R, Zeltser D, Belhassen B, Heller K, Brosh D, Laniado S, Barron HV. Arrhythmias in the congenital long QT syndrome: how often is torsade de pointes pause dependent. Heart. 2000;83:661–666. doi: 10.1136/heart.83.6.661. [DOI] [PMC free article] [PubMed] [Google Scholar]
- Wang DW, Makita N, Kitabatake A, Balser JR, George AL., Jr Enhanced Na+ channel intermediate inactivation in Brugada syndrome. Circ Res. 2000;87:E37–E43. doi: 10.1161/01.res.87.8.e37. [DOI] [PubMed] [Google Scholar]
- Wang Q, Shen J, Splawski I, Atkinson D, Li Z, Robinson JL, Moss AJ, Towbin JA, Keating MT. SCN5A mutations associated with an inherited cardiac arrhythmia, long QT syndrome. Cell. 1995;80:805–811. doi: 10.1016/0092-8674(95)90359-3. [DOI] [PubMed] [Google Scholar]
- Wedekind H, Smits JP, Schulze-Bahr E, Arnold R, Veldkamp MW, Bajanowski T, Borggrefe M, Brinkmann B, Warnecke I, Funke H, Bhuiyan ZA, Wilde AA, Breithardt G, Haverkamp W. De novo mutation in the SCN5A gene associated with early onset of sudden infant death. Circulation. 2001;104:1158–1164. doi: 10.1161/hc3501.095361. [DOI] [PubMed] [Google Scholar]
- Wehrens XH, Vos MA, Doevendans PA, Wellens HJ. Novel insights in the congenital long QT syndrome. Ann Intern Med. 2002;137:981–992. doi: 10.7326/0003-4819-137-12-200212170-00012. [DOI] [PubMed] [Google Scholar]
- Wilders R. ‘Dynamic clamp’ in cardiac electrophysiology. J Physiol. 2005;566:641. doi: 10.1113/jphysiol.2005.566101. [DOI] [PMC free article] [PubMed] [Google Scholar]
- Zaniboni M, Pollard AE, Yang L, Spitzer KW. Beat-to-beat repolarization variability in ventricular myocytes and its suppression by electrical coupling. Am J Physiol Heart Circ Physiol. 2000;278:H677–H687. doi: 10.1152/ajpheart.2000.278.3.H677. [DOI] [PubMed] [Google Scholar]
Associated Data
This section collects any data citations, data availability statements, or supplementary materials included in this article.


