

Abstract
A new imaging device, termed a “cryomacroscope”, is presented in this report. This device is designed to assist in exploring thermal and mechanical effects associated with large-scale vitrification and crystallization, with the current setup aimed at the range of 50 μm to 2 cm. The cryomacroscope is not intended as a substitute for the cryomicroscope, but as a complementary tool for the cryobiologist. A combination of cryomacroscopy and cryomicroscopy is suggested as a basis for multi-scale cryobiology studies. This report presents initial results on vitrification, crystallization, and fracture formation in the cryoprotectant cocktails DP6 and VS55. These results show some inconsistency in the tendency to form crystals, based on critical cooling and rewarming rates measured by means of a differential scanning calorimetric device (DSC) in parallel studies. This research is in its early stages, and comparative studies on biological materials are currently underway. Part II of this report (the companion paper) presents results for fracture formation in the cryoprotectant and discusses the mechanical stresses which promote these fractures. In conjunction with these reports, additional photos of cryomacroscopy of vitrification, crystallization, and fracture formation are available at http://www.me.cmu.edu/faculty1/rabin/CryomacroscopyImages01.htm.
Keywords: Cryomacroscopy, cryomicroscopy, vitrification, crystallization, recrystallization, devitrification, thermal stress, fracture, VS55, DP6
Introduction
The goal and motivation for this study is to develop tools for a greater understanding of the factors that impact the survival and integrity of living biological tissues during cryopreservation. Ice crystallization is known to be the major cause for many mechanisms of cell injury during cryopreservation either directly or indirectly. Plausible explanations have been offered for why ice crystals damage biological cells at the various regimes of ice crystal formation, but the outcome of the events caused by crystallization is essentially the same--very high certainty of cell death [14,16,22]. While the direct effect of macroscopic ice crystallization per se is known to be relatively innocuous during the cryopreservation of single cell systems, this is not the case for cellular aggregates, structured tissues and complex biomaterials [16,22,23]. Development of cryopreservation techniques for complex biomaterials are typically focused on controlling--and ideally, eliminating--ice formation, frequently by introducing cryoprotective agents (or cryoprotectants), into the biomaterials.
Classical cryopreservation, with low concentrations of dimethyl sulfoxide (DMSO--one of the most commonly used cryoprotectants), does a reasonable job of cell preservation by a variety of mechanisms including modulating intracellular ice formation; however as we have reviewed recently, it has recognized limitations as a method for preserving multicellular tissues [23]. Even when all major cryopreservation variables are controlled, there is a limit--largely a function of tissue volume and geometry--beyond which traditional cryopreservation methods do not work consistently to provide a high degree of tissue integrity (structural and functional). There have been several hypotheses on the mechanisms of freezing-induced injury based upon a variety of factors [8,14], but it has been discovered that the disadvantages of traditional cryopreservation revolve primarily around the destructive effect of ice formation [16,22,24].
Vitrification is an alternative to conventional freezing of living biological materials (vitreous meaning glass in Latin), suggested first by Luyet [11], but applied successfully only in recent years [21,22,24]. Here, ice formation is completely prevented due to the presence of high cryoprotectant concentrations; the viscosity increases exponentially with decreasing temperature, which eventually leads to an arrested state of the water molecules. No appreciable degradation occurs over time in living matter trapped within a vitreous matrix, and vitrification is potentially applicable to all biological systems. Vitrification is a relatively well understood phenomenon, but its application to the preservation of biological systems is not without problems, since the high cryoprotectant concentration necessary to facilitate vitrification is potentially toxic. To limit the effects of toxicity, it is necessary to use the least toxic cryoprotectant and the minimum concentration that permits glass formation (at cooling rates that are practical for bulky mammalian tissues) [4,5]. While vitrification prevents the hazardous effect of ice formation, new potential mechanisms of injury associated with the amorphous state have been identified and must be studied as an essential component for developing methods of cryopreservation for multicellular tissues. These mechanisms are related to the mechanical stress associated with the thermal expansion of the material, known as “thermo-mechanical stress.”
The advantage of vitrification over classical preservation has been demonstrated recently on blood vessels, using a novel technique and with the application of VS55 as a cryoprotectant [21]. The vitrified blood vessels produced a significantly greater statistical degree of contraction, compared with classically-cryopreserved controls, and there was no statistically significant difference between vitrified vascular grafts and fresh controls. These preliminary data from our laboratory at Organ Recovery Systems, Inc. supports the hypothesis that cryopreservation by means of vitrification results in markedly improved preservation of tissue structure and function. However, our preliminary data are based on relatively small samples, having a typical overall volume of 1 mℓ (tissue segment and surrounding cryoprotectant, combined). Extrapolation of these technological advances and scale-up to samples of a clinically relevant size is not trivial. Issues relating to the stability of the vitreous state, the temperature of storage and transportation, as well as the cooling and warming conditions all impact the outcome of the cryopreservation protocol.
As a part of an ongoing effort to scale up vitrification to samples of a clinically relevant size, the current study focuses on exploring the range of thermal and mechanical effects during a typical vitrification protocol. For this purpose, a prototype device has been developed, named “cryomacroscope.” The new cryomacroscope enables observations of crystallization and fracture formation in the same 1 mℓ sample used in our preliminary study [21], as well as larger samples. Part I of this report describes the cryomacroscope prototype, and experimental observations of crystallization and vitrification. Part II of this report provides experimental observations of fracture formation, insight into the thermal history of the sample, and discussion about continuum mechanics effects that can explain some of the observations.
Cryomacroscopy versus Cryomicroscopy
Experimental observations of crystallization are typically made by means of a microscope combined with a temperature-controlled stage. The temperature-controlled stage is frequently referred to as a “cryostage”, and its combination with a microscope is typically referred to as a “cryomicroscope” [2,3,12]. Cryomicroscopy is frequently used to study the effects of crystal formation at the cellular level, which may trigger several injury sequences. It is customary to classify injury sequences with respect to the initial site of ice crystal nucleation: intracellular freezing, associated with the kinetic effect of super cooling, or extracellular freezing, associated with the so-called “solution effect.” This classification has been proposed by Mazur et. al. [13], and is widely known as “the two-factor hypothesis of freezing injury.” The cryobiology literature is replete with alternative explanations for this hypothesis and supportive experimental observations.
Cryomicroscopy applications have been reported for more than four decades, based on two major temperature-control techniques: (i) time-control of a cryostage possessing a uniform temperature distribution [2,3,12]; and, (ii) controlling the velocity of a sample-carrying microslide, which travels between two constant-temperature blocks (also known as a ”directional solidification stage”) [1,9,20]. In either case, cryomicroscopy is performed on very thin samples, having a typical thickness in the order of a micro meter, or the diameter of the biological cell under investigation.
The major advantage of cryomicroscopy is the ability to observe crystal formation and structural changes in the single crystal size scale. In some studies, cryomicroscopy is combined with polarized light, in order to identify ice nuclei otherwise not observable with the standard microscope magnification [9]. Here, the reflected polarized light from the nucleus surfaces serves as an indicator of the presence of the nucleus. Another advantage in cryomicroscopy studies is the ability to control the thermal history of the cryostage to a high degree of precision, and thereby study transient effects. On the other hand, all the major disadvantages of cryomicroscopy originate from the small sample thicknesses, which frequently results in dramatic surface effects due to the high surface-to-volume ratio in the specimen. These effects can influence the sample's tendency to either crystallize or fracture. As shown in the second part of this report, the presence of fractures may further trigger devitrification, thereby coupling the two phenomena. Fracturing in such a thin sample is likely to be triggered by the difference in thermal expansion between the sample and the glass substrate, an effect which is explained in more detail in Part II of this report.
The limitations of cryomicroscopy were well appreciated by Kroener and Luyet [10], who studied the formation of fractures during vitrification of glycerol solutions in 10 mℓ graduated test tubes. In their short report, Kroener and Luyet speculated on the conditions under which fractures are likely to occur, but did not explain the reason for fracturing. Following a similar line of research, Fahy et. al. [6] studied the formation of fractures in a propylene glycol solution, and in much larger containers of up to 1.5 ℓ. Fahy et. al. compared fracturing events with differential scanning calorimetry (DSC) and thermal histories, in an effort to identify problems in the vitrification of large samples. They speculated that fractures can be prevented in large vitrifying systems, if carefully handled. However, these studies at the macro-scale level were associated with great difficulties in detailed imaging and experimental repeatability.
To overcome some of the disadvantages of cryomicroscopy, a cryomacroscope prototype has been recently developed and is presented in this report. This cryomacroscope enables experimental observations on relatively large samples, allowing for deep-field observations, and in cooling conditions practical to large scale cryobiology. The conceptual difference between the cryomicroscope and the cryomacroscope is that, while the sample is brought to the imaging device in the cryomicroscopy setup, the imaging device is brought to the sample in the cryomacroscopy setup, using the same cooling and rewarming conditions that would prevail during large-scale cryopreservation experiments. However, the tradeoff in the design of the cryomacroscope is the reduced ability to observe micro-scale effects. The cryomacroscope prototype presented in this report does not include a polarized light feature yet, although no technical barrier appears to prevent its inclusion in future studies. The range of magnification of the current macroscope setup is 0.05 mm to 2 cm, which places it in the mid range between large scale photos, obtainable with a regular camera aimed at a large container [6], and a traditional optical microscope.
By no means is the cryomacroscope presented in this report suggested as a substitute the cryomicroscope, but only as a complementary tool for the cryobiologist. A combination of cryomacroscopy with cryomicroscopy is suggested to serve as a basis for multi-scale cryobiology studies that benefit from both imaging approaches.
Materials and Methods
The macroscope prototype, Fig. 1, was designed and constructed at the Biothermal Technology Laboratory of the Department of Mechanical Engineering, at Carnegie Mellon University. The glass vial used in this study is a standard 15 mℓ vial, similar to that used in our preliminary studies of vitrification of blood vessel rings [21]. However, almost any vial size and shape could be used for the purpose of cryomacroscopy, depending on the cryobiology process under investigation. The technique and considerations for controlling the vial temperature are addressed below. In order to minimize thermal interaction between the sample and the optical instrumentation, a 12” rigid borescope is used (Gradient Lens Corporation, Inc., model Hawkeye Slim HH12-AF, 42° view angle), and the tip of the borescope is set more than 15 mm above the cryoprotectant level. This set distance is adjustable, and the depth of field of the borescope is virtually infinite, although magnification decreases with depth as a function of the view angle. The field of view of the borescope is illuminated with a standard light source (Gradient Lens Corporation, Inc., Mini-Maglite®). The borescope is held in a Delrin sleeve, which is connected to a support frame at one end, and to the standard vial cap at the other end. A hole is made in the vial cap, having the same diameter as the borescope (6.35 mm). For similar experiments on different vials, a compatible cap must be prepared, having the same hole diameter. It is noted that while a rigid borescope is used in the current setup, a wide range of commercially available borescopes can be used as substitutes, with varying magnification, field of view, and possibly with a flexible shaft. The flexible borescope allows for observations inside regular refrigerators, in virtually any cryopreservation application.
Figure 1.
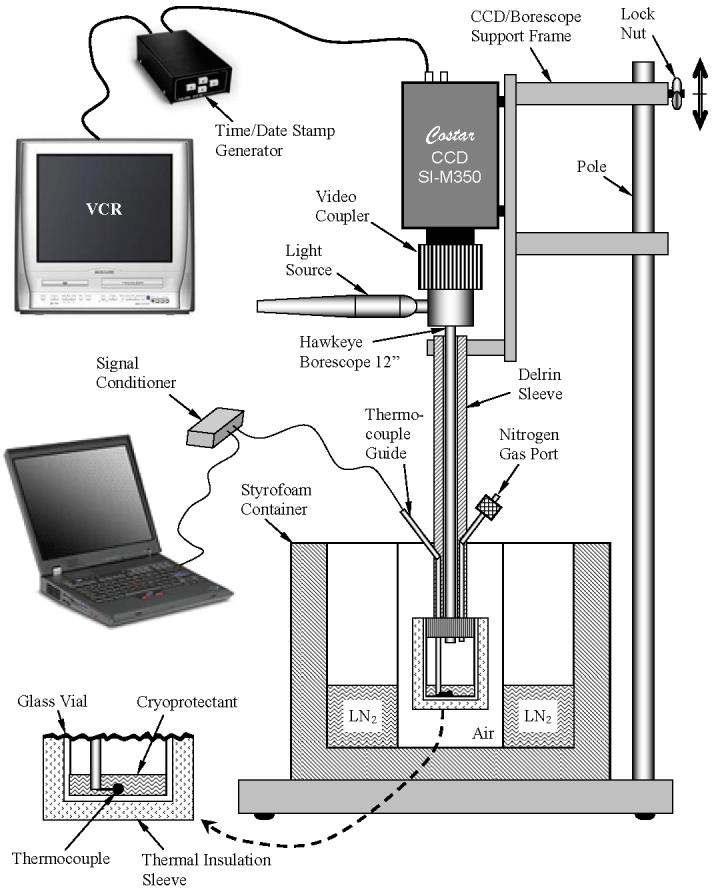
Schematic illustration of the cryomacroscopy setup
The image is recorded with a Hyper HAD CCD camera, characterized by a high monochrome resolution (Costar, Inc., model SI-M350, 768×494 pixels). The camera is connected to the borescope with a video coupler lens (Gradient Lens Corporation, Inc., model Luxxor 35mm FL). The CCD camera output is connected to a standard VCR, via a time/date stamp generator (Crest Electronics, Inc., model TDG/2001). Time stamp data is later used to correlate the recorded movies with recorded temperature data. This particular model of CCD camera (SI-M350) also has a USB port, which enables the alternative of digital video recording directly to a computer hard drive, while eliminating the need for VHS recording. The CCD camera is physically connected to the same support frame which holds the Delrin sleeve of the borescope, making the camera, the borescope, and the vial one rigid unit.
The combination of camera resolution and borescope magnification is critical to the level of detail obtainable with the proposed device. In the current study, the field-of-view at a view angle of 42° has a diameter of 3.84, 7.68, 11.52, and 15.35 mm, at a distance of 5, 10, 15, and 20 mm between the borescope and the sample, respectively. When the camera resolution is taken into account, each pixel represents 5, 10, 15, and 20 μm at the same distances, respectively. The resolution can be increased by selecting a borescope with a narrower view angle; for example a view angel of 15° leads to a resolution of 1.71 μm at a distance of 5 mm, which is about three times smaller than the smallest cell in the body. Note that 5 mm is far enough to prevent heat exchange between the borescope and the specimen, which is one of the objectives in the new design.
A thermocouple guide is located in an axial groove in the Delrin sleeve, allowing for axial and rotational movement of the thermocouple tip. A T-type thermocouple is passed through the hollow thermocouple guide, and connected via a signal conditioner (National Instruments, Inc., model SC2345) to a personal computer, which serves as a data logger. The time/date stamp generator described above is synchronized with the internal clock of the personal computer to correlate image recording with temperature data.
A nitrogen port is connected to the Delrin sleeve, in order to replace the air trapped in the vial with nitrogen gas, which is supplied from a pressurized container at room temperature. Three holes, about 0.2 mm in diameter, are drilled in the hollow thermocouple guide, to enable air evacuation to the surroundings when nitrogen gas is purged. Replacing the preexisting air in the vial with nitrogen gas is critical for two reasons: (i) moisture from the air may condense above the sample and cloud the image; and (ii) condensation and subsequent crystallization of moisture from the air may aggregate on the cryoprotectant surface and potentially serve as nucleation sites.
Experimental Protocol
Temperature control in this study was achieved by passive means, in a thermal protocol typical in large-scale cryobiology, by introducing the sample to a convective cryogenic environment. In large-scale cryobiology, the sample temperature typically decays exponentially to the cryogenic surroundings temperature. Frequently, this exponential behavior is approximated by a series of linear curves in the temperature range of interest. A successful vitrification protocol was identified in our previous study [21], having an initial cooling rate of about 50°C/min, cooling from −40°C to −100°C, continuing with a cooling rate of about 3°C/min down to −130°C, an initial rewarming rate of about 30°C/min up to −100°C, and a final rewarming rate of about 225°C/min, back to room temperature.
Four linear cooling rates are defined for the purpose of the current report: H1 is the cooling rate between −40°C and −100°C, a range in which crystallization events in the cryoprotectant under investigation typically occur; H2, is the cooling rate between −100°C and −130°C, a range in which the viscosity value is typically high enough to suppress crystallization, and the vitrified material gradually gains solid characteristics (in the continuum mechanics sense); H3 is the rewarming rate between −130°C and −100°C; and H4 is the rewarming rate between −100°C and −40°C, a range in which the effects of devitrification (crystal nucleation and growth during the rewarming phase of the protocol) or recrystallization (additional growth of ice crystals already nucleated during cooling) typically occurs. It is often difficult to distinguish between recrystallization and devitrification, especially in cryomacroscopy. The term “rewarming phase crystallization” (RPC) is used as a generic term to describe both phenomena in the results and discussion section of the current report, acknowledging that although not observed, the development of nuclei cannot be excluded.
The first stage of the experimental protocol starts with preparation of the vial assembly. First, a 1 mℓ cryoprotectant sample is placed in the 15 mℓ vial; the vial is connected to its cap, which is rigidly connected to the Delrin sleeve, as described above (see also Fig. 1). Next, a pressurized container of nitrogen gas at room temperature is connected to the nitrogen gas port. The thermal insulation sleeve (Delrin) is than placed around the vial, and is connected with a rubber band. A series of thermal insulation sleeves was prepared for these experiments, each with a different wall thickness, ranging from 2 mm to 20 mm. The purpose of the sleeve is to act as a thermal barrier for passive thermal control, where the rate of cooling and rewarming is inversely proportional to the sleeve thickness. Finally, the thermocouple guide is pushed down, to bring the thermocouple tip to the center of the base of the vial. A black-on-white polar grid is placed at the bottom of the cylindrical cavity of the thermal sleeve, between the sleeve and the vial. The polar grid is used as a reference for experimental observations, as well as for centering the thermocouple tip.
The second stage of the experimental protocol includes filling the Styrofoam container with liquid nitrogen (Fig. 1), placing an empty glass beaker at the center of the container, and holding the beaker down against the force of buoyancy (using a weight). A glass beaker having internal diameter of 91 mm was used (600 ml), which is much larger than the largest thermal sleeve. The air gap created between the inner wall of the glass beaker and the thermal insulation sleeve acts as an additional thermal barrier, characterized by heat transfer by natural convection between the thermal sleeve and the liquid nitrogen. Natural convection is known to be the least efficient heat transfer mechanism in gases. The combination of the thermal insulation sleeve and the air gap can ultimately lead to very low cooling rates of less than 1°C/min, depending on the thickness of the sleeve and the diameter of the glass beaker. Alternately, a larger vial could decrease the cooling and rewarming rates, due to the naturally higher thermal inertia effect in larger samples. The reason for the thermal sleeves in the current study is to concentrate on the cooling rate effect in the same sample size, rather than potentially introducing additional large-scale effects.
The cooling part of the protocol includes purging nitrogen gas through the vial, lowering the vial assembly into the center of the glass beaker, terminating nitrogen gas flow when the thermocouple indicates −40°C (the nitrogen gas flow acts as a heat source), and monitoring the cooling process to a target minimum temperature, while video recording and temperature data logging.
The rewarming part of the protocol has two steps. In the first step (slow rewarming rate), the vial assembly is pulled up from the glass beaker, and left in air at room temperature until it reaches a temperature of −100°C. In the second step (fast rewarming rate), the vial assembly is immersed into a temperature-controlled water bath. The water temperature was set in the range of 25°C to 75°C, depending on the experiment (but kept constant through a particular experiment). In some experiments the same thermal insulation sleeve was kept on the vial during cooling and rewarming, and in some other experiments the thermal insulation sleeve was completely removed, for rapid rewarming.
The current study includes experimental observations on DP6 and VS55. DP6 is a cocktail of 234.4 g/ℓ DMSO (3M), 228.3 g/ℓ propylene glycol (3M), and 2.4 g/ℓ HEPES in a EuroCollins solution.VS55 is a cocktail of 242.14 g/ℓ DMSO (3.1M), 168.38 g/ℓ propylene glycol (2.2M), 139.56 g/ℓ formamide (3.1M), and 2.4 g/ℓ HEPES in a EuroCollins solution. The two cocktails are similar, excepting the exclusion of formamide from DP6. In return, the DP6 contains a higher concentration of propylene glycol [17,19].
Results and Discussion
In total, 112 experiments were performed in this study. The first experiments were performed in the course of developing the macroscope prototype and protocol. The remaining experiments were performed using the same protocol described above, at various rates of cooling and rewarming, as listed in Tables 1 and 2. The report on experimental results is divided into two parts: solidification effects (the current part) and solid mechanics effects (Part II). These two reports focus on cryoprotective agents in the absence of any biological material. The next phase of research, including biological materials, is currently in progress.
Table 1.
Summary of experimental data and macroscopy observations from 35 experiments on VS55, where the cooling rates H1- H4 are listed in °C/min, Tc is the onset of RPC (°C), Tm1 is the beginning of melting at the wall (°C), Tm2 is the end of melting at the thermocouple (°C), and V, C, R, and F are observations of vitrification, crystallization, RPC, and fractures, respectively. The symbol “?” indicates an inconclusive observation.
| No. | H1 | H2 | H3 | H4 | Tmin | Tc | Tm1 | Tm2 | V | C | R | F |
|---|---|---|---|---|---|---|---|---|---|---|---|---|
| 65 | 19.9 | 17.5 | 38.2 | 277 | −143 | + | ||||||
| 89 | 8.5 | 4.2 | 12.7 | 35.3 | −130.2 | + | ||||||
| 61 | 8.3 | 4.7 | 14.9 | 240 | −131.5 | + | ||||||
| 62 | 7.5 | 3.8 | 15 | 257 | −131 | + | ||||||
| 70 | 7.45 | 5.1 | 16.7 | 180 | −132.3 | + | ||||||
| 100 | 6.1 | 3.9 | 9.6 | 22 | −131.6 | + | ||||||
| 73 | 5.5 | 2.4 | 23.8 | 257 | −129.3 | + | ||||||
| 99 | 5.3 | 3.1 | 9.5 | 21.7 | −131.2 | + | ||||||
| 72 | 4.7 | 2.2 | 11.4 | 225 | −131 | + | ||||||
| 103 | 4.6 | 2.4 | 9.3 | 21.4 | −131.3 | + | ||||||
| 106 | 4.3 | 2.4 | 7.3 | 14.4 | −131.5 | + | ||||||
| 92 | 4.1 | 1.2 | 9.7 | 28.9 | −128.5 | + | ||||||
| 105 | 4 | 2.3 | 6.5 | 13.64 | −131.1 | + | ||||||
| 66 |
2.2 |
0.66 |
15 |
156 |
−130.3 |
+ |
||||||
| 91 |
8.3 |
5.2 |
11.4 |
10.1 |
−131.2 |
+ |
? |
|||||
| 58 | 16 | 11.8 | 38.3 | 277 | −132 | −65 | −44 | + | + | |||
| 86 | 14.3 | 10 | 18.7 | 53.4 | −131.9 | −78 | −36 | + | + | |||
| 57 | 13.1 | 7.7 | 25.4 | 240 | −131.1 | −56 | −44 | + | + | |||
| 87 | 12.1 | 7 | 16.5 | 52.2 | −129.8 | −67.9 | −36 | + | + | |||
| 88 | 11.5 | 8 | 25.3 | 41.1 | −132.3 | −69 | + | + | ||||
| 63 | 8 | 5 | 18 | 200 | −132 | + | + | |||||
| 71 | 7.9 | 4.1 | 9.5 | 16.7 | −130.7 | −81.6 | −63 | −38.2 | + | + | ||
| 85 | 6.4 | 3.1 | 14.7 | 55.7 | −130 | −60 | −32 | + | + | |||
| 90 | 6.1 | 2.5 | 8.9 | 23.8 | −129.9 | −66.8 | −26.5 | + | + | |||
| 56 | 5.2 | 0.7 | 18 | 225 | −128 | −42 | + | + | ||||
| 68 | 5.2 | 1.9 | 10.7 | 180 | −130.1 | + | + | |||||
| 104 | 4.4 | 3.4 | 9 | 20.9 | −131.3 | −37.8 | + | + | ||||
| 102 | 4.3 | 2.5 | 6.5 | 14.5 | −131.1 | −62.5 | −55 | −42 | + | + | ||
| 67 | 4.1 | 0.92 | 13.7 | 200 | −131.6 | + | + | |||||
| 101 | 3.8 | 2.6 | 6.1 | 13 | −131 | −68 | 36.3 | + | + | |||
| 108 | 3.3 | 2.1 | 5.1 | 9.9 | −131.1 | −68.5 | ? | + | + | |||
| 107 |
3.2 |
1.9 |
5.5 |
10.4 |
−131.1 |
−67 |
−42.3 |
+ |
+ |
|||
| 64 | 20.9 | 19.4 | 8.9 | 225 | −149.9 | + | + | + | ||||
| 69 | 5.3 | 0.93 | 15.5 | 30.5 | −130.6 | −100 | −42.2 | + | + | + | ||
| 60 | 3.05 | 0.53 | 12.8 | 19 | −131 | + | + | + |
Table 2.
Summary of experimental data and macroscopy observations from 41 experiments on DP6, where the cooling rates H1- H4 are listed in °C/min, Tc is the onset of RPC (°C), Tm1 is the beginning of melting at the wall (°C), Tm2 is the end of melting at the thermocouple (°C), and V, C, R, and F are observations of vitrification, crystallization, RPC, and fractures, respectively. The symbol “?” indicates an inconclusive observation.
| No. | H1 | H2 | H3 | H4 | Tmin | Tc | Tm1 | Tm2 | V | C | R | F |
|---|---|---|---|---|---|---|---|---|---|---|---|---|
| 51 | 13 | 7.8 | 23.1 | 240 | −131.2 | + | ? | |||||
| 77 | 4.5 | 1 | 27 | 300 | −130.1 | + | ? | |||||
| 45 |
4.1 |
1.4 |
12.6 |
300 |
−130.3 |
+ |
? |
|||||
| 83 | 17.8 | 14 | 20 | 47.4 | −134.4 | −63 | −31.6 | + | + | |||
| 52 | 16 | 12.4 | 20.9 | 240 | −132.8 | −55 | −33 | + | + | |||
| 43 | 14.3 | 11.8 | 18.6 | 46.2 | −133 | −26.6 | + | + | ||||
| 53 | 14.1 | 9.8 | 23 | 171.4 | −131.8 | −29 | + | + | ||||
| 111 | 13.9 | 8.7 | 20.7 | 56.3 | −132.2 | −79.8 | −47.6 | + | + | |||
| 44 | 13.8 | 8.8 | 19.8 | 55.4 | −134.2 | −76.4 | −32.8 | + | + | |||
| 47 | 12 | 8.5 | 13.3 | 40 | −132.6 | −70 | −24.8 | + | + | |||
| 36 | 11.5 | 7.6 | 15 | 10 | −136.1 | −70.3 | −46.2 | −33.5 | + | + | ||
| 37 | 11.1 | 6.8 | 15.7 | 10 | −139.2 | −58 | −46 | −34.6 | + | + | ||
| 94 | 7.2 | 3.4 | 13.9 | 29.4 | −130.6 | −67 | −45 | −16 | + | + | ||
| 48 | 6.7 | 1.8 | 11.2 | 211.8 | −127.9 | −30 | + | + | ||||
| 46 | 4.4 | 0.85 | 13.5 | 171.4 | −130.1 | −44 | + | + | ||||
| 35 | 4.4 | 2.1 | 14.3 | 9.6 | −133.2 | −63 | −38.5 | −40.5 | + | + | ||
| 97 | 3.6 | 2.3 | 6.7 | 15.1 | −131 | −68 | −30 | + | + | |||
| 42 | 2.4 | 1.5 | 14.3 | 40 | −135.7 | −83.3 | −38.2 | + | + | |||
| 38 |
2.2 |
0.9 |
9.4 |
6.3 |
−131.3 |
−70 |
−40.5 |
−33.9 |
+ |
+ |
||
| 41 | 100 | 106 | 14 | 300 | −156.6 | + | + | + | ||||
| 40 | 97.3 | 100 | 26.5 | 400 | −161.1 | + | + | + | ||||
| 39 | 80 | 81.8 | 26 | 360 | −193.7 | + | + | + | ||||
| 31 | 32.7 | 31 | 6.9 | 3.5 | −158.1 | −81 | −41 | −38 | + | + | + | |
| 55 | 21.2 | 19.2 | 6.1 | 8.7 | −146.1 | −78.5 | −47 | −29.2 | + | + | + | |
| 32 | 17.4 | 16.1 | 4.4 | 2.3 | −150.6 | −90 | −42 | −33.5 | + | + | + | |
| 54 | 16.7 | 14.2 | 47.4 | 171.4 | −142.7 | + | ? | + | ||||
| 79 | 9.7 | 5.6 | 13.6 | 31.3 | −131 | −93 | −53 | −26 | + | + | + | |
| 81 | 9.1 | 4.8 | 14.1 | 39.6 | −130.8 | −29 | + | + | + | |||
| 80 | 8.6 | 5.8 | 14.2 | 38.7 | −130.9 | −85 | −60 | −29.5 | + | + | + | |
| 48a | 6.4 | 1.3 | 13.2 | 124 | −130.3 | −29 | + | + | ||||
| 78 | 6.2 | 1.4 | 23.7 | 360 | −130.1 | + | ? | + | ||||
| 34 | 6.1 | 3.4 | 13.2 | 9.83 | −129.9 | −67.6 | −41.6 | −30.5 | + | + | + | |
| 74 |
4.8 |
1.1 |
18.7 |
277 |
−129.6 |
+ |
+ |
+ |
||||
| 109 | 12.4 | 8 | 18.8 | 52.9 | −131.5 | −107.5 | + | + | ||||
| 110 | 12.4 | 8.8 | 18.4 | 36 | −132 | −78.7 | −39 | + | + | |||
| 93 | 8.4 | 5.1 | 12.1 | 29.8 | −131.4 | −71 | −46 | −28 | + | + | ||
| 82 | 5.8 | 2.8 | 15.6 | 50.7 | −128.1 | −52 | −28 | + | + | |||
| 96 | 5 | 3 | 9.4 | 21.4 | −131.3 | −81 | −50 | −27.5 | + | + | ||
| 95 | 4.8 | 2.2 | 10.7 | 22.7 | −130.8 | −74 | −35 | −17 | + | + | ||
| 33 | 3.5 | 1.5 | 12.6 | 9.1 | −129.2 | −69.3 | −45.5 | −33.8 | + | + | ||
| 98 | 2.7 | 1.4 | 6.8 | 15.5 | −130.5 | −30 | + | + |
Figures 2-5 present various effects of crystal formation during cooling and subsequent rewarming of the cryoprotectants. The grid used in these figures comprises a series of four concentric circles, with a radius increment of 2.5 mm. The base radius of the vial is 10 mm, and the image beyond the fourth circle shows the wall of the vial. Figure 6 presents the thermal history of the experiments shown in Figs. 2-5. Figure 2 presents four selected images from a VS55 experiment under the following conditions: Tmin=−130.7°C, H1=7.9 °C/min (−40°C to −100°C), H2=4.1 °C/min (−100°C to −130°C), H3=9.5 °C/min (−130°C to −100°C), H4=16.7 °C/min (−100°C to −40°C). Neither crystallization nor RPC effects are evident until the sample reaches a temperature of −82.1°C during the rewarming phase (top-left), which suggests that the sample was vitrified during cooling. The sample began to be lightly opaque at about −82°C, an effect which becomes more intense with the increase in temperature, as can be seen in the following images: −72.8°C (top-right), −65.8°C (bottom-left), and −58.4°C (bottom-right). The latter image represents the point at which maximum opacity is observed. This increase in opacity is the result of very fine crystal formation during rewarming. While the observation of a single crystal is not possible, the accumulated effect of crystallization in the macro-scale is clearly evident. Note that for VS55, the critical cooling rate is H1≈2.5°C/min, and the critical rewarming rate is H4≈50°C/min [15,21], which appears to be consistent with the above observations. Light reflections from the upper surface of the sample are discussed at the end of this section.
Figure 2.

Devitrification in VS55 under the following conditions: Tmin=−130.7°C, H1=7.9 °C/min, H2=4.1 °C/min, H3=9.5 °C/min, H4=16.7 °C/min. The temperature is shown at the top-left corner of each photo. Top-left: vitrified material at the beginning of devitrification; top-right, bottom-left, and bottom-right: various stages of crystal growth. The grid at the bottom of the vial comprises a series of four concentric circles, with a radius increment of 2.5 mm. The base radius of the vial is 10 mm, and the image beyond the fourth circle shows the wall of the vial. (Experiment No. 71 in Table 1)
Figure 5.

Recrystallization in DP6 under the following conditions: Tmin=−133.2°C, H1=4.4 °C/min, H2=2.1 °C/min, H3=14.3 °C/min, H4=9.6 °C/min. The temperature is shown at the top-left corner of each photo. Top-left: vitrified material at the minimum temperature in the process; top-right: maximum recrystallization; bottom-left: partial melting of crystals at the perimeter; bottom-right: after complete melting of crystals. The grid at the bottom of the vial comprises a series of four concentric circles, with a radius increment of 2.5 mm. The base radius of the vial is 10 mm, and the image beyond the fourth circle shows the wall of the vial. (Experiment No. 35 in Table 2)
Figure 6.
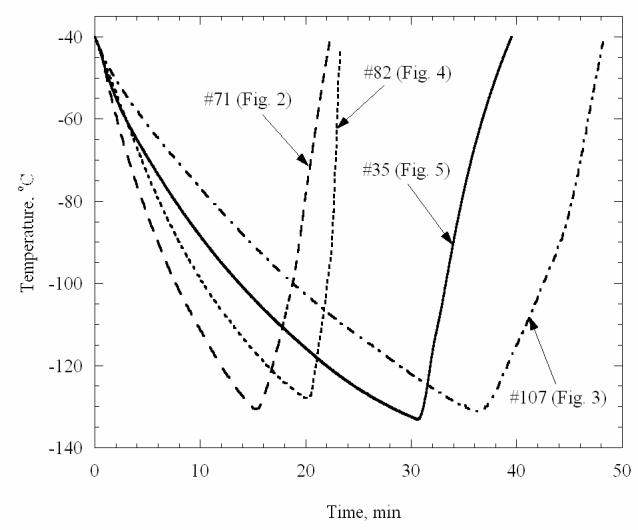
Figure 3 presents selected images from another VS55 experiment under the following conditions: Tmin=−131.1°C, H1=3.2 °C/min, H2=1.9 °C/min, H3=5.5 °C/min, H4=10.4 °C/min. Clear vitrification can be seen at −131.1°C (top-left), which is below the glass transition temperature of −123°C for VS55 [15]. Isolated crystals can be observed during the rewarming phase at −57.7°C (top-right), and −51.0°C (bottom-left), while the crystals completely melt by −42.3°C (bottom-right). The end of melting (Tm) recorded by Mehl using small samples in DSC is −38°C [15].
Figure 3.

Devitrification in VS55 under the following conditions: Tmin=−131.1°C, H1=3.2 °C/min, H2=1.9 °C/min, H3=5.5 °C/min, H4=10.4 °C/min. The temperature is shown at the top-left corner of each photo. Top-left: vitrified material at the beginning of devitrification; top-right: maximum crystallization during warming; bottom-left: partial melting of crystals; bottom-right: after complete melting of crystals. The grid at the bottom of the vial comprises a series of four concentric circles, with a radius increment of 2.5 mm. The base radius of the vial is 10 mm, and the image beyond the fourth circle shows the wall of the vial. (Experiment No. 107 in Table 1)
Figure 4 presents selected images from a DP6 experiment under the following conditions: Tmin=−128.2°C, H1=5.8 °C/min, H2=2.8 °C/min, H3=15.6 °C/min, H4=50.7 °C/min. For DP6, the critical cooling is H1≈40°C/min, the critical rewarming rate is H4≈200°C/min, and the glass transition temperature is −119°C, based on DSC studies in our lab at Organ Recovery Systems, Inc. (Unpublished observations). As could be expected from a process with a cooling rate slower than the critical cooling rate, crystallization is observed during cooling (top-left). Relatively large crystals form during cooling, while an area not occupied by such crystals appears at the perimeter, at the minimum temperature (top-right). Note that in such a large sample, the lowest cooling rate during cooling, and the lowest rewarming rate during rewarming, are always at the center of the vial. Larger samples will have larger variation in cooling and rewarming rates. RPC is evident during rewarming, which is characterized by the presence of much finer crystals (bottom-left). The different outcome of crystallization versus RPC can clearly be seen from the latter image. Finally, the large crystals become smaller crystals just before melting (bottom-right). The results shown in Fig. 4 are consistent with the critical rates of DP6.
Figure 4.

Crystallization followed by recrystallization in DP6 under the following conditions: Tmin=−128.2°C, H1=5.8 °C/min, H2=2.8 °C/min, H3=15.6 °C/min, H4=50.7 °C/min. The temperature is shown at the top-left corner of each photo. Top-left: onset of crystallization during cooling; top-right: crystals that formed during cooling; bottom-left: recrystallization at the perimeter; bottom-right: almost complete melting of crystals. The grid at the bottom of the vial comprises a series of four concentric circles, with a radius increment of 2.5 mm. The base radius of the vial is 10 mm, and the image beyond the fourth circle shows the wall of the vial. (Experiment No. 82 in Table 2)
Figure 5 presents selected images from a DP6 experiment under the following conditions: Tmin=−133.2°C, H1=4.4 °C/min, H2=2.1 °C/min, H3=14.3 °C/min, H4=9.6 °C/min. The top-left image is taken at −132.3°C, which is below the glass transition temperature of DP6. No evidence of crystallization is found during cooling, although the initial cooling rate in this experiment is well below the critical cooling rate of DP6 (and also below the cooling rate in the experiment shown in Fig. 4). Although the presence or the formation of nuclei during cooling cannot be excluded, it is surprising to find no evidence of crystallization when the cooling rate (H1) is an order of magnitude slower than the critical cooling rate. Clear evidence of RPC is found during rewarming at −41.2°C (top-right). Crystals are found only at the center of the vial, when the temperature reading during rewarming reached −36.6°C (bottom-left), which is the result of non-uniform temperature distribution in the radial direction. The last crystals melt at −29.8°C and the sample returns to being completely transparent (bottom-right), which indicates the DP6 melting temperature. Returning to the previous image (bottom-left), it is possible to estimate the temperature difference between the center of the vial and the circle defined by the outer edge of the crystals to be 6.8°C (−29.8°C minus −36.6°C). Taking into account that, at this stage, the melting front appears at a radius of about 6.5 mm (circles are plotted in 2.5 mm radius increments in the polar grid shown in Fig. 4), and that the vial radius is 10 mm, the extent of temperature non-uniformity can be estimated to be about 9°C. As a part of the experimental analysis, the temperature at which the melting front forms at the wall (for example, bottom-right of Fig. 2), and the temperature at which the last crystals disappear at the center of the vial, were routinely noted when applicable. Note that the melting point of DP6 is −34°C based on DSC analysis.
The degree of temperature non-uniformity in the sample increases with increase in the cooling rate, and with increase in the subsequent rewarming rate. It is possible to make the temperature in the vial much more uniform by placing a copper disk at the bottom of the cavity of the thermal insulation sleeve (copper has an extremely high value of thermal conductivity, which further increases with the decrease in temperature). However, in the absence of such a copper disk, the experiments reported here are deemed more realistic for simulating vitrification in large samples. The effect of temperature non-uniformity also affects the formation of stresses and fractures, as discussed in Part II of this report.
The difference in the apparent crystallization during cooling between the experiments in Figs. 4 and 5 is intriguing. The initial cooling rate is similar in both experiments and is an order of magnitude slower than the critical cooling rate for DP6. However, crystallization is shown in the experiment with the slightly higher cooling rate (Fig. 4), while it is not apparent in the other experiment (Fig. 5). While the presence of nuclei cannot be excluded in the latter experiment, large crystals--rather than unobservable nuclei--could be expected at these low cooling rates. This inconsistency is not an isolated event, and similar inconsistencies were also observed. The solution to this inconsistency remains unclear at this point.
A summary of macroscopy observations and experimental data from the current exploratory study is listed in Tables 1 and 2, for VS55 (n=35) and DP6 (n=41) respectively. A large collection of images from the experiments listed in Tables 1 and 2 have been posted on the Internet [18], which could not be included in the current report for practical reasons. Note that the size of crystals, as well as the overall volume occupied by the crystals, are functions of the cooling rate and the subsequent rewarming rate. As shown in Fig. 3, sometimes the overall volume occupied by crystals is relatively small. The fact that observations presented in this report are based on visual effects that cannot be precisely quantified, and that ice formation regimes vary with the thermal history, may explain the variation in the observed Tm2 in Tables 1 and 2.
Except for one experiment, the cooling rate for all experiments listed in Table 1 is above the critical value of H1=2.5°C/min. Out of the 14 experiments in which no crystallization or RPC was observed, the rewarming rate in seven experiments was below the critical rewarming rate of H4=50°C/min, where in some experiments the rewarming rate was as low as one-third of the critical rate. Out of the 17 experiments in which RPC was observed, nine had both cooling and rewarming rates above their critical values. This inconsistency between cooling rates and crystal formation remains unexplained, but is likely to reflect the random statistical nature of nucleation in larger samples. Finally, fracture formation was observed during the cooling phase in three experiments, two of which are characterized by an exceptionally slow cooling rate of H2<1°C/min (see Part II for detailed discussion).
RPC was observed in almost all experiments with DP6, even in the three experiments with cooling and rewarming rates above the critical values of H1=40°C/min and H4=200°C/min (Table 2). Fracture formation was found in one-third of all DP6 experiments. Crystallization during cooling was found in only eight out of the 41 DP6 experiments. Due to the systematic observation of RPC in most DP6 experiments however, it is likely that very small crystals, not observable by the current device, did form during cooling. It remains unclear why large crystals were not observed in experiments with very low cooling rates, rates that were in some cases only 5% of the critical value. The appearance of large crystals during cooling at very low rates appears to be very inconsistent.
While the effect of crystals should ideally be eliminated for successful cryopreservation via vitrification, it has already been noted in the literature that when crystals do form, their potential damage is proportional to their typical size. In fact, it has already been suggested that when crystallization cannot be avoided, promotion of early crystallization having a typical small crystal size is likely to improve the outcome of cryopreservation, as discussed in more detail by others [7,24].
Finally, the upper surface of the cryoprotectant was observed to deform very slowly during cooling in all experiments. This is an indirect observation, which is associated with the reflection of light from the cryoprotectant upper surface. Here, a series of very fine rings typically form on upper surface of the cryoprotectant, and gradually move towards the center (i.e., the ring diameter decreases). This movement is the result of a difference in thermal expansion between the cryoprotectant and the vial. The ring formation and movement is very slow and can only be observed when the recorded movie is played fast-forward. During rewarming, however, the flattening of the upper surface back to its original shape is quite dramatic. The cryoprotectant upper surface starts to flatten rapidly between −100°C and −70°C; this process occurs over temperature intervals typically spanning 10°C to 15°C. RPC typically occurs as the cryoprotectant starts to flow, or immediately thereafter. This flattening effect is driven solely by the force of gravity and is directly related to the viscosity of the cryoprotectant. RPC is also directly related to the viscosity; at low viscosities molecules are relatively free to flow and, thereby, form crystals.
Summary
As a part of an ongoing effort to scale up vitrification to samples of clinically relevant size, the current line of research focuses on exploring thermal and mechanical effects during a typical vitrification protocol. For this purpose, a prototype device has been developed, named a “cryomacroscope.” The new cryomacroscope enables observations of crystallization and fracture formation in large samples, where a 1 mℓ sample in a 15 mℓ vial is demonstrated in the current study. However, the use of 15 mℓ is arbitrary, and the cryomacroscope can function with virtually any vial size. The cryomacroscope is not proposed as a substitute for the cryomicroscope, but only as complementary tool for the cryobiologist. The cryomacroscope is a mid-range imaging device, offering images between large scale photos, obtainable with a regular camera aimed at a large container, and those of traditional optical microscopy. While a rigid borescope is used in the current setup, a wide range of commercially available borescopes can be used as substitutes, with varying magnification, field of view, and possibly with a flexible shaft. The flexible borescope allows for observations inside regular refrigerators, in virtually any cryopreservation application. A combination of cryomacroscopy with cryomicroscopy is suggested as a basis for multi-scale cryobiology studies, which will benefit from both imaging approaches.
A total of 112 cryomacroscopy experiments were performed on VS55 and DP6 in this study. The report on experimental results is divided into two parts: solidification effects (the current paper) and temperature and solid mechanics effects (the companion paper). These two reports focus on cryoprotective agents in the absence of biological material. In conjunction with these reports, additional photos of cryomacroscopy of vitrification, crystallization, and fracture formation are available on the web site of the Biothermal Technology Laboratory at Carnegie Mellon University. The next phase of research, including biological materials, is currently in progress.
An inconsistency between similar experiments on the same cryoprotectant was identified. From 14 VS55 experiments in which no crystallization or RPC was observed, the rewarming rate in seven experiments was below the critical rewarming rate. Of the 17 VS55 experiments in which RPC was observed, in nine experiments both the cooling and the rewarming rates were above their critical values. Fracture formation was observed during the cooling phase in three VS55 experiments, two of which were characterized by an exceptionally slow cooling rate of H2<1°C/min. RPC was observed in almost all DP6 experiments--even in the three experiments with cooling and rewarming rates above the critical rates. Fracture formation was found in one-third of all DP6 experiments. It remains unclear why large crystals were not observed in experiments with very low cooling rates, some of the experiments being at a rate of about 5% of the critical value. The tendency to develop large crystals during cooling at very low rates appears to be very inconsistent.
Acknowledgment
This study has been supported in part by NHLBI, grant number R01 HL069944-01A1. We would like to thank Mr. Shailendra Jain, Organ Recovery Systems, Inc., for obtaining some of the experimental data reported in this paper.
References
- 1.Brower WE, Freund MJ, Baudino MD, Ringwald C. An hypothesis for survival of spermatozoa via encapsulation during plane front freezing. Cryobiology. 1981;18:277–291. doi: 10.1016/0011-2240(81)90099-7. [DOI] [PubMed] [Google Scholar]
- 2.Cosman MD, Toner M, Kandel J, Cravalho EG. An integrated cryomicroscopy system. Cryo-Lett. 1989;10:17–38. [Google Scholar]
- 3.Diller KR, Cravalho EG. A microscope for the study of freezing and thawing processes in biological cells. Cryobiology. 1971;7:191–199. doi: 10.1016/0011-2240(70)90021-0. [DOI] [PubMed] [Google Scholar]
- 4.Fahy GM. Biological effects of vitrification and devitrification. In: Pegg DE, Karow AM Jr., editors. The Biophysics of Organ Preservation. Plenum Publishing Corp.; New York: 1987. pp. 265–297. [Google Scholar]
- 5.Fahy GM, Levy D, Ali SE. Some emerging principles underlying the physical properties, biological actions, and utility of vitrification solutions. Cryobiology. 1987;24:196–213. doi: 10.1016/0011-2240(87)90023-x. [DOI] [PubMed] [Google Scholar]
- 6.Fahy GM, Saur J, Williams JR. Physical problems with the vitrification of large biological systems. Cryobiology. 1980;27:492–510. doi: 10.1016/0011-2240(90)90038-6. [DOI] [PubMed] [Google Scholar]
- 7.Fahy GM. The role of nucleation in cryopreservation. In: Lee RE Jr., Warren GJ, Gusta LV, editors. Biological Ice Nucleation and its Applications. APS Press; St Paul, Minnesota: 1998. pp. 315–336. [Google Scholar]
- 8.Karow AM. Biophysical and chemical considerations in cryopreservation. In: Karow AM, Pegg DE, editors. Organ Preservation for Transplantation. Dekker; New York: 1981. p. 113. [Google Scholar]
- 9.Korber CH, Scheiwe MW, Wollhover K. Solute polarization during planar freezing of aqueous solutions. J. Heat and Mass Trans. 1983;26:1241–1253. [Google Scholar]
- 10.Kroener C, Luyet BJ. Formation of cracks during the vitrification of glycerol solutions and disappearance of the cracks during rewarming. Biodynamica. 1966;10(201):47–52. [PubMed] [Google Scholar]
- 11.Luyet BJ. The Vitrification of Organic Colloids and of Protoplasm. Biodynamica. 1937;1(29):1–14. [Google Scholar]
- 12.Luyet BJ, Rapatz G. An automatically regulated refrigeration system for small laboratory equipment and a microscope cooling stage. Biodynamica. 1957;7(154):337–345. [PubMed] [Google Scholar]
- 13.Mazur P, Leibo SP, Chu EHY. A two-factor hypothesis of freezing injury. Exp. Cell Res. 1972;71:345–355. doi: 10.1016/0014-4827(72)90303-5. [DOI] [PubMed] [Google Scholar]
- 14.Mazur P. Freezing of living cells: mechanisms and implications. Am. J. Physiol. 1984;247:125. doi: 10.1152/ajpcell.1984.247.3.C125. [DOI] [PubMed] [Google Scholar]
- 15.Mehl P. Nucleation and crystal growth in a vitrification solution tested for organ cryopreservation by vitrification. Cryobiology. 1993;30:509–518. doi: 10.1006/cryo.1993.1051. [DOI] [PubMed] [Google Scholar]
- 16.Pegg DE, Jacobsen IA, Armitage WJ, Taylor MJ. Mechanisms of cryoinjury in organs. In: Pegg DE, Jacobsen IA, editors. Organ Preservation II. Churchill Livingstone; Edinburgh: 1979. pp. 132–146. [Google Scholar]
- 17.Plitz J, Rabin Y, Walsh J. The effect of thermal expansion of ingredients on the cocktails VS55 and DP6. Cell Preservation Technology. 2004;2(3):215–226. [Google Scholar]
- 18.http://www.me.cmu.edu/faculty1/rabin/CryomacroscopyImages01.htm Cryomacroscopy of vitrification: selected experiments on DP6 and VS55. 2005
- 19.Rabin Y, Plitz J. Thermal expansion of blood vessels and muscle specimens permeated with DMSO, DP6, and VS55 in cryogenic temperatures. Annals of Biomedical Engineering. 2004 doi: 10.1007/s10439-005-5364-0. submitted. [DOI] [PubMed] [Google Scholar]
- 20.Rubinsky B, Ikeda M. A microscope using directional solidification for the controlled freezing of biological material. Cryobiology. 1985;22:55–68. [Google Scholar]
- 21.Song YC, Khirabadi BS, Lightfoot FG, Brockbank KGM, Taylor MJ. Vitreous cryopreservation maintains the function of vascular grafts. Nature Biotechnology. 2000;18:296–299. doi: 10.1038/73737. [DOI] [PubMed] [Google Scholar]
- 22.Taylor MJ. Sub-zero preservation and the prospect of long-term storage of multicellular tissues and organs. In: Calne RY, editor. Transplantation Immunology: Clinical and Experimental. Oxford University Press; Oxford, New York, Tokyo: 1984. pp. 360–390. [Google Scholar]
- 23.Taylor MJ. Physico-chemical Principles of Low Temperature Biology. In: Grout BWW, Morris JG, editors. The Effects of Low Temperatures on Biological System. Edward Arnold; London: 1987. pp. 3–71. [Google Scholar]
- 24.Taylor MJ, Song YC, Brockbank KGM. Vitrification in tissue preservation: New developments. In: Fuller BJ, Lane N, Benson EE, editors. Life in the Frozen State. CRC Press; New York: 2004. pp. 603–641. [Google Scholar]