Abstract
Purpose: To evaluate a spectral imaging technique to detect the area of internal limiting membrane (ILM) peeling after vitrectomy for idiopathic macular hole.
Materials and Methods: In a prospective study, 15 eyes of 15 patients with idiopathic macular holes were tested. After vitrectomy with ILM peeling, retinal images were taken with color fundus photography, red-free fundus photography, and scanning laser ophthalmoscope imaging at 488 nm, 514 nm, 633 nm, and 780 nm. We calculated the Michelson contrast at the margin of ILM peeling, and each image was rank ordered for the ability to discern the margin of ILM peeling.
Results: The Michelson contrasts in scanning laser ophthalmoscope images at 488 nm and 514 nm were significantly larger than those in images at 633 nm and 780 nm and in the red-free fundus photograph. The scanning laser ophthalmoscope images at 488 nm and 514 nm were rated superior to images at 633 nm and 780 nm, the color fundus photograph, and the red-free fundus photograph.
Conclusion: The scanning laser ophthalmoscope images at 488 nm and 514 nm provide a better tool than some of the common clinical means for detection of the area of ILM peeling. This may assist with rapid, noninvasive assessment of ILM peeling.
Keywords: color fundus photograph, internal limiting membrane, macular hole, scanning laser ophthalmoscope, spectral imaging, vitrectomy
Idiopathic macular hole is a common macular entity in older adults, occurring predominantly in female patients.1 Recently, internal limiting membrane (ILM) peeling has become a widespread technique in vitrectomy for idiopathic macular hole.2 Identification of the area of ILM peeling is crucial to evaluate the efficacy of ILM peeling.
To determine whether there was removal of ILM and sparing of the deeper layers, monochromatic images that include a range of wavelengths may prove useful. Red-free fundus photography, readily available with both digital and film cameras, has been used to image the change at the retinal surface.3 Monochromatic images over a wide range of wavelengths, including the short wavelengths found in red-free photography, are readily obtained using the scanning laser ophthalmoscope (SLO). The clinical utility of the SLO to detect the margin of ILM peeling has been reported.4 In this study, we compared the effectiveness of visualizing the border of the ILM peeling with three types of techniques: spectral imaging with the SLO, color fundus photography, and red-free fundus photography.
Materials and Methods
This prospective study included 15 eyes of 15 Japanese patients (3 males and 12 females; age range, 47-77 years [mean, 63.6 years]) with idiopathic macular hole. Before testing, all patients received a detailed explanation of the study procedure and signed consent forms approved by the Institutional Review Board of the Tokyo Medical University. All eyes underwent pars plana vitrectomy with ILM peeling. Intraocular lenses had previously been implanted in 10 eyes; the remaining five eyes had clear crystalline lenses before and after vitrectomy. Standard three-port vitrectomy was performed, followed by surgical separation of the posterior cortical vitreous from the optic nerve head and posterior retina. An ILM peeling technique with indocyanine green (ICG) was used for all eyes.2 ILM peeling was performed by making a small opening and flap tear in the ILM with a vitreous forceps, and a continuous curvilinear tear was completely created around the macular hole. Air-fluid exchange with an injection of hexafluoride gas was performed. All patients were instructed to keep a prone position for 7 postoperative days. Anatomic closure was achieved in 14 of 15 cases at the 1-month follow up.
The images of the macula were taken 1 month after surgery. Retinal images of 40° × 25° were digitized using the Rodenstock SLO (Rodenstock, Inc., Munich, Germany). A confocal aperture of 800 μm with respect to the retina was used at 488 nm, 514 nm, 633 nm, or 780 nm. The focal plane was the retinal surface. Each image was stored in 8-bit tagged information file format at 640 × 480-pixel resolution. The color fundus photographs and the red-free fundus photographs of 35° × 25° were taken using a Topcon TRC50IX retinal camera (Topcon, Tokyo, Japan) with a Victor KY-F75 digital camera (Victor, Tokyo, Japan) and stored as 24 bit and 8 bit, respectively, in a tagged information file format at 630 × 450-pixel resolution.
The area of ILM peeling was confirmed by videotape recording of the surgical microscope. To evaluate the distinctness of the margin of ILM peeling objectively, edge contrast at the margin of ILM peeling was calculated using following formula: the Michelson contrast = (Ladj - Lilm)/(Ladj + Lilm), where Ladj is the mean of intensity of the area outside the area of ILM peeling at 0.5° from the boundary of ILM peeling and Lilm is the mean of the intensity at the area inside ILM peeling at 0.5° from the boundary. The Michelson contrast was used so that darker images, found for images acquired using the shorter wavelengths, could be compared with lighter images. The remnants of ICG were localized using a filter for ICG angiography in the SLO, and no residual ICG existed in the measurement area in any case.
For a subjective evaluation, two retinal specialists (T.A. and K.Y.) rank ordered the ability to discern the margin of ILM peeling using the criteria shown in Table 1. Each image was displayed on a computer monitor (LCD-A17VS, I-O data, Kanazawa, Japan). We hypothesized that there would be a monotonic wavelength effect on contrast and therefore better rank order of border distinctness for the shorter wavelength data. Further, we compared short wavelength data for the two data types, SLO imaging and photography. We used planned, matched-sample t-tests for planned comparison among the Michelson contrast data. We used Wilcoxon signed rank tests for statistical analysis for planned, paired comparisons of rank-order data. We compared the shorter wavelength conditions. We also compared the longer wavelength SLO images with the shorter wavelength SLO images (i.e., 488 nm or 514 nm vs. 633 nm or 780 nm).
Table 1.
Criteria for Grading a Margin of Internal Limiting Membrane Peeling
| Score | Criterion |
|---|---|
| Excellent | Margin is very clear. |
| Very good | Margin is clear. |
| Moderate | Margin is identifiable, but it is blurred. |
| Poor | Margin is barely identifiable. |
| Very poor | Margin is not identifiable. |
Results
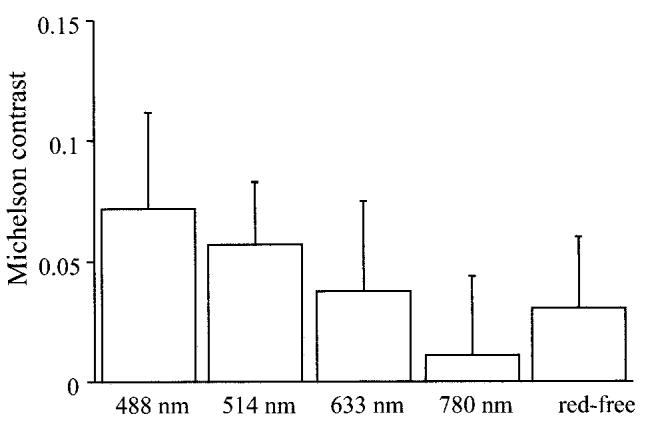
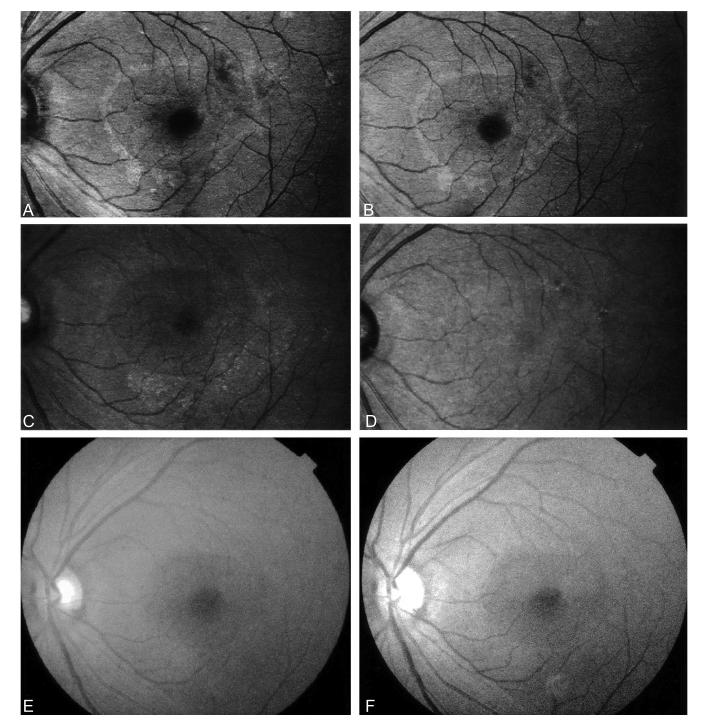
The Michelson contrasts at 488 nm and 514 nm were significantly better than those in red-free fundus photographs (P < 0.005, paired t-test; Fig. 1), images at 633 nm (P < 0.05, paired t-test; Fig. 1), and images at 780 nm (P < 0.005, paired t-test; Fig. 1). There was no significant difference between images at 488 nm and those at 514 nm (P = 0.16, paired t-test; Fig. 1). As can be seen in Figure 2, the 780 nm image appears almost uniform, while there is a distinct ring, indicating the edge of the ILM peeling, for both 488-nm and 514 nm images. There is a more distinct ring for the red-free fundus photograph than for the 780 nm image.
Fig. 1.

Michelson contrasts for internal limiting membrane peeling for idiopathic macular hole in scanning laser ophthalmoscope images at 488 nm, 514 nm, 633 nm, and 780 nm and red-free fundus photograph (red-free). Michelson contrasts in scanning laser ophthalmoscope images at 488 nm and 514 nm were significantly larger than those in other images.
Fig. 2.
Scanning laser ophthalmoscope images at 488 nm (A), 514 nm (B), 633 nm (C), and 780 nm (D); color fundus photograph (E); and red-free fundus photograph (F) after internal limiting membrane peeling. The subject was a 61-year-old woman with an idiopathic macular hole in her left eye. The macular hole was anatomically closed after vitrectomy with internal limiting membrane peeling. Michelson contrasts were 0.086 (488 nm), 0.077 (514 nm), 0.066 (633 nm), 0.031 (780 nm), and 0.049 (red-free).
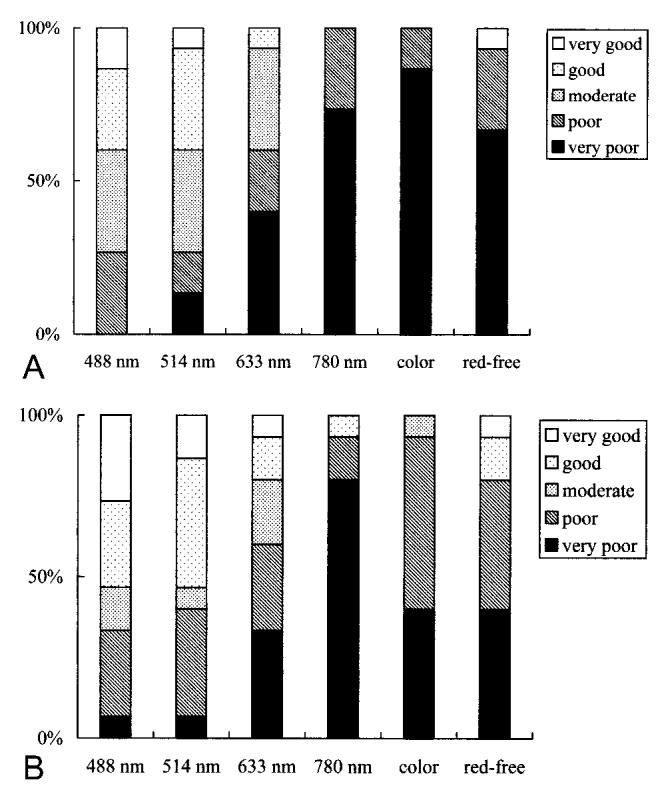
For the rank-order data of border distinctness, images at 488 nm were graded as better than images at 633 nm (P = 0.006 and 0.005, Wilcoxon signed rank test), images at 780 nm (P = 0.0006 and 0.0009), color fundus photographs (P = 0.0005 and 0.002), and red-free fundus photographs (P = 0.001 and 0.003) as ranked by T.A. and K.Y., respectively (Fig. 3). Images at 514 nm were also graded better than images at 633 nm (P = 0.01 and 0.005), images at 780 nm (P = 0.001 and 0.0008), color fundus photographs (P = 0.001 and 0.002), and red-free photographs (P = 0.006 and 0.005) as ranked by T.A. and K.Y., respectively (Fig. 3). There was no significant difference between images at 488 nm and those at 514 nm (P = 0.36 and 0.26) as ranked by T.A. and K.Y., respectively (Fig. 3).
Fig. 3.

Results of grading the margin of internal limiting membrane peeling (A by T.A. and B by K.Y.). The bar graphs show results for each grader for each image type: scanning laser ophthalmoscope images at 488 nm, 514 nm, 633 nm, and 780 nm; color fundus photograph (color); and red-free fundus photograph (red-free). The scanning laser ophthalmoscope images at 488 nm and 514 nm were graded superior to other images.
Discussion
In the current study, we compared the Michelson contrast, an objective measure of border distinctness, for red-free fundus photographs and several spectral SLO images to find the best imaging technique to detect the area of ILM peeling. The SLO images at the wavelengths of 488 nm and 514 nm, which had the highest edge contrasts values, were judged better than images at 633 nm and 780 nm, color fundus photographs, and red-free fundus photographs. Thus, the objective measure and subjective evaluation agreed, and a clear-cut answer was that the 488-nm or 514-nm images for the SLO provided the best technique.
The advantage of the SLO is high contrast images.5 Laser scanning technologies provide improvement of the contrast in retinal structures behind the degraded optics of an aging eye. The illumination of only one point at a time prevents scattering over long distances from adjacent structures. These benefits are crucial in eyes with macular hole for two reasons. First, macular hole affects largely an older population. Second, vitreous changes leading to traction and retinal surface changes are a significant part of the clinical entity at presentation, and there may be permanent anatomic changes that are not incorporated into the surgical procedure at the vitreoretinal interface. In contrast, color fundus photographs and red-free fundus photographs illuminate large a field of view. The resulting image is a combination of light reflected from the retinal surface, light passing into deeper layers and potentially scattering over longer distances, and light scattered by superficial bright lesions that may be several degrees away. Using an incident laser with a narrow spectral band in the short wavelength region, surface retinal structures could be observed with high contrast.4,5
An image of the human retina is constructed from the various sources of reflections, and an evaluation of the light-tissue interaction at the retina is an integral part in the design of optical devices for retinal diagnosis and the interpretation of the resulting images.6,7 The reflection at the retinal surface has been proposed to be the most important component, and many researchers8-10 have reported that the ILM is the major reflector at the retinal surface. The SLO images at 488 nm and 514 nm had high contrast across the borders and were also judged better than images at 633 nm or 780 nm. This finding indicates that the reflection at the ILM significantly contributes to retinal images at short wavelengths. With long wavelengths, the contribution is rather small compared with the presence of multiply scattered light from deeper fundus layers.
Whether the ILM peeling causes retinal damage is a fundamental question for any study using this surgical technique. A dissociated optic nerve fiber layer appearance after ILM peeling was reported.11,12 Retinal pigment epithelium changes and retinal edema were reported as an incident change after ILM peeling using ICG for the idiopathic macular hole.13 Retinal changes in the focal macular electroretinogram after ILM peeling were reported.14 Identification of an area of ILM peeling is crucial to evaluate the various types of retinal damage. Our results could assist the noninvasive assessment of vitrectomy with ILM peeling, in both direct clinical use and studies concerning surgical removal of the ILM.
In our case series, the remnants of ICG could not be observed in the measurement area. In a previous study, the persistence of ICG at 3 months after surgery was reported.15 Absorption spectrum of ICG is between 600 nm and 900 nm.16 With the presence of persistent ICG, the margin of ILM peeling should be emphasized in the SLO images at 780 nm and possibly at 633 nm. In contrast, our finding shows that the margin of the ILM peeling is clear at 488 nm and 514 nm, and the influence of ICG on the visibility of the margin of ILM peeling is thought to be small in our case series.
In this study, the boundary of ILM peeling resided in relatively normal retina. ILM peeling is used to treat diabetic maculopathy,17 and the margin of ILM peeling might be located in edematous or ischemic retina. With the presence of an abnormal lesion, the light-tissue interactions in the retina should be more complicated than in the normal retina. Further work is needed with a broader sample of patients to determine if a variation of wavelength, aperture size,6 or other experimental condition, as well as the use of othercommercially available instruments, produces results analogous to those of the present study, with a view of improving management techniques.
Footnotes
Supported by NEI EYO07624 awarded to Ann E. Elsner. The authors have no proprietary interest in the development or marketing of this or a competing instrument and software mentioned in this article.
References
- 1.Aaberg TM, Blair CJ, Gass JD. Macular holes. Am J Ophthalmol. 1970;69:555–562. doi: 10.1016/0002-9394(70)91620-x. [DOI] [PubMed] [Google Scholar]
- 2.Kadonosono K, Itoh N, Uchio E, et al. Staining of internal limiting membrane in macular hole surgery. Arch Ophthalmol. 2000;118:1116–1118. doi: 10.1001/archopht.118.8.1116. [DOI] [PubMed] [Google Scholar]
- 3.Blain P, Paques M, Massin P, et al. Epiretinal membranes surrounding idiopathic macular holes. Retina. 1998;18:316–321. doi: 10.1097/00006982-199807000-00004. [DOI] [PubMed] [Google Scholar]
- 4.Miura M, Elsner AE, Osako M, et al. Reflection from the internal limiting membrane in scanning laser ophthalmoscope images. Annual meeting of ARVO; Fort Lauderdale, FL, USA. May 8, 2002. [Google Scholar]
- 5.Elsner AE, Burns SA, Hughes GW, Webb RW. Reflectometry with a scanning laser ophthalmoscope. Applied Optics. 1992;31:3697–3710. doi: 10.1364/AO.31.003697. [DOI] [PubMed] [Google Scholar]
- 6.Elsner AE, Burns SA, Weiter JJ, Delori FC. Infrared imaging of sub-retinal structures in the human ocular fundus. Vision Res. 1996;36:191–205. doi: 10.1016/0042-6989(95)00100-e. [DOI] [PubMed] [Google Scholar]
- 7.Delori FC, Pflibsen KP. Spectral reflectance of the human ocular fundus. Applied Optics. 1989;28:1061–1077. doi: 10.1364/AO.28.001061. [DOI] [PubMed] [Google Scholar]
- 8.Van Norren D, Tiemeijer LF. Spectral reflectance of the human eye. Vision Res. 1986;26:313–320. doi: 10.1016/0042-6989(86)90028-3. [DOI] [PubMed] [Google Scholar]
- 9.Rushton W. Stray light and the measurement of mixed pigments in the retina. J Physiol. 1965;176:46–55. doi: 10.1113/jphysiol.1965.sp007534. [DOI] [PMC free article] [PubMed] [Google Scholar]
- 10.Weinreb RN, Dreher AW, Bille JF. Quantitative assessment of the optic nerve head with the laser tomographic scanner. Int Ophthalmol. 1989;13:25–29. doi: 10.1007/BF02028633. [DOI] [PubMed] [Google Scholar]
- 11.Tadayoni R, Paques M, Massin P, et al. Dissociated optic nerve fiber layer appearance of the fundus after idiopathic epiretinal membrane removal. Ophthalmology. 2001;108:2279–2283. doi: 10.1016/s0161-6420(01)00856-9. [DOI] [PubMed] [Google Scholar]
- 12.Miura M, Elsner AE, Osako M, et al. Dissociated optic nerve fiber layer appearance after internal limiting membrane peeling for idiopathic macular hole. Retina. 2003;23:561–563. doi: 10.1097/00006982-200308000-00024. [DOI] [PubMed] [Google Scholar]
- 13.Gandorfer A, Haritoglou C, Gass CA, et al. Indocyanine green-assisted peeling of the internal limiting membrane may cause retinal damage. Am J Ophthalmol. 2001;132:431–433. doi: 10.1016/s0002-9394(01)01087-x. [DOI] [PubMed] [Google Scholar]
- 14.Terasaki H, Miyake Y, Nomura R, et al. Focal macular ERGs in eyes after removal of macular ILM during macular hole surgery. Invest Ophthalmol Vis Sci. 2001;42:229–234. [PubMed] [Google Scholar]
- 15.Tadayoni R, Paques M, Girmens JF, et al. Persistence of fundus fluorescence after use of indocyanine green for macular surgery. Ophthalmology. 2003;110:604–608. doi: 10.1016/S0161-6420(02)01761-X. [DOI] [PubMed] [Google Scholar]
- 16.Haritoglou C, Gandorfer A, Schaumberger M, et al. Light-absorbing properties and osmolarity of indocyanine-green depending on concentration and solvent medium. Invest Ophthalmol Vis Sci. 2003;44:2722–2729. doi: 10.1167/iovs.02-1283. [DOI] [PubMed] [Google Scholar]
- 17.Gandorfer A, Messmer EM, Ulbig MW, Kampik A. Resolution of diabetic macular edema after surgical removal of the posterior hyaloid and the inner limiting membrane. Retina. 2000;20:126–133. [PubMed] [Google Scholar]


