

Abstract
Nitric oxide (NO) modulates the uptake and/or release of neurotransmitters through a variety of cellular mechanisms. However, the pharmacological and biochemical processes underlying these neurochemical effects of NO often remain unclear. In our study, we used immunocytochemical methods to study the effects of NO, cyclic guanosine monophosphate (cGMP), and peroxynitrite on the uptake and release of γ-aminobutyric acid (GABA) and glycine in the turtle retina. In addition, we examined the involvement of glutamate receptors, calcium, and the GABA transporter in this GABA uptake and release. We also tested for interactions between the GABAergic and glycinergic systems. In general, we show that NO stimulated GABA release and inhibited glycine release. The NO-stimulated GABA release involved calcium-dependent or calcium-independent synaptic release or reversal of the GABA transporter. Some effects of NO on GABA release involved glutamate, cGMP, or peroxynitrite. NO promoted glycine uptake and inhibited its release, and this inhibition of glycine release was influenced by GABAergic modulation. These findings indicate that NO modulates the levels of the inhibitory transmitters GABA and glycine through several specific biochemical mechanisms in different retinal cell types and layers. Thus it appears that some of the previously described reciprocal interactions between GABA and glycine in the retina function through specific NO signaling pathways.
Keywords: turtle; neurotransmitter; release, uptake; modulation
Nitric oxide (NO) plays diverse roles in the regulation of neurotransmission mediated by conventional neurotransmitters. In the brain or retina of different species, NO has been found to affect the release of acetylcholine (ACh; Trabace and Kendrick, 2000; Kraus and Prast, 2001; Okada et al., 2001), glutamate (GLU; for review, see Zhang and Snyder, 1995; Prast and Philippu, 2001), γ-aminobutyric-acid (GABA, Ientile et al., 1997; Nauli et al., 2001; McLean and Sillar, 2002; Wall, 2003), dopamine (DA; Segovia and Mora, 1998), and serotonin (Ginap and Kilbinger, 1998). However, the mechanisms by which NO modulates the release of these transmitters often remain unclear. There is evidence that NO affects transmitter release through cyclic guanosine monophosphate (cGMP)-mediated pathways (Guevara-Guzman et al., 1994; Kraus and Prast, 2002) or through peroxynitrite (ONOO-), the oxidative byproduct of NO (Ohkuma et al., 1995; Trabace and Kendrick, 2000), each leading to Ca2+-dependent release or release through Na+-dependent transporter reversal (Ohkuma et al., 1996a,b). Other evidence indicates that NO can activate the synaptic vesicle docking proteins (Meffert et al., 1994, 1996) or can activate persistent Na+ influx (Hammarström and Gage, 1999; Ahern et al., 2000). NO may also modulate the release of a transmitter indirectly by enhancing presynaptic excitatory or inhibitory synaptic inputs.
Both neuronal nitric oxide synthase (nNOS), the enzyme that produces NO, and soluble guanylate cyclase (sGC), the primary target of NO, have been localized in specific neurons in the turtle retina (Blute et al., 1997, 1998). NOS has also been shown to colocalize with either GABA or glycine (GLY) in turtle retina (Haverkamp et al., 2000), suggesting that NO may modulate GABAergic or glycinergic neurotransmission. The goal of this study was to use immunocytochemical methods to determine whether and how these NO-dependent mechanisms contribute to the modulation of inhibitory neurotransmission in the retina. We focused on the two primary inhibitory neurotransmitters in the retina, GABA and GLY.
The turtle retina is ideal for our study, as the anatomy of GABAergic neurons and glycinergic neurons are well documented (Hurd and Eldred, 1989; Eldred and Cheung, 1989). Therefore, our first hypothesis was that NO can affect the release of both GABA and GLY in the turtle retina. Our second hypothesis was that NO modulates neurotransmitter release through different mechanisms and that its effects on a specific neuron depend on three factors: the availability of the target molecules for NO in the particular neuron; the synaptic connections of the neuron; and the physiological oxidation state of the micro-environment of the neurons, which determines the ratio between NO and ONOO-.
MATERIALS AND METHODS
Reagents
All reagents were from Sigma-Aldrich (St. Louis, MO) with the following exceptions: citric acid and sodium citrate dihydrate (J.T. Baker, Phillipsburg, NJ); hydroquinone (Eastman Kodak, Rochester, NY); silver nitrate (Fisher Scientific, Fair Lawn, NJ); DETA NONOate (DETA, Alexis, Carlsbad, CA); 4 nm colloidal gold goat-anti-rabbit IgG (Jackson ImmunoResearch, West Grove, PA); and 3-morpholinylsydnoneimine chloride (SIN-1, Tocris, Ellisville, MO). The γ-vinyl-GABA (GVG) and the rabbit polyclonal antibodies against GVG and GLY came from Dr. David V. Pow (Vision, Touch and Hearing Research Centre, Department of Physiology and Pharmacology, The University of Queensland, Brisbane, Queensland, Australia).
Tissue preparation and in vitro incubations
Adult turtles (Pseudemys scripta elegans) were maintained on a 12-hour light/12-hour dark cycle. Fourteen animals were used for this study, and at least three animals were used for each of the pharmacological treatments. Near the middle of the light cycle, they were decapitated by using a method that was consistent with NIH guidelines and that was approved by the Boston University Charles River Campus Institutional Animal Care and Use Committee. The enucleated eyes were hemisected along the vertical midline perpendicular to the visual streak and then cut into 8-10 thin slices. The isolated turtle retinal slices were preincubated for 15 minutes in an aerated, balanced salt solution (BSS; 110 mM NaCl, 2.5 mM KCl, 3 mM CaCl2, 2 mM MgCl2, 10 mM glucose, and 5 mM HEPES), pH 7.4, at room temperature.
Using GVG to monitor GABA release
It was not possible to detect the release of GABA directly by using conventional immunocytochemistry, as the changes in response to release were too small to detect in comparison with the high endogenous levels of GABA. Therefore, we used a nonendogenous GABA analog, GVG, to preload the GABAergic neurons so that we could detect the release of GABA. GVG has been demonstrated previously to be taken into GABAergic amacrine and horizontal cells through the high-affinity GABA uptake transporter (Pow et al., 1996). Retinal slices were incubated in 1 mM GVG in aerated BSS for 60 minutes, before they were treated with one of the following in BSS for 30 minutes: control retinas were left in BSS; 100 μM DETA (a NO donor); 100 μM 8-bromo-cGMP (8BrcGMP, a membrane-permeable analog of cGMP); 100 μM SIN-1 (a donor for ONOO-); high-potassium BSS (High-K, 62.6 mM NaCl, 50 mM KCl, 1 mM CaCl2, 1 mM MgCl2, 10 mM glucose, and 10 mM HEPES, pH 7.4); 100 μM DETA with 100 μM nipecotic acid (NA; a selective blocker of the GABA transporter); 100 μM DETA in calcium-free, cadmium BSS (Ca2+ replaced with 1 mM Cd2+); 100 μM DETA with 100 μM NA in calcium-free, cadmium BSS; 100 μM DETA with 100 μM of an antagonist for N-methyl-D-aspartate (NMDA) receptors (5R,10S)-(+)-5-methyl-10,11-dihydro-5H-dibenzo [a,d] cyclohepten-5,10-imine (MK801) and 100 μM of an antagonist for AMPA/KA receptors 6-cyano-7-nitroquinoxaline-2,3-dione (CNQX); DETA with MK801, CNQX, and NA (all at 100 μM); 100 μM DETA with 5 mM L-cysteine (Lcys, a scavenger for ONOO-); or 5 mM Lcys alone.
Glycine uptake experiments
To show whether NO affects the uptake process of GLY, we used sarcosine, a competitive GLY transporter inhibitor, to deplete the endogenous GLY (Pow, 1998; Vaney and Pow, 2000). Retinal slices were incubated with 5 mM sarcosine in aerated BSS for 180 minutes. After thorough rinsing, they were then transferred to aerated BSS containing 1 mM GLY with or without one of the following for 30 minutes: 100 μM DETA, 100 μM SIN-1, 100 μM 8BrcGMP, 100 μM S-methyl-L-thiocitrulline (SMTC, a NOS inhibitor), 100 μM bicuculline (BIC, an antagonist for GABAA receptors), or 100 μM SMTC with 100 μM BIC. Control retinas were left in the sarcosine solution.
Glycine release experiments
For the same reason that we used GVG, we also wanted to enhance the detection of GLY release by improving the ratio of the release in comparison with the endogenous levels. Although a GLY analog is not available, GLY levels can be enhanced above the endogenous levels by loading the retinas with exogenous GLY. Retinal slices were incubated in aerated BSS containing 1 mM GLY for 60 minutes. After thorough rinsing, the retinal slices were incubated in aerated BSS containing one of the following for 30 minutes: High-K, 100 μM DETA, 100 μM SIN-1, 100 μM 8BrcGMP, 100 μM SMTC, 100 μM BIC, or 100 μM SMTC with 100 μM BIC. Control retinas were left in normal BSS after GLY loading.
Tissue preparation
Following the pharmacological incubations, the retinal slices were fixed with 2% paraformaldehyde and 2% glutaraldehyde in 0.2 M sodium cacodylate, pH 7.4, for 180 minutes. After fixation, the slices were then dehydrated in an acetone series, embedded in Eponate 812 resin embedding compound (Ted Pella, Redding, CA), and cut using a Leica Ultracut microtome (Leica, Wien, Austria) into 1-μm-thick cross sections that were mounted onto plain glass slides. The resin was then etched from the sections by using a saturated solution of NaOH in ethanol for 10 minutes, and the sections were rinsed in 100% methanol for three 2-minute sessions prior to the immunocytochemical treatments.
Silver-intensified immunocytochemistry
All antisera solutions were diluted in 0.1 M phosphate buffer (PB) with 0.3% Triton X-100 at pH 7.4. To control for nonspecific labeling, sections were pretreated with 2% normal goat serum for 60 minutes at room temperature in a moist dark chamber. The sections were then incubated overnight in a 1:10,000 dilution of rabbit antiserum raised against either GVG or GLY. The production, characterization, and specificity of these antisera have been described previously (Pow et al., 1995, 1996). The sections were subsequently labeled using silver-intensified immunocytochemical techniques employing 4 nm colloidal gold-conjugated goat-anti-rabbit IgG (diluted 1:1,000) and a silver intensification solution (Signature Immunologics, Salt Lake City, UT; www.immunologics.com). This intensification solution was made by using the following stock solutions: Stock A = 114 mg citric acid + 342 mg sodium citrate in 6 ml deionized water; Stock B = 0.5 g hydroquinone in 15 ml deionized water; and Stock C = 1% aqueous silver nitrate. These stock solutions were mixed using 5 ml A + 1mlB + 1 ml C to make a working solution that was applied to the sections for 8-10 minutes. The reaction was stopped by treating the sections with 5% acetic acid. Sections from all treatments in a given experiment were simultaneously labeled on the same slide to eliminate any methodological variability.
Quantitative analysis
Digital images were acquired by using a CCD camera (Apogee Instruments, Auburn, CA) and MaximDL™ software (Cyanogen Productions, Ottawa, ON, Canada) at 600× magnification. Each treatment had images taken from three different animals. The optical density of the immunoreactivity was quantified using Image-Pro Plus™ software (Media Cybernetics, Carlsbad, CA). The optical densities are presented as line-profile averages of a chosen region of retina. We interpreted a decrease in optical density to be indicative of transmitter release, whereas an increase indicated the inhibition of release. The optical densities of 30 sections of the same treatment from three animals (10 samples per animal) were then averaged for comparison between treatments. The peak values (PVs) or the area-under-curve (AUC) values were statistically compared by using an ANOVA Dunnett’s Test (XLStat Pro™ plug-in, Addinsoft, Brooklyn, NY, for Excel™, Microsoft, Redmond, WA). All quantification data are presented as means ± SEM. All significance claims are based on P < 0.05 (n = 3) unless noted otherwise. Counts of glycinergic amacrine cell somata were done using digital images taken at the same magnification of equal areas of retina. The labeled amacrine cell somata were identified based on the previously described morphology of glycinergic amacrine cells (Eldred and Cheung, 1989). Differences in somata counts were statistically compared by using the same ANOVA Dunnett’s Test described above.
The stratification within the inner plexiform layer (IPL) of the retinal cross sections is described such that the border between the inner nuclear layer (INL) and the IPL is S0, the middle of the IPL is S50, and the border between the IPL and the ganglion cell layer (GCL) is S100. The images were then arranged and labeled using Corel Photo-Paint™ and Corel Draw™ (Corel, Ottawa, ON, Canada).
RESULTS
Effects of NO on GABA release and uptake
GABA is one of the most prevalent neurotransmitters in the retina (for review, see Pourcho, 1996; WaÄssle et al., 1998; Bormann, 2000). In turtle retina, GABA is localized in numerous H1 horizontal cells and in amacrine cells and their processes that form prominent bands in S17, S28, S67, S84, and S95 of the IPL (Hurd and Eldred, 1989). The high endogenous levels of GABA make it impossible to use GABA immunocytochemistry to detect GABA release, because the ratio of release to endogenous levels is too low to show release effectively. Therefore, we used a nonendogenous GABA analog, GVG, to eliminate the effects of the high endogenous GABA levels and to prevent complications due to endogenous GABA synthesis or degradation (Pow et al., 1996). The use of silver-intensified gold immunocytochemistry on 1-μm plastic embedded sections has the advantage of giving high-resolution quantitative labeling (Marc et al., 1990).
The strategy for studying GABA release was to first preload the retinas with GVG, then pharmacologically stimulate them, and then use GVG immunocytochemistry to detect any decreases in GVG-like immunoreactivity (GVG-LI) in comparison with controls as an indication of GABA release. In order to examine any effects on GABA uptake, the retinal slices were coincubated with GVG in the presence of the pharmacological stimulus to be tested, and then GVG immunocytochemistry was used to detect any increases in GVG-LI in comparison with controls as an indication of GABA uptake.
NO donor stimulated GVG release and prevented GVG uptake
As expected, without GVG loading, there was no endogenous GVG-LI anywhere in the retina (Fig. 1A). Loading the retinas with 5 mM GVG for 60 minutes (Fig. 1B), however, dramatically increased the levels of GVG-LI in the regions where high levels of GABA are normally found: H1 horizontal cells, select amacrine cell somata, and bands formed by processes in S17-S28 and S67-S95 of the IPL. This localization closely resembles the distribution of endogenous GABA (Hurd and Eldred, 1989). However, pretreatment with 100 μM DETA dramatically prevented GVG loading, leaving all the GABAergic cells and their processes only faintly labeled (Fig. 1C). Incubating retinas with 100 μM DETA for 30 minutes after they were loaded with GVG (Fig. 1D) also dramatically reduced the levels of GVG-LI in the horizontal cells, and in the amacrine cell somata and their processes. These results support our first hypothesis that NO modulates GABA release.
Fig. 1.
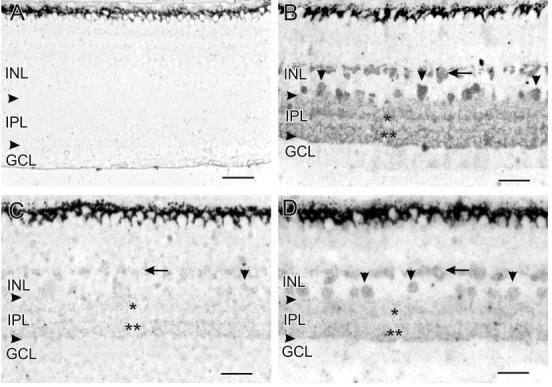
The horizontal arrowheads in Figures 1, 2, 5, and 6 indicate the borders of the IPL. In this figure and Figure 2, the localization of GVG-LI is indicated as follows: horizontal cells (horizontal arrows), amacrine cell somata (vertical arrowheads), S17-S28 of the IPL (single asterisks), and S67-S95 of the IPL (double asterisks). A: Without loading with GVG, there was no endogenous GVG-LI anywhere in the retina. B: Loading with 5 mM GVG for 60 minutes dramatically increased GVG-LI in the retina, showing labeling patterns that match those of GABA. H1 horizontal cells, amacrine cell somata, and labeled bands within the IPL are clearly visible. Probably due to the thin sections used in our study, the GABAergic bands at S17 and S28 appear as one thick band, and the GABAergic bands at S67, S84, and S95 also appear as one continuous band with elevated GVG-LI. C: Loading with GVG in the presence of 100 μM DETA for 60 minutes dramatically prevented an increase in GVG-LI. There was virtually no GVG-LI in horizontal cells and only extremely faint GVG-LI in some amacrine cell somata and the IPL. D: Incubating retinas with 100 μM DETA for 30 minutes after loading with GVG dramatically reduced the levels of GVG-LI in horizontal cells, amacrine cell somata, and bands formed by processes in the IPL. For abbreviations, see list. Scale bars = 25 μm.
Our next step was to study the mechanisms involved in NO-stimulated GABA release by systematically testing each potential mechanism mentioned earlier. To quantify the differences between treatments, we measured the PVs, defined as the highest optical density of GVG-LI in a given retinal layer for each treatment, and compared them statistically (see Fig. 3 for a line profile summary and Fig. 4 for a statistical analysis of the peak values).
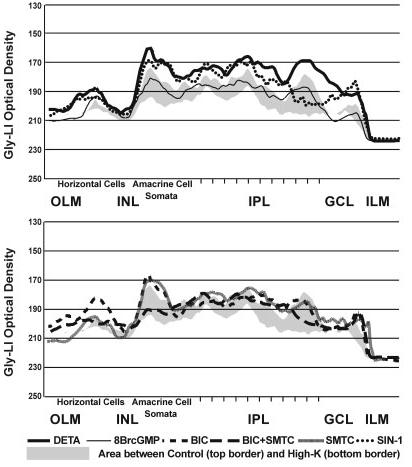
Fig. 3.
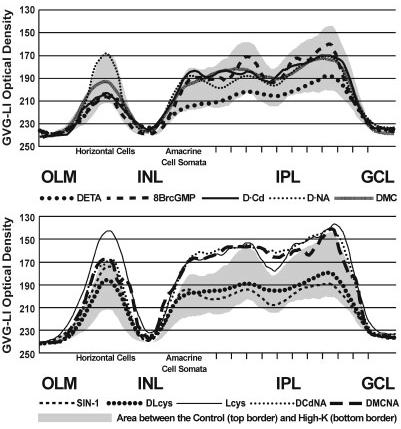
Mechanisms of NO-stimulated GVG release. The line profile curve averages for the GVG release experiments are presented together to show the differences between the various treatments in specific retinal layers. The line profile curve of the control is shown as the top border of the gray shading, and the line profile curve for the High-K treatment is shown as the bottom border of the gray shading. For abbreviations, see list.
Fig. 4.
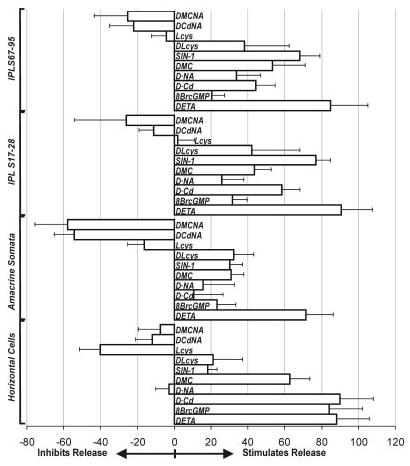
The efficacy of a given treatment in stimulating GVG release from specific retinal layers was calculated based on the peak values (PVs) from each treatment. The PVs were measured, and their average differences from the control were compared against the difference between the control and the High-K stimulation, which was considered as 100% release. For abbreviations, see list.
Controls had strong GVG-LI and High-K-stimulated GVG release
In control retinas loaded with GVG, GVG-LI was strong in horizontal cells, in amacrine cell somata, and in S17-28 and S67-95 of the IPL (Fig. 2A). This labeling produced four prominent peaks in the line profile curve (Fig. 2A, gray shade in the line profile box, with higher densities being toward the right in all the line profile curves presented in this study). Depolarization with High-K significantly reduced GVG-LI in all four peaks (Fig. 2B, white region to the left in the line profile box; Figs. 3, 4). To evaluate the effects of other pharmacological treatments (Ex) quantitatively, we defined the efficacy of High-K stimulation as 100% release and the control retinas loaded with GVG as 0% release. The efficacy of the other treatments in stimulating GVG release was defined based on comparison with the efficacy of High-K-stimulated release as follows: Ex = (PVcontrol - PVx)/(PVcontrol - PVHigh-K) × 100%. If Ex > 100%, the treatment was more effective than High-K in stimulating GVG release; if 0% ≤ Ex < 100%, the treatment was less effective than High-K in stimulating GVG release; and if Ex < 0%, the treatment inhibited GVG release.
Fig. 2.

In this plate, a corresponding line profile curve box is attached to the right side of each image. These line profile curves were generated by scanning and averaging the optical density of GVG-LI in a comparable region of 10 retinal samples from the same treatment. Higher levels of GVG-LI are indicated to the right and as darker shades in the shade gradient box beneath the line profile curves. All retinas were preloaded with GVG prior to the pharmacological treatments. A: Retinas loaded with GVG that were left in normal BSS were used as controls. The levels of GVG-LI were high in horizontal cells, in amacrine cell somata, in S17-S28 of the IPL, and in S67-S95 of the IPL. The line profile curve of this treatment is shown as the right border of the gray shading throughout this figure. B: In High-K treated retinas, the GVG-LI was dramatically reduced. This line profile curve is presented as the left borderline of the gray shading throughout this figure. C: Retinas treated with 100 μM DETA showed similar effects to High-K, with reduced GVG-LI in all layers. This line profile curve is presented as a dark line. The same indications of the control, High-K, and the specific pharmacological treatment as a dark line are used for all the subsequent panels in this figure. D: Treatment with 100 μM 8BrcGMP simulated the effects of either DETA or High-K in the outer retina by producing a dramatic reduction in GVG-LI in the horizontal cells. The other retinal layers only showed slight decreases in GVG-LI. E: Removal of external Ca2+ and replacing it with Cd2+ (D·Cd) reduced the effects of DETA in the IPL, producing only moderate decreases in the levels of GVG-LI. There was still a strong DETA-stimulated decrease in GVG-LI in the outer retina. F: NA (100 μM) blocked the effects of DETA in the outer retina and reduced the effects of DETA in the IPL. G: The combination of Cd2+ and NA effectively blocked the effects of DETA in all retinal layers. H: MK801 and CNQX reduced part of the DETA stimulated release in all layers. I: Combining NA with MK801 and CNQX (100 μM each) eliminated the DETA-stimulated release in all retinal layers. J: SIN-1 (100 μM) mimicked the effects of DETA in the inner retina but failed to do so in the outer retina. K: The ONOO- scavenger Lcys (100 μM) reduced a portion of the DETA-stimulated release in the inner and outer retina, indicating that some DETA effects were acting through ONOO-L: Lcys alone slightly increased the GVG-LI in the horizontal cells whereas it appeared to have little effect in the other retinal layers. For abbreviations, see list. Scale bars = 25 μm.
Stimulation with DETA reduced GVG-LI
To examine the effects of NO on GABA release, we stimulated GVG-loaded retinas with 100 μM DETA. This treatment reduced GVG-LI in the horizontal cell layer (EDETA = 88 ± 18%), amacrine cell somata (EDETA = 71 ± 15%), IPL S17-28 (EDETA = 91 ± 17%), and IPL S67-95 (EDETA = 85 ± 20%; Fig. 2C; the bold line in the line profile boxes refers to the pharmacological treatment used in all similar figures in this paper; Figs. 3, 4).
Cyclic GMP-stimulated GVG release was most effective in horizontal cells
To test whether cGMP-mediated mechanisms played a role in the effects of NO on GABA release, we stimulated with 8BrcGMP. Incubation with 100 μM 8BrcGMP reduced GVG-LI in the amacrine cell somata (E8BrcGMP = 23 ± 10%), S17-28 of the IPL (E8BrcGMP = 32 ± 8%), and in S67-95 of the IPL (E8BrcGMP = 20 ± 7%), but its effect in the horizontal cell layer was far more dramatic (E8BrcGMP = 84 ± 18%; Figs. 2D, 3, 4).
Ca2+ influenced NO-stimulated GVG release more in the inner retina
To examine whether NO-stimulated GVG release was Ca2+ dependent, we stimulated with 100 μM DETA in calcium-free, cadmium BSS (this treatment is referred to as D-Cd, as we used Cd2+ to replace Ca2+). This treatment did not significantly affect the effects of DETA in the horizontal cells (E D-Cd = 90 ± 18%) but had larger effects in amacrine cell somata (ED-Cd = 11 ± 16%), S17-28 of the IPL (ED-Cd = 58 ± 10%), and S67-95 of the IPL (ED-Cd = 44 ± 11%; Figs. 2E, 3, 4).
NA prevented NO-stimulated GVG release more in the outer retina
To test whether the GABA transporter was involved in NO-stimulated GVG release, we used the selective GABA transporter inhibitor nipecotic acid (NA, 100 μM) together with DETA (this treatment is referred to as D-NA). NA clearly blocked DETA-stimulated GVG release in the horizontal cells (ED-NA =-3 ± 7%), whereas the GVG-LI in the amacrine cells (ED-NA = 16 ± 17%), S17-28 in the IPL (ED-NA = 26 ± 12%), and S67-95 in the IPL (ED-NA = 34 ± 13%) was less reduced (Figs. 2F, 3, 4).
The combination of Cd2+ and 100 μM NA completely eliminated the effects of DETA (this treatment is referred to as DCdNA) and maintained high GVG-LI levels in the horizontal cells (EDCdNA =-12 ± 9%), amacrine cells (EDCdNA =-54 ± 11%), S17-28 of the IPL (EDCdNA =-11 ± 8%), and S67-95 of the IPL (EDCdNA =-22 ± 13%; Figs. 2G, 3, 4).
Glutamate release was involved in NO-stimulated GVG release
Because NO has been shown to stimulate GLU release (for review, see Zhang and Snyder, 1995; Prast and Philippu, 2001), we tested whether NO-stimulated glutamate release was involved in the effects of NO-stimulated GABA release by using selective antagonists for glutamate receptors together with DETA.
Blocking NMDA and AMPA/kainate receptors by using a combination of 100 μM MK801 and 100 μM CNQX (this treatment is referred to as DMC) reduced the NO-stimulated GVG release from horizontal cells (EDMC = 63 ± 11%), amacrine cells (EDMC = 31 ± 7%), S17-28 of the IPL (EDMC = 44 ± 9%), and S67-95 of the IPL (EDMC = 53 ± 18%; Figs. 2H, 3 4). MK801 and CNQX alone had no effect on GVG release (data not shown). However, MK801 and CNQX did not completely block the effects of NO. Experiments using both glutamatergic antagonists and NA together (this treatment is referred to as DMCNA) reduced the effects of DETA in horizontal cells (EDMCNA =-7 ± 12%), amacrine cells (EDMCNA =-56 ± 18%), S17-28 of the IPL (EDMCNA =-26 ± 28%), and S67-95 of the IPL (EDMCNA =-25 ± 18%; Figs. 2I, 3, 4).
ONOO- was involved in the effects of DETA with a larger role in the inner retina
To investigate whether NO-stimulated GVG release involved ONOO-, we used an ONOO- donor, SIN-1 (100 μM), to stimulate retinas loaded with GVG. Under the normal physiological conditions used in our experiments, SIN-1 functions as a good ONOO- donor because it simultaneously generates superoxide and NO, which can react in a diffusion-limited reaction to form ONOO- (Beckman and Koppenol, 1996). SIN-1 slightly reduced the GVG-LI in the horizontal cells (ESIN-1 = 18 ± 5%), but it had a much stronger effect on the inner retina, leading to larger reductions in GVG-LI in the amacrine cells (ESIN-1 = 30 ± 7%), in S17-28 of the IPL (ESIN-1 = 77 ± 8%), and in S67-95 of the IPL (ESIN-1 = 68 ± 11%; Figs. 2J, 3, 4). This result is also supported by the experiments using the ONOO- scavenger Lcys (5 mM) together with DETA (treatment referred to as DLcys), as Lcys reduced the effects of DETA in the horizontal cells (EDLcys = 21 ± 16%), amacrine cells (EDLcys = 32% ± 11%), S17-28 of the IPL (EDLcys = 42 ± 26%), and S67-95 of the IPL (EDLcys = 38% ± 24%; Figs. 2K, 3, 4). However, the effects of Lcys in the horizontal cell layer may be complicated, because Lcys alone seems to have prevented the GVG release in the horizontal cells (ELcys =-40 ± 11%) and amacrine cells (ELcys =-16 ± 9%), whereas it had little effect in S17-28 of the IPL (ELcys = 2 ± 9%), and in S67-95 of the IPL (ELcys =-4 ± 8%; Figs. 2L, 3, 4). Therefore, we cannot conclude that ONOO- had a strong role in the horizontal cells because Lcys alone also prevented the release of GVG through an unknown mechanism.
Effects of NO on glycine release
Glycine is the other major inhibitory neurotransmitter in the retina (Pourcho, 1996). Previous studies have identified glycinergic amacrine cells, ganglion cells, and inter-plexiform cells in turtle retina (Eldred and Cheung, 1989). Although GLY was also found in some bipolar cells in turtle, it is has been postulated in other species that these bipolar cells only contain GLY because it passes through bipolar-amacrine cell gap junctions and that they do not use GLY as a transmitter (Pow, 1998; Vaney et al., 1998).
Because we do not have a GVG-like analog for GLY to enhance the background-to-release ratio, our strategy was twofold. First, to examine the effects of NO on GLY up-take, we depleted the endogenous GLY with the competitive GLY transporter inhibitor sarcosine (5 mM, 3 hours) and then reloaded with GLY (1 mM, 30 minutes) in the presence or absence of drugs that allowed us to examine their effects on the uptake of GLY. Second, in the experiments examining GLY release, we first loaded the retinas with GLY (1 mM, 3 hours) to enhance the endogenous GLY-like immunoreactivity (GLY-LI). These increased levels of GLY allowed us to detect GLY release more easily. There was no qualitative difference in the localization of GLY in these GLY-loaded retinas, in that the same cell types also showed GLY-LI, but the GLY-LI in these cells was increased.
Due to the diffuse distribution of GLY in the IPL, we divided the GLY-LI in the retina into just two regions, the INL and the IPL. We used the total AUC value in each region for our comparisons. For uptake experiments, the level of GLY-LI seen with GLY loading (GLYonly) was defined as 100% uptake, and the level of GLY-LI in the unloaded controls was 0%. The efficacy of other treatments in promoting GLY uptake was defined as: Ex = (AUCx - AUCcontrol)/(AUCGLYonly - AUCcontrol) × 100%. If Ex > 100%, the treatment promoted GLY uptake; if 0% ≤ Ex < 100%, the treatment prevented GLY uptake; and if Ex < 0%, the treatment further depleted GLY. For the release experiments, the efficacy of High-K-stimulated GLY release on GLY-loaded retinas was defined as 100% release, the levels of GLY-LI in unstimulated GLY-loaded control retinas was defined as 0% release, and the efficacy of other treatments in stimulating GVG release was defined as: Ex = (AUCcontrol - AUCx)/(AUCcontrol - AUCHigh-K) × 100%. If Ex > 100%, the treatment was more effective than High-K in stimulating GLY release; if 0% < Ex < 100%, the treatment was less effective than High-K in stimulating GLY release; and if Ex < 0%, the treatment inhibited GLY release.
NO donor promoted glycine uptake and inhibited its release
In the experiments examining GLY uptake, the retinas were preincubated with sarcosine for 180 minutes to deplete endogenous GLY (Fig. 5A). Reloading with GLY in the presence of 100 μM DETA (this treatment is referred to as GLY+DETA) significantly enhanced GLY-LI in the INL (EGLY+DETA = 351 ± 47%) and IPL (EGLY+DETA = 394 ± 53%; Figs. 5C, 7, 9A) in comparison with retinas loaded with GLY only (EGLYonly = 100%; Figs. 5B, 7, 9A). In the GLY release experiments, retinas loaded with GLY that were then treated with 100 μM DETA had increased levels of GLY-LI (Fig. 6C) with strongly labeled amacrine cell somata in the INL (EDETA =-237 ± 38%) and in boutons in the IPL (EDETA =-167 ± 42%; Figs. 6C, 8, 9B), in sharp contrast to the strong release stimulated by High-K (EHigh-K = 100%; Figs. 6B, 8, 9B).
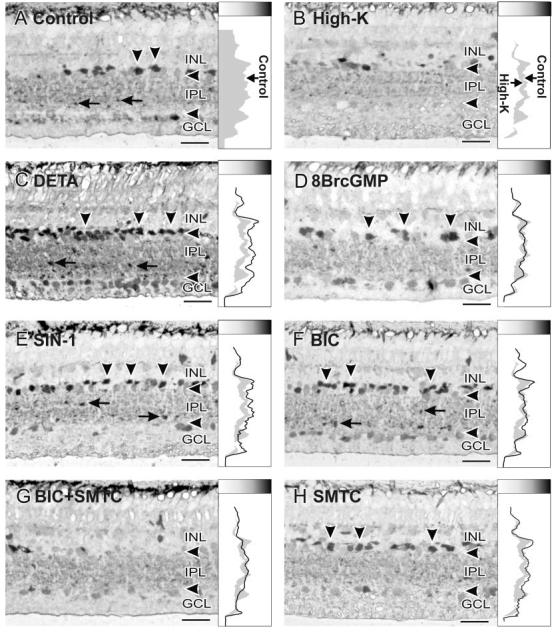
Fig. 5.
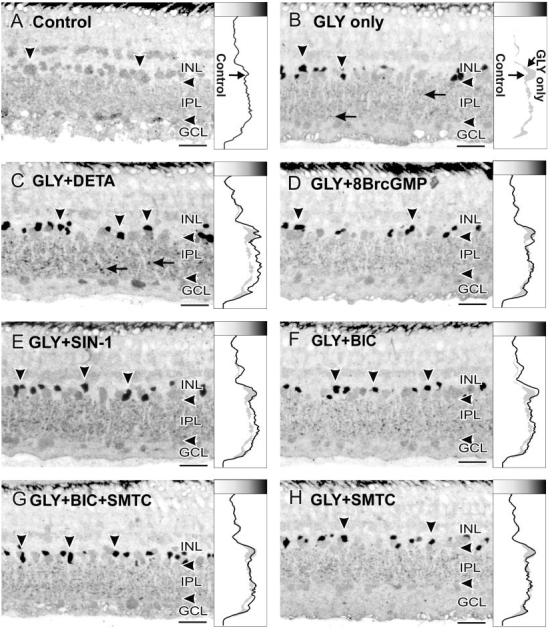
Glycine uptake experiments. In this figure and Figure 6, the vertical arrowheads indicate amacrine cell somata with GVG-LI, and the horizontal arrows indicate labeled boutons in the IPL. Higher GLY-LI levels are indicated to the right and as darker shades in the shade gradient box on top of the line profile curves. A: Retinas incubated with 5 mM sarcosine for 180 minutes were used as controls. Little GLY-LI was present after this treatment, and the line profile curve shows the background levels of GLY-LI. B: Reloading with GLY (1 mM) for 30 minutes dramatically increased GLY-LI in amacrine cell somata and in boutons in the IPL. The line profile curve shows increased levels of GLY-LI in the amacrine cell somata and in the IPL (right border of the gray shading in the curve box). C: Loading with GLY in the presence of 100 μM DETA increased the GLY-LI in the IPL and in amacrine cell somata in comparison with GLY loading only. D: Loading with GLY in the presence of 100 μM 8BrcGMP, however, did not mimic the effects of DETA, with the line profile curve roughly matching that seen with GLY loading only. E: Loading with GLY in the presence of 100 μM SIN-1 also raised GLY-LI above the levels seen with loading GLY alone, but more prominently in the IPL. F: Loading with GLY in the presence of 100 μM BIC mimicked the effects of DETA or SIN-1, with increased GLY-LI in amacrine cell somata and in the IPL, but the levels of increase in the IPL were not as great as those seen with DETA or SIN-1. G: Combining 100 μM SMTC with BIC, however, reduced the effects of BIC alone. H: SMTC alone did not enhance the loading of GLY. For abbreviations, see list. Scale bars = 25 μm.
Fig. 7.
The line profile curves for the GLY uptake experiments are presented together to show the differences between the treatments in specific retinal layers. The line profile curve of the unloaded control is shown as the bottom border of the gray shading, and the line profile curve for the GLY-loading is shown as the top border of the gray shading. For abbreviations, see list.
Fig. 9.
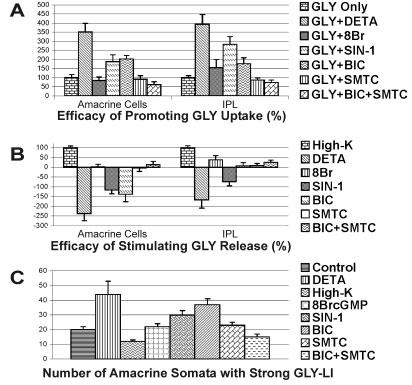
The area-under-the-curve (AUC) values for the amacrine cell somata and the IPL of the GLY-LI line profile curves. A: The efficacy of treatments in promoting GLY uptake were calculated based on the comparison of the difference in the GLY-LI AUC between untreated control retinas (0% uptake) and the retinas loaded with GLY (100% uptake); B: The efficacy in stimulating GLY release was calculated based on the comparison of the AUC difference between the GLY-loaded control retinas (0% release) and High-K-stimulated retinas (100% release); C: The amacrine cell somata count reflects the number of somata with strong GLY-LI in the INL seen with each treatment. The somata counts were obtained from images of retina that were matched in terms of their retinal location and the length of retina analyzed. For abbreviations, see list.
Fig. 6.
Glycine release experiments. A: Retinas loaded with 1 mM GLY for 180 minutes were used as a control, and showed strong GLY-LI in both amacrine cell somata and boutons in the IPL. This control line profile curve is presented as the right borderline of the gray shading. Higher GLY-LI levels are indicated toward the right and as darker shades in the shade gradient box on top of the line profile curves. In B-H, all retinas were treated as follows after being loaded with 1 mM GLY for 180 minutes. B: High-K stimulation dramatically reduced the levels of GLY-LI, and the line profile curve is shown as the left borderline of the gray shading. C: DETA (100 μM) dramatically increased the levels of GLY-LI in amacrine cell somata, in somata in the GCL, and in boutons in the IPL, leading to significantly higher numbers of labeled amacrine cell somata than in the controls. D: Treatment with 100 M 8BrcGMP did not mimic the effects of DETA, showing a line profile curve more similar to that of the controls. E: SIN-1 (100 M) mimicked some effects of DETA in that the GLY-LI levels were raised in both amacrine cell somata and in boutons in the IPL, but not in somata in the GCL. F: BIC (100 M) also increased GLY-LI in amacrine cell somata and in some boutons in the IPL. G: Adding 100 M SMTC to 100 M BIC reduced the GLY-LI in amacrine cell somata, in somata in the GCL, and in some boutons in the IPL, in comparison with BIC alone. H: SMTC itself had little effect on GLY-LI, showing a similar line profile curve to that of the control. For abbreviations, see list. Scale bars 25 μ m.
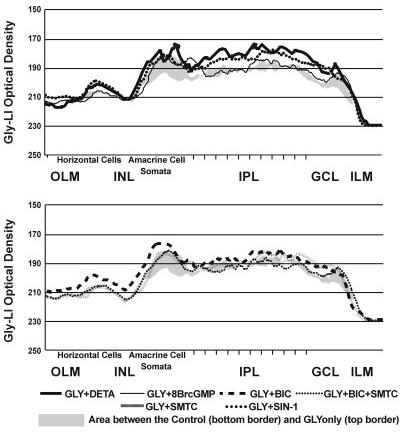
Fig. 8.
The line profile curves for the GLY release experiments are presented together to show the differences between the treatments in specific retinal layers. The line profile curve of the untreated but GVG-loaded control is shown as the top border of the gray shading, and the line profile curve for the High-K treatment is shown as the bottom border of the gray shading. For abbreviations, see list.
8BrcGMP had mixed effects on the uptake or release of glycine
To test whether NO inhibits GLY release through cGMP, we stimulated GLY-loaded retinas with 100 μM 8BrcGMP (treatment referred to as GLY+8BrcGMP). Cyclic GMP slightly decreased GLY uptake in the INL (EGLY+8BrcGMP = 84 ± 21%) and slightly increased GLY uptake in the IPL (EGLY+8BrcGMP = 154 ± 45%; Figs. 5D, 7, 9A). The effects on GLY release were also mixed, with little effect in the INL (EGLY+8BrcGMP = 2 ± 14%) and some release in the IPL (EGLY+8BrcGMP = 38 ± 21%; Figs. 6D, 8, 9B).
ONOO- mimicked the effects of NO
To evaluate the role of ONOO- in the inhibition of GLY release by NO, we used the ONOO- donor SIN-1 (100 μM) for both the uptake and release experiments. In the up-take experiments, SIN-1 significantly increased GLY up-take in both the INL (EGLY+SIN-1 = 189 ± 37%) and IPL (EGLY+SIN-1 = 284 ± 42%; Figs. 5E, 7, 9A). In the release experiments, SIN-1 inhibited GLY release in the INL (EGLY+SIN-1 =-117 ± 19%) and IPL (EGLY+SIN-1 =-73 ± 21%; Figs. 6E, 8, 9B).
GABAergic modulation of NO-inhibited glycine release
We have shown that NO can stimulate GABA release in the retina through several mechanisms, and GABA and GLY are known to have a reciprocal inhibitory relationship (Zhang et al., 1997). Therefore, we wanted to test whether NO inhibits GLY release by enhancing GABAergic inhibition. We did this by using bicuculline (BIC) to block selectively GABAA receptor (GABAAR)-mediated pathways, which are the dominant interamacrine GABAergic inhibitory pathways. BIC (100 μM) increased GLY-LI in both the INL and IPL in the uptake experiments (INL, EGLY+BIC = 203 ± 19% and IPL, EGLY+BIC = 176 ± 33%; Figs. 5F, 7 9A), although it was significantly less potent than NO donor. In the release experiments, BIC only prevented GLY release in the INL (EBIC =-138 ± 38%) but had no significant effect in the IPL, where glycinergic amacrine cells receive extensive synaptic inputs from GABAergic cells (EBIC = 7 ± 16%; Figs. 6F, 8, 9B).
However, our previous study has shown that BIC stimulates NO production (Yu and Eldred, 2003); therefore the effects of BIC involve increased NO production. Using the NOS inhibitor SMTC together with BIC reduced the effects of BIC in both the uptake experiments (INL, EGLY+BIC+SMTC = 61 ± 16% and IPL, EGLY+BIC+SMTC = 73 ± 14%; Figs. 5G, 7, 9A) and the release experiments (INL, EBIC+SMTC = 13 ± 17% and IPL, EBIC+SMTC = 25 ± 11%; Figs. 6G, 8, 9B). SMTC itself had no significant effects on either uptake or release (INL, EGLY+SMTC = 91 ± 20%, and IPL, 87 ± 11%; INL, ESMTC =-4 ± 17%, and IPL, 8 ± 11%; Figs. 5H, 6H, 7, 8, 9A,B).
In addition, unlike the effects of NO on GABA release, NO increased the number of amacrine cell somata with GLY-LI rather than changing the levels of GLY-LI in all glycinergic cells. Figure 9C shows the average number of labeled amacrine cell somata from all treatments from comparable retinal regions. These counts agree with the AUC results, and all significance claims are based on an ANOVA Dunnett’s Test with a P < 0.01. DETA stimulated significant increases in the number of GLY-LI-positive amacrine cell somata in comparison with controls (44 ± 9 versus 20 ± 2), whereas High-K significantly reduced the number (12 ± 1); 8BrcGMP (22 ± 2) and SMTC (23 ± 2) had little effect; SIN-1 significantly increased the number of labeled somata (30 ± 3); BIC (37 ± 4) resembled the results seen with DETA, whereas adding SMTC significantly reduced the number of labeled somata (15 ± 2).
DISCUSSION
NO stimulates GABA release through multiple mechanisms
The effects of NO on GABA release involve multiple mechanisms, with different mechanisms predominating in specific cell types. Our data indicate that in the horizontal cells NO enhances GABA release primarily through a cGMP-mediated pathway, whereas in amacrine cells ONOO- plays a larger role. Another interesting contrast between these cell types is the type of GABA release, in that reversal of the GABA transporter was predominantly involved in DETA-stimulated GVG release from horizontal cells, whereas both Ca2+-dependent release and the GABA transporters were involved in the effects of NO in the inner retina, with Ca2+ taking a larger role. Roughly half of NO-stimulated GABA release in the inner retina was sensitive to reduced Ca2+ and 1 mM cadmium, whereas Ca2+ was less involved in the effects of NO in the horizontal cell layer.
Correlation between cGMP and GABA transporter reversal
In the horizontal cells, several lines of evidence suggest a direct link between cGMP and Na+-dependent GABA transporter reversal. High levels of cGMP-LI can be found in horizontal cells in turtle (Blute et al., 2003) and goldfish retinas (Baldridge and Fischer, 2001). Cyclic nucleotide-gated channels (CNGCs) have been reported to regulate Na+ influx (Qiu et al., 2000; for review, see Kaupp and Seifert, 2002). Cyclic GMP has been demonstrated to modulate the functions of the serotonin transporter by acting through protein kinase G (PKG; Ozaslan et al., 2003). These findings suggest that cGMP may modulate GABA transporter activities through either Na+-dependent reversal of the GABA transporter or PKG-mediated modulation of the GABA transporter in GABAergic horizontal cells.
Modulation of glutamate release by cGMP stimulates GABA release
Glutamate is a major excitatory transmitter known to be modulated by NO in the retina (Zeevalk and Nicklas, 1994), and we found that blocking NMDA/AMPA/KA reflux Ca2+ to increase glutamate release (Savchenko et al., 1997). However, the removal of external Ca2+ had little effect on NO-stimulated GABA release from horizontal cells. This suggests that release of Ca2+ from internal stores in the photoreceptors may be involved, or that NO stimulates Ca2+-independent glutamate release from photoreceptors. This last possibility is supported by the findings of Meffert et al. (1994, 1996) that NO can stimulate Ca2+-independent transmitter release by directly influencing the synaptic vesicle docking proteins. It is also possible that NO may have direct effects on transporter reversal, because NO can directly activate neuronal Na+ channels through oxidation of the channel protein without the involvement of cGMP (Hammarström and Gage, 1999; Ahern et al., 2000).
ONOO- activates Ca2+-dependent GABA release but inhibits transporter reversal
In the inner retina, the connection between ONOO-- and Ca2+-dependent GABA release seems clear, as Ohkuma et al. (2001) reported that ONOO- can activate Ca2+ influx through L-type and P/Q-type voltage-dependent Ca2+ channels (VDCCs). In contrast, ONOO- can inhibit Na+ channels through oxidation of the sulfhydryl groups in the channel (DuVall et al., 1998), and it inhibits Na+ uptake in rat colonic membrane vesicles (Bauer et al., 1992), suggesting that ONOO- may disrupt Na+-dependent transporter-mediated GABA release by inhibiting Na+ influx. This corresponds with our observation that ONOO- had only a small effect in the outer retina, where the transporter reversal prevails.
ONOO- can indirectly stimulate GABA transporter reversal in the inner retina
However, Ohkuma et al. (1996b) demonstrated that ONOO- can also induce transporter-mediated GABA release. One possibility is that ONOO- increases Ca2+ influx to glutamatergic bipolar cells through VDCCs, leading to increased glutamate release from bipolar cell terminals, which in turn induces transporter-mediated GABA release when amacrine cells were depolarized by glutamate and Na+ influx was triggered. It is also possible that ONOO- may mimic NO by reacting with glutathione (GSH) and forming S-nitrosoglutathione, which could in turn release NO, thereby allowing ONOO- to exhibit NO-like activity and increase levels of cGMP (Mayer et al., 1995).
Our experiments with the ONOO- scavenger Lcys indicate that depleting ONOO- reduced the effects of DETA in the inner retina by about one-third (Fig. 4). This supports the possibility that some of the effects of NO may indeed involve ONOO-However, other biochemical mechanisms, such as Lcys modifying the redox state in retinal neurons, may also occur. The NO-stimulated, Ca2+-dependent, and cGMP-mediated GABA release that does not involve OONO- or presynaptic neurons probably involves the more established NO-sGC-cGMP-CNGC signal pathway. The effects of 8BrcGMP in the inner retina support this possibility.
NO inhibits glycine release through the modulation of GABA release
Although few studies have examined the mechanisms involved in GLY release, it is thought to be conventional Ca2+-dependent release. Our data demonstrate an apparent inhibition of GLY release by NO, an effect mimicked by SIN-1, but not by 8BrcGMP. The resemblance of the effects of DETA versus SIN-1 suggests that NO may possibly work through ONOO- to inhibit GLY release. Several studies indicate that the NO-cGMP-PKG signaling pathway can inhibit L-type, N-type, and P/Q-type VDCCs (L-, Carabelli et al., 2002; N-, D’Ascenzo et al., 2002; P/Q-, Grassi et al., 1999), which would support inhibitory effects of NO/cGMP on transmitter release (Gray et al., 1999). However, our study indicated that 8BrcGMP slightly stimulated both GLY uptake and release in the IPL, suggesting that cGMP may have similar effects on GLY and GABA by stimulating release through activation of CNGCs.
Our experiments not only confirm that NO reduces GLY release and promotes its uptake, but they also indicate that GABAAR-mediated inhibition contributes to the effects of NO on GLY release. Given that NO enhances GABA release through multiple mechanisms, and that GABAergic and glycinergic neurons are known to be able to mutually inhibit each other (Zhang et al., 1997), the effects of NO on GLY could be secondary to its effects on GABA, in that enhanced GABAergic inhibition could reduce GLY release. Several lines of evidence support this possibility. Glycinergic neurons did not respond to NO/ONOO- as uniformly as the GABAergic neurons did, in that some somata showed increased GLY-LI whereas others did not, suggesting that selective synaptic circuitry may play a role, as specific glycinergic neurons may receive different levels of GABAergic inhibition. Blocking GABAAR reduced the effects of NO on Gly-LI in the IPL, indicating that the effects of NO involve enhanced inhibition through GABAAR. Blocking GABAAR and NOS at the same time reduced GLY-LI, suggesting that GABAergic inhibition through GABAAR did prevent basal levels of GLY release. This idea is supported by the correlation of the relatively weak stimulatory effect of 8BrcGMP on GABA release in the IPL and its weak inhibition on GLY release in the same strata, and by the strong effects of SIN-1 on GLY in the IPL and its stronger effect on GABA in the same strata. Thus our data support the possibility that the stimulatory effects of NO/ONOO- on Ca2+ dependent GLY release are countered by enhanced GABA inhibition.
However, it is possible that additional mechanisms involving glycinergic cells and NO/ONOO-, or perhaps other transmitters, may be involved. Because blocking GABAAR inhibition with BIC only reduced but did not eliminate the inhibitory effects of NO on GLY release, most notably in the INL, it is possible that GABAAR inhibition was not the only pathway by which NO inhibits glycinergic neurons. GABACRs are predominantly located on bipolar cell axon terminals (Vitanova et al., 2001), and GABACRs have been shown to interact with glycinergic neurons (Cook et al., 2000). Enhanced feedback inhibition onto bipolar cells through GABACR may reduce the excitatory drive to glycinergic neurons, resulting in reduced GLY release. Thus, the effects of NO on GLY release may involve enhanced GABAergic inhibition through both GABAAR and GABACR synaptic pathways.
CONCLUSIONS
In summary, NO modulates the release of inhibitory transmitters using multiple mechanisms: reversal of the Na+-dependent GABA transporter; activation of release through the cGMP-CNG channels to increase Ca2++ influx; formation of ONOO- and subsequent activation of VDCCs to increase Ca2+-mediated release; activation of Na+-dependent transporter reversal by enhancing pre-synaptic release of glutamate; and inhibition of GLY release through enhanced GABA release. Our study also indicated that cGMP can reverse the GABA transporter in horizontal cells. The dominant effect of NO on a specific neuron will depend on which members of downstream signaling pathways, such as sGC, CNGCs, transporters, or ion channels, can be activated by NO in a specific neuron; and on the synaptic connectivity of that neuron. Finally, our data indicated that NO may work through both cGMP and ONOO-, but each may have different effects. This raises the possibility that the effects of NO in a given tissue may depend on the local oxidative microenvironment in that tissue, which would determine how much superoxide is available to convert NO into ONOO-.
ACKNOWLEDGMENTS
We thank Dr. Todd A. Blute for his critical readings of the article and many valuable discussions, and Felicitas B. Eldred for her excellent technical assistance. We also want to thank Dr. David V. Pow for generously donating the GVG and the antibody against GVG.
Footnotes
- BIC
- biculline
- 8BrcGMP
- 8-bromo-cyclic guanosine monophosphate
- CNQX
- 6-cyano-7-nitroquinoxaline-2,3-dione
- D-Cd
- DETA and Cd2
- DCdNA
- DETR, Cd2and 100 M nipecotic acid
- DETA
- DETA NONoate
- DLcys
- DETA and L-cysteine
- DMC
- DETA, 100 M MK801 and 100 M CNQX
- DMCNA
- DMC and nipecotic acid
- D-NA
- DETA and nipecotic acid
- GCL
- ganglion cell layer
- GLY
- glycine
- GVG
- γ-vinyl-γ-aminobutyric acid
- ILM
- inner limiting membrane
- INL
- inner nuclear layer
- IPL
- inner plexiform layer
- Lcys
- L-cysteine
- LI
- -like immunoreactivity
- NO
- nitric oxide
- OLM
- outer limiting membrane
- SIN-1
- 3-morpholinylsydnoneimine chloride
- SMTC
- S-methyl-L-thiocitrulline
Contributor Information
DOU YU, Department of Biology, Boston University, Boston, Massachusetts 02215.
WILLIAM D. ELDRED, Grant sponsor: National Eye Institute, National Institutes of Health; Grant number: EY 04785 (to W.D.E.)..
LITERATURE CITED
- Ahern GP, Hsu SF, Klyachko VA, Jackson MB. Induction of persistent sodium current by exogenous and endogenous nitric oxide. J Biol Chem. 2000;275:28810–28815. doi: 10.1074/jbc.M003090200. [DOI] [PubMed] [Google Scholar]
- Baldridge WH, Fischer AJ. Nitric oxide donor stimulated increase of cyclic GMP in the goldfish retina. Vis Neurosci. 2001;18:849–856. [PubMed] [Google Scholar]
- Bauer ML, Beckman JS, Bridges RJ, Fuller CM, Matalon S. Peroxynitrite inhibits sodium uptake in rat colonic membrane vesicles. Biochim Biophys Acta. 1992;1104:87–94. doi: 10.1016/0005-2736(92)90135-9. [DOI] [PubMed] [Google Scholar]
- Beckman JS, Koppenol WH. Nitric oxide, superoxide, and peroxynitrite: the good, the bad, and the ugly. Am J Physiol. 1996;271:1424–1437. doi: 10.1152/ajpcell.1996.271.5.C1424. [DOI] [PubMed] [Google Scholar]
- Blute TA, Mayer B, Eldred WD. Immunocytochemical and histochemical localization of nitric oxide synthase in the turtle retina. Vis Neurosci. 1997;14:717–729. doi: 10.1017/s0952523800012670. [DOI] [PubMed] [Google Scholar]
- Blute TA, Velasco P, Eldred WD. Functional localization of soluble guanylate cyclase in turtle retina: modulation of cGMP by nitric oxide donors. Vis Neurosci. 1998;15:485–498. doi: 10.1017/s0952523898153075. [DOI] [PubMed] [Google Scholar]
- Blute TA, Strang C, Keyser KT, Eldred WD. Activation of the cGMP/nitric oxide signal transduction system by nicotine in the retina. Vis Neurosci. 2003;20:165–176. doi: 10.1017/s0952523803202078. [DOI] [PubMed] [Google Scholar]
- Bormann J. The ‘ABC’ of GABA receptors. Trends Pharmacol Sci. 2000;21:16–19. doi: 10.1016/s0165-6147(99)01413-3. [DOI] [PubMed] [Google Scholar]
- Carabelli V, D’Ascenzo M, Carbone E, Grassi C. Nitric oxide inhibits neuroendocrine Ca(V)1 L-channel gating via cGMP-dependent protein kinase in cell-attached patches of bovine chromaffin cells. J Physiol. 2002;541:351–366. doi: 10.1113/jphysiol.2002.017749. [DOI] [PMC free article] [PubMed] [Google Scholar]
- Cook PB, Lukasiewicz PD, McReynolds JS. GABA(C) receptors control adaptive changes in a glycinergic inhibitory pathway in salamander retina. J Neurosci. 2000;20:806–812. doi: 10.1523/JNEUROSCI.20-02-00806.2000. [DOI] [PMC free article] [PubMed] [Google Scholar]
- D’Ascenzo M, Martinotti G, Azzena GB, Grassi C. cGMP/protein kinase G-dependent inhibition of N-type Ca2+ channels induced by nitric oxide in human neuroblastoma IMR32 cells. J Neurosci. 2002;22:7485–7492. doi: 10.1523/JNEUROSCI.22-17-07485.2002. [DOI] [PMC free article] [PubMed] [Google Scholar]
- DuVall MD, Zhu S, Fuller CM, Matalon S. Peroxynitrite inhibits amiloride-sensitive Na+ currents in Xenopus oocytes expressing alpha beta gamma-rENaC. Am J Physiol. 1998;274:C1417–1423. doi: 10.1152/ajpcell.1998.274.5.C1417. [DOI] [PubMed] [Google Scholar]
- Eldred WD, Cheung K. Immunocytochemical localization of glycine in the retina of the turtle (Pseudemys scripta) Vis Neurosci. 1989;2:331–338. doi: 10.1017/s0952523800002133. [DOI] [PubMed] [Google Scholar]
- Gallo V, Patrizio M, Levi G. GABA release triggered by the activation of neuron-like non-NMDA receptors in cultured type 2 astrocytes is carrier-mediated. Glia. 1991;4:245–255. doi: 10.1002/glia.440040302. [DOI] [PubMed] [Google Scholar]
- Ginap T, Kilbinger H. Inhibition by nitric oxide and cyclic GMP of 5-hydroxytryptamine release from the vascularly perfused guinea-pig small intestine. Neurochem Int. 1998;32:487–492. doi: 10.1016/s0197-0186(97)00128-9. [DOI] [PubMed] [Google Scholar]
- Grassi C, D’Ascenzo M, Valente A, Battista Azzena G. Ca2+ channel inhibition induced by nitric oxide in rat insulinoma RINm5F cells. Pflugers Arch. 1999;437:241–247. doi: 10.1007/s004240050775. [DOI] [PubMed] [Google Scholar]
- Gray DB, Polo-Parada L, Pilar GR, Eang P, Metzger RR, Klann E, Meriney SD. A nitric oxide/cyclic GMP-dependent protein kinase pathway alters transmitter release and inhibition by somatostatin at a site downstream of calcium entry. J Neurochem. 1999;72:1981–1990. doi: 10.1046/j.1471-4159.1999.0721981.x. [DOI] [PubMed] [Google Scholar]
- Guevara-Guzman R, Emson PC, Kendrick KM. Modulation of in vivo striatal transmitter release by nitric oxide and cyclic GMP. J Neurochem. 1994;62:807–810. doi: 10.1046/j.1471-4159.1994.62020807.x. [DOI] [PubMed] [Google Scholar]
- Hammarström AK, Gage PW. Nitric oxide increases persistent sodium current in rat hippocampal neurons. J Physiol. 1999;520:451–461. doi: 10.1111/j.1469-7793.1999.t01-1-00451.x. [DOI] [PMC free article] [PubMed] [Google Scholar]
- Haverkamp S, Kolb H, Cuenca N. Morphological and neurochemical diversity of neuronal nitric oxide synthase-positive amacrine cells in the turtle retina. Cell Tissue Res. 2000;302:11–19. doi: 10.1007/s004410000267. [DOI] [PubMed] [Google Scholar]
- Hurd LB, 2nd, Eldred WD. Localization of GABA- and GAD-like immunoreactivity in the turtle retina. Vis Neurosci. 1989;3:9–20. doi: 10.1017/s0952523800012463. [DOI] [PubMed] [Google Scholar]
- Ientile R, Pedale S, Picciurro V, Macaione V, Fabiano C, Macaione S. Nitric oxide mediates NMDA-evoked [3H]GABA release from chick retina cells. FEBS Lett. 1997;417:345–348. doi: 10.1016/s0014-5793(97)01322-7. [DOI] [PubMed] [Google Scholar]
- Kaupp UB, Seifert R. Cyclic nucleotide-gated ion channels. Physiol Rev. 2002;82:769–824. doi: 10.1152/physrev.00008.2002. [DOI] [PubMed] [Google Scholar]
- Kraus MM, Prast H. The nitric oxide system modulates the in vivo release of acetylcholine in the nucleus accumbens induced by stimulation of the hippocampal fornix/fimbria-projection. Eur J Neurosci. 2001;14:1105–1112. doi: 10.1046/j.0953-816x.2001.01735.x. [DOI] [PubMed] [Google Scholar]
- Kraus MM, Prast H. Involvement of nitric oxide, cyclic GMP and phosphodiesterase 5 in excitatory amino acid and GABA release in the nucleus accumbens evoked by activation of the hippocampal fimbria. Neuroscience. 2002;112:331–343. doi: 10.1016/s0306-4522(02)00079-9. [DOI] [PubMed] [Google Scholar]
- Kurenny DE, Moroz LL, Turner RW, Sharkey KA, Barnes S. Modulation of ion channels in rod photoreceptors by nitric oxide. Neuron. 1994;13:315–324. doi: 10.1016/0896-6273(94)90349-2. [DOI] [PubMed] [Google Scholar]
- Marc RE, Liu WL, Kalloniatis M, Raiguel SF, van Haesendonck E. Patterns of glutamate immunoreactivity in the goldfish retina. J Neurosci. 1990;10:4006–4034. doi: 10.1523/JNEUROSCI.10-12-04006.1990. [DOI] [PMC free article] [PubMed] [Google Scholar]
- Mayer B, Schrammel A, Klatt P, Koesling D, Schmidt K. Peroxynitrite-induced accumulation of cyclic GMP in endothelial cells and stimulation of purified soluble guanylyl cyclase. Dependence on glutathione and possible role of S-nitrosation. J Biol Chem. 1995;270:17355–17360. doi: 10.1074/jbc.270.29.17355. [DOI] [PubMed] [Google Scholar]
- McLean DL, Sillar KT. Nitric oxide selectively tunes inhibitory synapses to modulate vertebrate locomotion. J Neurosci. 2002;22:4175–4184. doi: 10.1523/JNEUROSCI.22-10-04175.2002. [DOI] [PMC free article] [PubMed] [Google Scholar]
- Meffert MK, Premack BA, Schulman H. Nitric oxide stimulates Ca(2+)-independent synaptic vesicle release. Neuron. 1994;12:1235–1244. doi: 10.1016/0896-6273(94)90440-5. [DOI] [PubMed] [Google Scholar]
- Meffert MK, Calakos NC, Scheller RH, Schulman H. Nitric oxide modulates synaptic vesicle docking fusion reactions. Neuron. 1996;16:1229–1236. doi: 10.1016/s0896-6273(00)80149-x. [DOI] [PubMed] [Google Scholar]
- Nauli SM, Pearce WJ, Amer A, Maher TJ, Ally A. Effects of nitric oxide and GABA interaction within ventrolateral medulla on cardiovascular responses during static muscle contraction. Brain Res. 2001;922:234–242. doi: 10.1016/s0006-8993(01)03177-8. [DOI] [PubMed] [Google Scholar]
- Okada M, Osumi Y, Okuma Y, Ueno H. Nitric oxide inhibits the release of acetylcholine in the isolated retina. Graefes Arch Clin Exp Ophthalmol. 2001;239:217–221. doi: 10.1007/s004170100274. [DOI] [PubMed] [Google Scholar]
- Ohkuma S, Narihara H, Katsura M, Hasegawa T, Kuriyama K. Nitric oxide-induced [3H] GABA release from cerebral cortical neurons is mediated by peroxynitrite. J Neurochem. 1995;65:1109–1114. doi: 10.1046/j.1471-4159.1995.65031109.x. [DOI] [PubMed] [Google Scholar]
- Ohkuma S, Katsura M, Chen DZ, Narihara H, Kuriyama K. Nitric oxide-evoked [3H] gamma-aminobutyric acid release is mediated by two distinct release mechanisms. Brain Res Mol Brain Res. 1996a;36:137–144. doi: 10.1016/0169-328x(95)00256-r. [DOI] [PubMed] [Google Scholar]
- Ohkuma S, Katsura M, Guo JL, Narihara H, Hasegawa T, Kuriyama K. Role of peroxynitrite in [3H] gamma-aminobutyric acid release evoked by nitric oxide and its mechanism. Eur J Pharmacol. 1996b;301:179–188. doi: 10.1016/0014-2999(96)00013-1. [DOI] [PubMed] [Google Scholar]
- Ohkuma S, Katsura M, Higo A, Shirotani K, Hara A, Tarumi C, Ohgi T. Peroxynitrite affects Ca2+ influx through voltage-dependent calcium channels. J Neurochem. 2001;76:341–350. doi: 10.1046/j.1471-4159.2001.00045.x. [DOI] [PubMed] [Google Scholar]
- Ozaslan D, Wang S, Ahmed BA, Kocabas AM, McCastlain JC, Bene A, Kilic F. Glycosyl modification facilitates homo- and hetero-oligomerization of the serotonin transporter. A specific role for sialic acid residues. J Biol Chem. 2003;278:43991–44000. doi: 10.1074/jbc.M306360200. [DOI] [PMC free article] [PubMed] [Google Scholar] [Retracted]
- Poluch S, Konig N. AMPA receptor activation induces GABA release from neurons migrating tangentially in the intermediate zone of embryonic rat neocortex. Eur J Neurosci. 2002;16:350–354. doi: 10.1046/j.1460-9568.2002.02068.x. [DOI] [PubMed] [Google Scholar]
- Pourcho RG. Neurotransmitters in the retina. Curr Eye Res. 1996;15:797–803. doi: 10.3109/02713689609003465. [DOI] [PubMed] [Google Scholar]
- Pow DV. Transport is the primary determinant of glycine content in retinal neurons. J Neurochem. 1998;70:2628–2636. doi: 10.1046/j.1471-4159.1998.70062628.x. [DOI] [PubMed] [Google Scholar]
- Pow DV, Wright LL, Vaney DI. The immunocytochemical detection of amino-acid neurotransmitters in paraformaldehyde-fixed tissues. J Neurosci Methods. 1995;56:115–123. doi: 10.1016/0165-0270(94)00113-u. [DOI] [PubMed] [Google Scholar]
- Pow DV, Baldridge W, Crook DK. Activity-dependent transport of GABA analogues into specific cell types demonstrated at high resolution using a novel immunocytochemical strategy. Neuroscience. 1996;73:1129–1143. doi: 10.1016/0306-4522(96)00097-8. [DOI] [PubMed] [Google Scholar]
- Prast H, Philippu A. Nitric oxide as modulator of neuronal function. Prog Neurobiol. 2001;64:51–68. doi: 10.1016/s0301-0082(00)00044-7. [DOI] [PubMed] [Google Scholar]
- Qiu W, Lee B, Lancaster M, Xu W, Leung S, Guggino SE. Cyclic nucleotide-gated cation channels mediate sodium and calcium influx in rat colon. Am J Physiol Cell Physiol. 2000;278:C336–343. doi: 10.1152/ajpcell.2000.278.2.C336. [DOI] [PubMed] [Google Scholar]
- Savchenko A, Barnes S, Kramer RH. Cyclic-nucleotide-gated channels mediate synaptic feedback by nitric oxide. Nature. 1997;390:694–698. doi: 10.1038/37803. [DOI] [PMC free article] [PubMed] [Google Scholar]
- Segovia G, Mora F. Role of nitric oxide in modulating the release of dopamine, glutamate, and GABA in striatum of the freely moving rat. Brain Res Bull. 1998;45:275–279. doi: 10.1016/s0361-9230(97)00402-4. [DOI] [PubMed] [Google Scholar]
- Trabace L, Kendrick KM. Nitric oxide can differentially modulate striatal neurotransmitter concentrations via soluble guanylate cyclase and peroxynitrite formation. J Neurochem. 2000;75:1664–1674. doi: 10.1046/j.1471-4159.2000.0751664.x. [DOI] [PubMed] [Google Scholar]
- Vaney DI, Pow DV. The dendritic architecture of the cholinergic plexus in the rabbit retina: selective labeling by glycine accumulation in the presence of sarcosine. J Comp Neurol. 2000;421:1–13. [PubMed] [Google Scholar]
- Vaney DI, Nelson JC, Pow DV. Neurotransmitter coupling through gap junctions in the retina. J Neurosci. 1998;18:10594–10602. doi: 10.1523/JNEUROSCI.18-24-10594.1998. [DOI] [PMC free article] [PubMed] [Google Scholar]
- Vitanova L, Kupenova P, Haverkamp S, Popova E, Mitova L, Wassle H. Immunocytochemical and electrophysiological characterization of GABA receptors in the frog and turtle retina. Vision Res. 2001;41:691–704. doi: 10.1016/s0042-6989(00)00294-7. [DOI] [PubMed] [Google Scholar]
- Wall MJ. Endogenous nitric oxide modulates GABAergic transmission to granule cells in adult rat cerebellum. Eur J Neurosci. 2003;18:869–878. doi: 10.1046/j.1460-9568.2003.02822.x. [DOI] [PubMed] [Google Scholar]
- WaÄssle H, Koulen P, Brandstatter JH, Fletcher EL, Becker CM. Glycine and GABA receptors in the mammalian retina. Vision Res. 1998;38:1411–1430. doi: 10.1016/s0042-6989(97)00300-3. [DOI] [PubMed] [Google Scholar]
- Yu D, Eldred WD. GABAa and GABAc receptor antagonists increase retina cyclic GMP levels through nitric oxide synthase. Vis Neurosci. 2003;20:627–637. doi: 10.1017/s0952523803206052. [DOI] [PubMed] [Google Scholar]
- Zeevalk GD, Nicklas WJ. Nitric oxide in retina: relation to excitatory amino acids and excitotoxicity. Exp Eye Res. 1994;58:343–350. doi: 10.1006/exer.1994.1024. [DOI] [PubMed] [Google Scholar]
- Zhang J, Snyder SH. Nitric oxide in the nervous system. Annu Rev Pharmacol Toxicol. 1995;35:213–233. doi: 10.1146/annurev.pa.35.040195.001241. [DOI] [PubMed] [Google Scholar]
- Zhang J, Jung CS, Slaughter MM. Serial inhibitory synapses in retina. Vis Neurosci. 1997;14:553–563. doi: 10.1017/s0952523800012219. [DOI] [PubMed] [Google Scholar]