Abstract
Substantial ATP supply by glycolysis is thought to reflect cellular anoxia in vertebrate muscle. An alternative hypothesis is that the lactate generated during contraction reflects sustained glycolytic ATP supply under well-oxygenated conditions. We distinguished these hypotheses by comparing intracellular glycolysis during anoxia to lactate efflux from muscle during sustained, aerobic contractions. We examined the tailshaker muscle of the rattlesnake because of its uniform cell properties, exclusive blood circulation, and ability to sustain rattling for prolonged periods. Here we show that glycolysis is independent of the O2 level and supplies one-third of the high ATP demands of sustained tailshaking. Fatigue is avoided by rapid H+ and lactate efflux resulting from blood flow rates that are among the highest reported for vertebrate muscle. These results reject the hypothesis that glycolysis necessarily reflects cellular anoxia. Instead, they demonstrate that glycolysis can provide a high and sustainable supply of ATP along with oxidative phosphorylation without muscle fatigue.
Keywords: 31P magnetic resonance spectroscopy, high-energy phosphates, rattlesnake
Lactate generation by tissues is often taken as a sign of tissue hypoxia (1). This thinking has led to the anaerobic threshold hypothesis, which links lactate generation in exercising muscle to an intracellular O2 limitation to respiration of pyruvate (2). However, many tissues seem to generate lactate under aerobic conditions (so-called aerobic glycolysis) in a process linking glycolytic ATP supply to ion transport (3–5). For example, lactate generation by muscles exercising at rates well below their aerobic maximum (6) supports this alternative explanation. Muscle PO2 seems to be well above limits to mitochondrial respiration in these muscles as indicated by indirect measures of tissue oxygenation involving myoglobin saturation (6, 7). This finding questions an O2 limit to respiration as the basis for lactate generation in exercising muscle. However, these indirect measures do not have the spatial resolution to determine intracellular PO2 to rule out local tissue anoxia (8).
A definitive test of whether an O2 limitation is responsible for lactate generation during sustained contractions is possible by using a direct comparison of glycolysis during anoxic and sustained aerobic contractions. New magnetic resonance (MR) techniques for partitioning intracellular ATP supply in vivo permitted this comparison in human muscles and were used to show that glycolytic flux is independent of O2 state (9). The similarities of flux under anoxia and aerobic conditions in that study indicated that glycolysis is not mutually exclusive with oxidative phosphorylation. This glycolytic flux should generate a high lactate efflux into the blood during aerobic contractions and serves as a test for MR results. The rattlesnake tailshaker muscles are well suited for a direct comparison of intracellular glycolysis to lactate efflux. First, the uniform muscle fiber properties (10, 11) of these tailshaker muscles eliminate the problem of fiber heterogeneity in quantifying intracellular glycolysis during anoxia. Second, the exclusive blood circulation of the tailshaker muscles permits direct measurement of lactate generation during aerobic contractions. Finally, the ability to maintain rattling for prolonged periods (12) makes tailshaking a model for sustained muscle contraction.
The purpose of this experiment was to compare glycolytic flux during anoxia and aerobic rattling. 31P MR spectroscopy permitted measurement of intracellular glycolytic ATP supply during ischemia. In-dwelling catheters measured lactate flux during aerobic contractions in parallel experiments.
Methods
Animals and Experimental Setup.
Western diamondback rattlesnakes (Crotalus atrox) were collected in Arizona under Fish and Wildlife permit no. SP790044 or from licensed reptile distributors. A total of 8 snakes ranging in mass from 350 to 850 grams was studied. A body temperature of 30°C was maintained by running water through coiled copper tubing on which the snakes rested. A thermocouple was inserted into the cloaca for the duration of the experiment to measure body temperature. Each snake was induced to rattle by tapping on its container. A blood-pressure cuff was inflated to 280 torr (1 torr = 133 Pa) between the cloaca and tailshaker muscles to induce ischemia and block oxygen delivery (13, 14) 30 sec before rattling.
Experimental Protocol.
Two experiments were performed to partition ATP supply and demand. The first experiment involved ischemia to measure contractile ATP demand and glycolytic ATP supply, as described in detail (13, 14).
Base-line period (72 sec).
Spectra were collected from quiescent muscle, and ischemia was produced at 36 sec. A pediatric blood-pressure cuff positioned between the cloaca and tailshaker muscles was inflated to block blood flow and thereby prevent O2 delivery. Pilot studies that used MR methods for detecting large-vessel (15) and local-muscle blood flow (16) indicated no detectable flow during ischemia.
Rattling (72 to 101 sec).
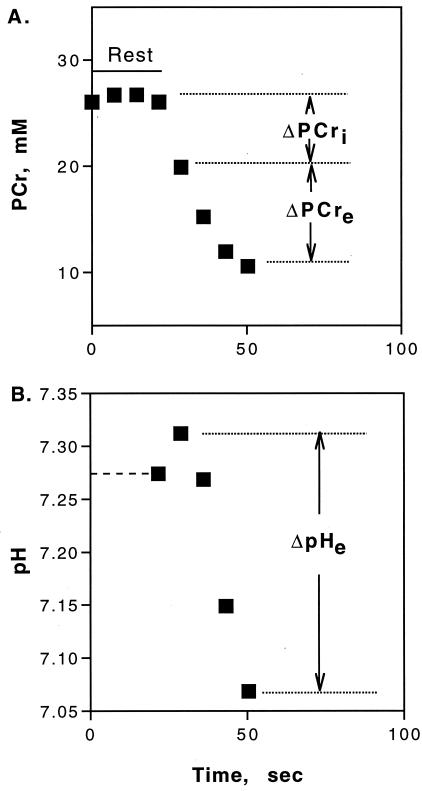
Onset of rattling was marked by an initial period of creatine phosphate (PCr) depletion and pH rise. PCr decline was used to determine ATP demand and, together with pH, was used to determine the tissue H+ buffer capacity. An acidification in pH followed, and PCr and pH changes in the subsequent spectra were used to determine glycolytic ATP supply.
Postrattling ischemia (101 to 187 sec).
The snake tail was kept ischemic to allow glycolysis to subside (17).
Aerobic recovery (187 to 360 sec).
After release of the blood pressure cuff, blood flow returned to the tail permitting aerobic recovery and measurement of PCr resynthesis.
The second experiment involved aerobic rattling, which yielded the change in PCr (Δ[PCr]r) for estimation of the oxidative phosphorylation rate during rattling (Eq. 4). After a baseline period of 72 sec (10 spectra), snakes were induced to rattle for 108 sec (15 spectra), which resulted in a steady-state PCr level. Metabolite levels and pH were measured under rest and steady-state conditions.
MR Determinations.
A General Electric 4.7 T spectrometer was used for all studies. A 2-cm-diameter by 2.5-cm-long Helmholz coil tuned to the phosphorus frequency (81.0 MHz) was placed around the tailshaker muscle. B0 field homogeneity was optimized by off-resonance proton shimming on the muscle water peak. The unfiltered PCr line width (full width at half maximal height) was less than 35 Hz. For each snake, a high-resolution control 31P spectrum of the resting muscle was taken under conditions of fully relaxed nuclear spins (64 free-induction decays with a 32-sec interpulse delay) by using a spectral width of ±2,500 Hz and 1,024 data points. Measurements of changes in the levels of PCr, ATP, Pi, and pH during and after rattling were taken by using a standard one-pulse experiment with partially saturated nuclear spins (0.6-sec interpulse delay). Per spectrum, 8 free-induction decays were averaged, yielding a time resolution of 7.2 sec. Three identical runs were collected sequentially and then were summed together to yield a >30:1 signal-to-noise ratio for PCr. The free-induction delays were Fourier transformed into spectra and analyzed as described (13, 14). The area corresponding to each spectral peak was expressed relative to the ATP peak, which was calibrated by using the ATP concentration measured in muscle (18). The free ADP level was calculated from the creatine kinase equilibrium (19) that was corrected for the effects of pH and temperature (20, 21). The chemical shift of the Pi peak relative to PCr (−2.54 ppm) referenced to phosphoric acid (0 ppm) was used to calculate pH corrected for the effects of temperature (22).
Cardiovascular Measurements.
Four animals averaging a 454 ± 42-g body mass had tailshaker masses averaging 3.2 ± 0.3 g. Size 2R (1 R = 0.258 mC/kg) flow probes (Transonics, Ithaca, NY) were implanted into the snakes to measure blood flow through the dorsal aorta just proximal to the tailshaker muscles. Catheters were placed in a vein draining the tailshaker muscle and on a branch leaving the aorta. Snakes were allowed to recover from this surgery for 18 to 48 h. Measurements were taken at rest and between 2 and 5 min of rattling. Lactate concentration in the blood samples was measured by using a YSI 2300 Stat Lactate analyzer (Yellow Springs Instruments), and O2 content was measured according to the Tucker method (23). Resting and rattling fluxes were calculated from the Fick equation as: flux = blood flow × Δconcentration (arterial minus venous). Oxidative ATP synthesis rates were estimated from the oxygen flux change between rest and rattling assuming that 34 of the 37 ATPs generated by glycogen oxidation represented mitochondrial respiration and 6 O2 per oxidized glucosyl. The ATP fluxes were calculated by using the tailshaker mass of each individual assuming 0.7 ml H2O/g of muscle (24).
Calculations.
Contractile ATP demand was determined from the change in PCr from the last resting spectrum to the first rattling spectrum (Δ[PCr]i; Fig. 1A) during ischemic rattling. We assume that glycogenolysis generates pyruvate, which then has two fates—oxidation or conversion to lactate and H+. This pyruvate flux yields 3 ATPs (ṀATPo; Eq. 1), of the 37 ATPs generated by oxidation of glycogen to CO2 and H2O, assuming that (i) pyruvate is the sole substrate for oxidative phosphorylation (41), and (ii) that all cytosolic NADH enters the mitochondrion via the glycerol phosphate shuttle rather than the 39 ATPs generated if NADH enters via the malate/aspartate shuttle:
 |
1 |
where ṀATPa is the oxidative phosphorylation rate (Eq. 4). The fraction of pyruvate that is converted to lactate produces H+ (ṀH+; Eq. 2), which causes the acidification of pH during ischemic rattling. Proton production was quantified from the observed spectroscopic data by using the change in PCr concentration (Δ[PCr]e) and pH (ΔpHe) among successive spectra (Fig. 1):
 |
2 |
where βtot is the H+ buffer capacity, and γ is the H+ stoichiometric coefficient of the coupled Lohman reaction, as described (14). The sum of these two fates of pyruvate yields the ATP synthesis resulting from the carbon flux through glycolysis (ṀATPg):
 |
3 |
where 1.5 is the ATP/H+ stoichiometry of glycolysis (14).
Figure 1.
PCr (A) and pH (B) levels starting at the onset of ischemia in resting muscle and through ischemic rattling. The contractile ATP demand is measured by Δ[PCr]i. After the onset of acidosis, the changes in [PCr] (Δ[PCr]e) and pH (ΔpHe) reflect glycolytic H+ production (Eq. 1; ref. 14). Values are means, n = 6. The dashed line in B is the resting muscle pH from high-resolution spectra.
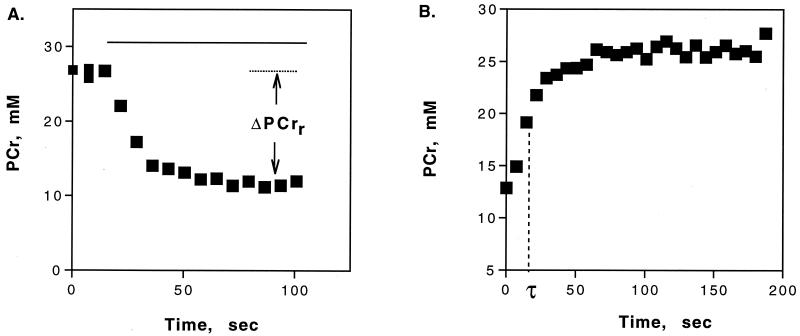
The oxidative phosphorylation rate was determined from a linear model of oxidative phosphorylation described by Meyer et al. (26–28). The first step in using this model was to fit the recovery of PCr from the exercise to the resting level by using a monoexponential equation from which the recovery time (τ) and rate constants (kPCr = 1/τ) were estimated. The oxidative phosphorylation rate (ṀATPa) is given by:
 |
4 |
where Δ[PCr]r is the change in PCr concentration between the resting and rattling levels.
Results
MR.
31P MR spectroscopy experiments were designed to partition ATP supply and demand by using a combination of ischemia and aerobic rattling. The MR spectra provide high time resolution of the phosphorus metabolite and pH changes with rattling. Fig. 1 shows the drop in PCr content and the change in pH during ischemic rattling, which are used to quantify ATP fluxes. To separate contractile ATP demand from ATP supply, PCr breakdown was measured at the start of rattling (Δ[PCr]i), when glycolysis was absent and when oxidative ATP supply was prevented by using ischemia to block oxygen delivery (13). This ATP cost of tailshaking averaged 1.13 ± mM ATP/sec (mean ± SEM; n =13). Because protons (H+) are consumed by the creatine kinase reaction when PCr is broken down, glycolytic H+ production is determined from the change in both PCr and pH (14). The onset of glycolytic ATP supply was marked by muscle acidification (Fig. 1B) and resulted in a flux of 0.35 ± 0.05 mM H+/sec or 0.52 ± 0.07 mM ATP/sec (14).
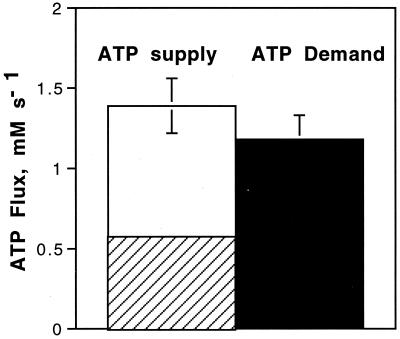
The final component of the ATP balance, oxidative ATP supply, was determined from Eq. 4 by using the change in PCr level during aerobic rattling and the recovery kinetics from rattling (PCr recovery rate constant, kPCr). Fig. 2A shows the change in PCr level during sustained rattling (Δ[PCr]r; 14.91 ± 0.92 mM, n = 5). Fig. 2B shows the PCr recovery kinetics after rattling, which yielded a kPCr of 0.066 ± 0.014 sec−1 (n = 4). Fig. 3 shows that the resulting oxidative ATP supply (0.93 ± 0.14 mM ATP/sec; n = 5) was insufficient to meet contractile ATP demand (t test, P < 0.05) unless glycolytic ATP supply was included. This ATP balance confirms that (i) glycolysis supplies >30% of the ATP supply needed for sustained rattling and (ii) oxidative ATP supply alone is inadequate to meet contractile demand.
Figure 2.
PCr dynamics from rest to aerobic rattling (A, n = 6) and during recovery (B, n = 4). Δ[PCr]r is the change in [PCr] from rest to the rattling steady state. PCr recovery is characterized by the rate constant (kPCr = 1/τ) derived from a monoexponential fit. Values are means. The rattling period is shown by the solid horizontal line in A.
Figure 3.
ATP balance during rattling is comprised of the ATP supply by glycolysis (striped box, n = 13) and oxidative phosphorylation (open box, n = 5) vs. the contractile ATP demand (filled box, n = 13). Values are means ± SEM.
Cardiovascular Measurements.
Catheters were implanted to permit measurement of tailshaker lactate generation and oxygen consumption during normal rattling. Table 1 shows that between rest and rattling, blood flow to the tailshaker muscles increased by 3-fold, O2 extraction rose by over 4-fold, and the arterial-venous difference in blood lactate concentration rose by 10-fold. The resting blood flow is high [178 ml/(min⋅100 g)] compared to the mammalian values [<100 ml/(min⋅100 g); ref. 32], but the O2 uptake and lactate fluxes are nonetheless >10-fold lower than during rattling. This high blood flow suggests that the tailshaker muscles may not have been in a truly resting state when inactive for periods during our experiments. Nonsignificant elevations of arterial O2 content and lactate concentration during rattling are apparent. Both reptiles (29) and mammals (30) show an increase in arterial O2 content with exercise. The elevated arterial lactate during rattling may simply reflect the fact that lactate extraction from the venous blood is not complete before the blood returns as arterial blood.
Table 1.
Blood flow, O2 uptake, and lactate flux based on cardiovascular properties at rest and rattling
| Blood flow, ml/min | O2 content,
mM
|
O2 uptake, μmol/(s⋅g) | Lactate, mM
|
Lactate flux, μmol/(s⋅g) | |||
|---|---|---|---|---|---|---|---|
| Arterial | Venous | Arterial | Venous | ||||
| Rest | 5.7 ± 0.7 | 2.4 ± 0.5 | 1.9 ± 0.3 | 0.012 ± 0.005 | 2.8 ± 1.2 | 3.0 ± 1.2 | 0.0043 ± 0.0002 |
| Rattling | 14.9 ± 0.5* | 2.8 ± 0.1 | 0.6 ± 0.2* | 0.16 ± 0.02* | 4.8 ± 0.8 | 6.8 ± 1.0* | 0.18 ± 0.04* |
Values are means ± SE for 4 snakes (n = 4–10, except for resting O2 contents; n = 2). O2 and lactate fluxes are expressed per gram tailshaker muscle mass.
Denotes significant difference from rest.
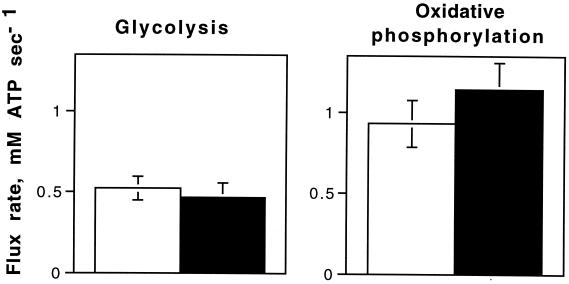
The result of the increase in blood flow and the arterial-venous differences between rest and rattling is a nearly 10-fold increase in O2 uptake and an even greater increase in lactate flux (Table 1). The ATP generated from this lactate flux (0.25 ± 0.06 mM lactate/sec or 0.38 ± 0.09 mM ATP/sec; n = 7) plus that from the glycolytic flux that is oxidized (Eq. 2; 0.100 ± 0.012 mM ATP/sec, n = 5) means 0.46 ± 0.09 mM ATP/sec (n = 5) is supplied by glycolysis. Fig. 4 shows that this glycolysis during normal rattling results in an ATP synthesis that equals the MR determination of glycolytic ATP synthesis during ischemia. This agreement confirms our MR determination of glycolytic H+ production with direct measurement of lactate efflux from the muscle. More importantly, the similar glycolytic flux under anoxic and aerobic rattling conditions demonstrates that glycolysis is independent of a muscle's oxygenation state. Fig. 4 also shows agreement between MR and direct measurements of oxidative ATP supply during steady-state rattling.
Figure 4.
Comparison of the ATP supply by glycolysis and oxidative phosphorylation as determined by MR spectroscopy (open bars) and blood measurements (closed bars). Values are means ± SEM. Number of determinations as in Fig. 3 and Table 1.
Discussion
Oxidative phosphorylation is considered the primary ATP supply for sustained muscle contraction for two reasons. First, glycolysis is an anaerobic process, and substantial ATP supply is thought to occur only in the absence of oxygen or when ATP demands exceed aerobic ATP supply (25). Second, glycolysis generates products that accumulate and cause muscle fatigue thereby preventing sustained contractions (31). The results of this study disprove both of these notions for tailshaking by the rattlesnake. Glycolysis supports nearly one-third of the ATP supply needed to sustain rattling, and fatigue is avoided because the products of glycolysis are rapidly removed by the high blood flow serving the oxidative demands of continuous tailshaking.
The significant contribution of glycolytic ATP supply to the ATP balance during normal rattling is apparent in Fig. 3. The oxidative phosphorylation rate during normal rattling provides significantly less ATP supply than needed to meet contractile demands. The shortfall in ATP supply was found to equal the glycolytic ATP supply during anoxic rattling. These findings demonstrate that oxidative ATP supply alone is insufficient to meet the demands of sustained rattling. Because the shortfall in the ATP balance is met by the glycolytic flux in anoxia, these results also suggest that glycolytic flux is independent of oxygenation state. Our previous noninvasive 31P MR spectroscopy measurements in human muscle showed similar glycolytic flux under anoxic and aerobic exercise conditions (9). This glycolytic flux exceeded the oxidation of pyruvate, as shown by the accumulation of H+ and the decrease of pH during contraction. The lactate efflux from the muscle expected to accompany this H+ flux provides an independent means for confirming that substantial glycolysis occurs not only during anoxic contractions but also during aerobic contractions.
Direct comparison of intracellular glycolysis with lactate generation during rattling is possible because the tailshaker muscles have an exclusive circulation permitting unambiguous determination of lactate flux and O2 uptake. The large increase in energetic flux between rest and rattling is shown in Table 1 by the manyfold increases in blood flow, O2 extraction, and the arterial-venous differences in blood lactate concentration. The result of this high flow and these arterial-venous differences is a 10-fold increase in O2 uptake and a >40-fold increase in lactate flux between rest and rattling. This rate of blood flow per muscle mass [468 ± 41 ml/(min⋅100 g)] is among the highest sustained levels reported and exceeds that of the skeletal and heart muscles of racehorses [<300 of ml/(min⋅100 g); ref. 32] exercising at their aerobic capacity at muscle temperatures >40°C (33). Remarkably, lactate generation during rattling at 30°C [0.18 μmol/(g⋅sec); Table 1] exceeds the rate of athletic human quadricep muscle [0.09 μmol/(g⋅sec)] exercising at its aerobic capacity (7). The ATP synthesis resulting from the measured lactate flux into blood, as well as from glycolytic flux that is oxidized during normal rattling, equals the MR determination of glycolytic ATP synthesis during ischemia (Fig. 4). This agreement between glycolytic flux under ischemic and aerobic rattling conditions means that we can reject the hypothesis that lactate generation necessarily reflects an O2 limitation.
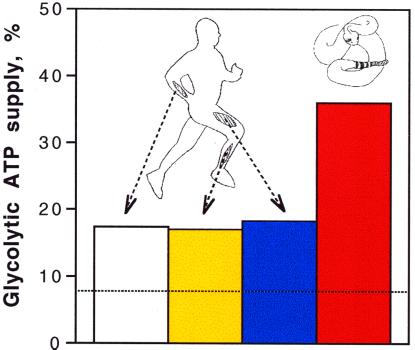
The glycolytic flux during rattling is one-third of the ATP needed to sustain rattling (Fig. 3). This glycolytic ATP production exceeds by >4-fold the 8% expected if pyruvate were completely derived from glycogen, the sole substrate for oxidative phosphorylation, and completely oxidized. This apparently “excessive” glycolytic flux is not restricted to rattling; Fig. 5 shows that glycolysis exceeds oxidative needs in three human muscles during sustained contractions as well (9, 14, 34). The fate of this lactate seems to be primarily uptake by other muscles, because both heart and skeletal muscle readily take up and oxidize circulating lactate (35, 36). Thus, a greater glycolytic flux than can be oxidized and the independence of glycolysis on O2 levels may be the rule, rather than the exception, for exercising skeletal muscle.
Figure 5.
The percentage of glycolysis to total ATP supply in human muscle and rattlesnake tailshaker muscle during sustained contractions. The bars represent the following muscles: open bar, wrist flexor muscles (9); yellow bar, tibialis anterior (9); blue bar, quadriceps (34); and red bar, tailshaker muscles. The dashed horizontal line represents the 8% of ATP supplied when pyruvate is derived exclusively from glycogen, is the sole substrate for respiration, and is completely oxidized.
What role does this apparently “excessive” glycolytic flux play in cellular energetics? A link between glycolysis (so-called aerobic glycolysis) and ion transport has been reported in smooth (37) and skeletal muscle (3), as well as in neural tissue (4, 5). For example, ion and transmitter exchange in astrocytes is fueled by glycolytic ATP supply and the lactate they generate in this process diffuses to adjacent neurons for oxidation (4, 5). High levels of ion pumping occur in tailshaker muscle as measured by rapid Ca2+ uptake kinetics (38) and as indicated by the large cellular fraction of sarcoplasmic reticulum (SR) for Ca2+ cycling (26% vol/vol; ref. 10). In addition, there is ultrastructural evidence in vertebrate muscle of a close association of the glycolytic enzymes and SR ATPase (39). Thus the extraordinarily large relative and absolute glycolytic flux in tailshaker muscle may reflect the high Ca2+ pumping costs of rapid rattling.
A second role for this high glycolytic flux is the supply of intermediates for the tricarboxylic acid (TCA) cycle (40). Exercise is accompanied by a large increase in the level of intermediates of the TCA cycle, which may be necessary for attaining high levels of oxidative flux.
Thus, two characteristics associated conventionally with high glycolytic flux in muscle—brief, fatiguing muscle contractions or anoxia—are absent during rattling. The high O2 delivery rate in rattling is responsible for avoiding muscle fatigue because the accompanying high blood flow rate permits rapid H+ and lactate efflux. Therefore, high rates of oxidative phosphorylation and glycolysis are not mutually exclusive but rather interact to permit the large glycolytic flux needed to meet the parallel demands of Ca2+ uptake and crossbridge cycling. The result is a sustainable glycolytic ATP supply that meets a substantial fraction of the ATP demand of continuous muscle contraction.
Acknowledgments
We thank Morten Busk, Colleen Farmer, Rod Gronka, Hans Gunderson, Daryl Monear, Brad Moon, Johannes Overgaard, Eric Shankland, and Tobias Wang for assistance, and Greg Crowther and Martin Kushmerick for comments on the manuscript. This work was supported by National Institutes of Health Grants AR45184 and AR41928; National Science Foundation Grants 93–17527, 93–06596, 96–04698, and 96–14731; and by the Royalty Research Fund of the University of Washington. W.F.K. was a National Science Foundation Predoctoral Fellow.
Abbreviations
- MR
magnetic resonance
- PCr
creatine phosphate
Footnotes
This paper was submitted directly (Track II) to the PNAS office.
See commentary on page 395.
Article published online before print: Proc. Natl. Acad. Sci. USA, 10.1073/pnas.011387598.
Article and publication date are at www.pnas.org/cgi/doi/10.1073/pnas.011387598
References
- 1.Gladden L B. In: Exercise: Regulation and Integration of Multiple Systems. Rowell R B, Shepherd J T, editors. Vol. 12. New York: Oxford Univ. Press; 1996. pp. 614–648. [Google Scholar]
- 2.Koike A, Wasserman K, McKenzie D K, Zanconato S, Weiler-Ravell D. Chest. 1990;86:1698–1706. doi: 10.1172/JCI114894. [DOI] [PMC free article] [PubMed] [Google Scholar]
- 3.James J H, Wagner K R, King J K, Leffler R E, Upputuri R K, Balasubramaniam A, Friend L A, Shelly D A, Paul R J, Fischer J E. Am J Physiol. 1999;277:E176–E186. doi: 10.1152/ajpendo.1999.277.1.E176. [DOI] [PubMed] [Google Scholar]
- 4.Rothman D L, Sibson N R, Hyder F, Shen J, Behar K L, Shulman R G. Philos Trans R Soc London B. 1999;354:1165–1177. doi: 10.1098/rstb.1999.0472. [DOI] [PMC free article] [PubMed] [Google Scholar]
- 5.Magistretti P J, Pellerin L. Philos Trans R Soc London B. 1999;354:1155–1163. doi: 10.1098/rstb.1999.0471. [DOI] [PMC free article] [PubMed] [Google Scholar]
- 6.Connett R J, Gayeski T E, Honig C R. J Appl Physiol. 1986;61:402–408. doi: 10.1152/jappl.1986.61.2.402. [DOI] [PubMed] [Google Scholar]
- 7.Richardson R S, Noyszewski E A, Leigh J S, Wagner P D. J Appl Physiol. 1998;85:627–634. doi: 10.1152/jappl.1998.85.2.627. [DOI] [PubMed] [Google Scholar]
- 8.Voter W A, Gayeski T E J. Am J Physiol. 1995;269:H1328–H1341. doi: 10.1152/ajpheart.1995.269.4.H1328. [DOI] [PubMed] [Google Scholar]
- 9.Conley K E, Kushmerick M J, Jubrias S A. J Physiol (London) 1998;511:935–945. doi: 10.1111/j.1469-7793.1998.935bg.x. [DOI] [PMC free article] [PubMed] [Google Scholar]
- 10.Schaeffer P J, Conley K E, Lindstedt S L. J Exp Biol. 1996;199.02:351–358. doi: 10.1242/jeb.199.2.351. [DOI] [PubMed] [Google Scholar]
- 11.Schultz E, Clark A W, Suzuki A, Cassens R G. Tissue Cell. 1980;12:323–334. doi: 10.1016/0040-8166(80)90008-7. [DOI] [PubMed] [Google Scholar]
- 12.Martin J H, Bagby R M. J Exp Zool. 1973;185:293–300. doi: 10.1002/jez.1401850303. [DOI] [PubMed] [Google Scholar]
- 13.Blei M L, Conley K E, Kushmerick M J. J Physiol (London) 1993;465:203–222. doi: 10.1113/jphysiol.1993.sp019673. [DOI] [PMC free article] [PubMed] [Google Scholar]
- 14.Conley K E, Blei M L, Richards T L, Kushmerick M J, Jubrias S A. Am J Physiol. 1997;273:C306–C315. doi: 10.1152/ajpcell.1997.273.1.C306. [DOI] [PubMed] [Google Scholar]
- 15.Meyer R, Foley J, Harkema S, Sierra A, Potchen E. Magn Reson Imaging. 1993;11:1085–1092. doi: 10.1016/0730-725x(93)90235-6. [DOI] [PubMed] [Google Scholar]
- 16.Marro K. J Magn Reson. 1997;124:240–244. doi: 10.1006/jmre.1996.1053. [DOI] [PubMed] [Google Scholar]
- 17.Crowther G J, Carey M F, Kemper W F, Conley K E. Med Sci Sports Exercise. 1999;31:S242. [Google Scholar]
- 18.Conley K E, Lindstedt S L. Nature (London) 1996;383:71–72. doi: 10.1038/383071a0. [DOI] [PubMed] [Google Scholar]
- 19.Lawson J W, Veech R L. J Biol Chem. 1979;254:6528–6537. [PubMed] [Google Scholar]
- 20.Golding E M, Teague W E, Dobson G P. J Exp Biol. 1995;198:1775–1782. doi: 10.1242/jeb.198.8.1775. [DOI] [PubMed] [Google Scholar]
- 21.Teague W E J, Golding E M, Dobson G P. J Exp Biol. 1996;199:509–512. doi: 10.1242/jeb.199.2.509. [DOI] [PubMed] [Google Scholar]
- 22.Kost G. Magn Reson Med. 1990;14:496–506. doi: 10.1002/mrm.1910140307. [DOI] [PubMed] [Google Scholar]
- 23.Tucker V A. J Appl Physiol. 1967;23:410–414. doi: 10.1152/jappl.1967.23.3.410. [DOI] [PubMed] [Google Scholar]
- 24.Sjøgaard G, Saltin B. Am J Physiol. 1982;243:R271–R280. doi: 10.1152/ajpregu.1982.243.3.R271. [DOI] [PubMed] [Google Scholar]
- 25.Connett R J, Sahlin K. In: Exercise: Regulation and Integration of Multiple Systems. Rowell L B, Shepherd J T, editors. Vol. 12. New York: Oxford Univ. Press; 1996. pp. 870–911. [Google Scholar]
- 26.Meyer R. Am J Physiol. 1989;257:C1149–C1157. doi: 10.1152/ajpcell.1989.257.6.C1149. [DOI] [PubMed] [Google Scholar]
- 27.Paganini A T, Foley J M, Meyer R A. Am J Physiol. 1997;272:C501–C510. doi: 10.1152/ajpcell.1997.272.2.C501. [DOI] [PubMed] [Google Scholar]
- 28.Foley J M, Meyer R A. NMR Biomed. 1993;6:32–38. doi: 10.1002/nbm.1940060106. [DOI] [PubMed] [Google Scholar]
- 29.Gleeson T T, Mitchell G S, Bennett A F. Am J Physiol. 1980;239:R174–R179. doi: 10.1152/ajpregu.1980.239.1.R174. [DOI] [PubMed] [Google Scholar]
- 30.Taylor C R, Karas R H, Weibel E R, Hoppeler H. Respir Physiol. 1987;69:1–127. doi: 10.1016/0034-5687(87)90097-1. [DOI] [PubMed] [Google Scholar]
- 31.Fitts R H. Physiol Rev. 1994;74No.1:49–94. doi: 10.1152/physrev.1994.74.1.49. [DOI] [PubMed] [Google Scholar]
- 32.Armstrong R B, Essén-Gustavsson B, Hoppeler H, Jones J H, Kayar S R, Laughlin M H, Lindholm A, Longworth K E, Taylor C R, Weibel E R. J Appl Physiol. 1992;73:2274–2282. doi: 10.1152/jappl.1992.73.6.2274. [DOI] [PubMed] [Google Scholar]
- 33.Jones J, Taylor C R, Lindholm A, Straub R, Longworth K E, Karas R H. J Appl Physiol. 1989;67:879–884. doi: 10.1152/jappl.1989.67.2.879. [DOI] [PubMed] [Google Scholar]
- 34.Conley K E, Jubrias S A, Esselman P E. J Physiol. 2000;526.1:203–210. doi: 10.1111/j.1469-7793.2000.t01-1-00203.x. [DOI] [PMC free article] [PubMed] [Google Scholar]
- 35.Brooks G A. Med Sci Sports Exercise. 1991;23:895–906. [PubMed] [Google Scholar]
- 36.Van Hall G. Acta Physiol Scand. 2000;168:643–656. doi: 10.1046/j.1365-201x.2000.00716.x. [DOI] [PubMed] [Google Scholar]
- 37.Zhang C, Paul R J. Am J Physiol. 1994;267:H1996–H2004. doi: 10.1152/ajpheart.1994.267.5.H1996. [DOI] [PubMed] [Google Scholar]
- 38.Rome L C, Syme D A, Hollingwort S H, Lindstedt S L, Baylor S M. Proc Natl Acad Sci USA. 1996;93:8095–8100. doi: 10.1073/pnas.93.15.8095. [DOI] [PMC free article] [PubMed] [Google Scholar]
- 39.Xu K Y, Becker L C. J Histochem Cytochem. 1998;46:419–427. doi: 10.1177/002215549804600401. [DOI] [PubMed] [Google Scholar]
- 40.Gibala M J, Young M E, Taegtmeyer H. Acta Physiol Scand. 2000;168:657–665. doi: 10.1046/j.1365-201x.2000.00717.x. [DOI] [PubMed] [Google Scholar]
- 41.Weber J-M, Roberts T J, Vock R, Weibel E R, Taylor C R. J Exp Biol. 1996;199:1659–1666. doi: 10.1242/jeb.199.8.1659. [DOI] [PubMed] [Google Scholar]


