Abstract
The nitrogen isotopic composition (15N/14N) of forested ecosystems varies systematically worldwide. In tropical forests, which are elevated in 15N relative to temperate biomes, a decrease in ecosystem 15N/14N with increasing rainfall has been reported. This trend is seen in a set of well characterized Hawaiian rainforests, across which we have measured the 15N/14N of inputs and hydrologic losses. We report that the two most widely purported mechanisms, an isotopic shift in N inputs or isotopic discrimination by leaching, fail to explain this climate-dependent trend in 15N/14N. Rather, isotopic discrimination by microbial denitrification appears to be the major determinant of N isotopic variations across differences in rainfall. In the driest climates, the 15N/14N of total dissolved outputs is higher than that of inputs, which can only be explained by a 14N-rich gas loss. In contrast, in the wettest climates, denitrification completely consumes nitrate in local soil environments, thus preventing the expression of its isotope effect at the ecosystem scale. Under these conditions, the 15N/14N of bulk soils and stream outputs decrease to converge on the low 15N/14N of N inputs. N isotope budgets that account for such local isotopic underexpression suggest that denitrification is responsible for a large fraction (24–53%) of total ecosystem N loss across the sampled range in rainfall.
Keywords: climate, isotope, tropics, ecosystem, global change
Coherent patterns in N isotope composition across forests and soils suggest that natural abundance isotopes can provide critical information on the N cycle across broad geographic areas. Tropical forests, which are highly productive and play an important role in the Earth's climate system (1), are among the most 15N-enriched of the terrestrial biomes (2); however, the 15N/14N of plant and soil pools in tropical forests decrease systematically with increasing rainfall across tropical forests (3–8). This latter trend has garnered considerable attention because it implies a coupling between climate and the N cycle; however, the underlying cause remains unclear. The decline in forest soil 15N/14N with increasing rainfall has been attributed to: (i) changes in the 15N/14N of atmospheric N inputs (9, 10) such as biological N2 fixation or rainfall and cloud deposition, (ii) preferential leaching of isotopically light N to stream waters (3–8, 11), or (iii) gaseous losses of isotopically light N to the atmosphere (3–8, 11).
Here, we examine these hypotheses in a series of tropical montane rainforests on Mt. Haleakala, Maui, HI; we also identify the mechanism(s) responsible for the elevation of soil 15N/14N relative to atmospheric N2. At this location, Schuur and Matson (6) characterized a sequence of six tropical forests, across which mean annual precipitation (MAP) varies from 2,200 to 5,050 mm, thus spanning the majority of tropical rainforest MAP worldwide (12). Ecosystem state factors (13) such as bedrock (≈400,000-year-old basaltic tephra), plant composition (trees dominated by Metrosideros polymorpha), mean annual temperature (16°C), topographic relief (slope of <5%), and elevation (1,270–1,370 m) are relatively constant across the gradient (6). The forests have never been cleared for timber or agriculture (6), are composed of species native to Hawaii, and have thus far escaped modern increases in anthropogenic N deposition. Because N pools equilibrate within 20,000 years of development in Hawaii (14, 15), the internal N pools in these ≫20,000-year-old forests should be at steady state with respect to N inputs and losses.
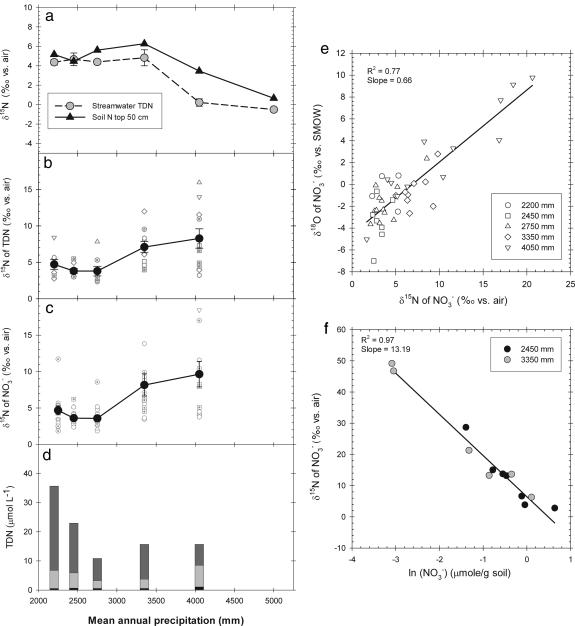
In the soil N of most of these forests, Schuur and Matson (6) have observed the high 15N/14N characteristic of the mean of the tropical forest biome (2). Moreover, they observed that the integrated 15N/14N of the top 50 cm of soils decreased with MAP, with the steepest change occurring between the sites with 3,350 and 4,050 mm of MAP (Fig. 3a). Together with a similar decrease in plant 15N/14N with rainfall along this gradient (6), these trends mimic the patterns observed for forests worldwide (4, 7).
Fig. 3.
Nitrogen isotope ratios and chemistry in rainforest soils. (a) 15N/14N of the top 50 cm of bulk soil (14). (b and c) 15N/14N of TDN (b) and of NO3− (c) in soil solution from a 35-cm depth. (d) Soil solution N species. Symbols are the same as in Fig. 2. (e) Relationship between soil solution nitrate 15N/14N and 18O/16O across all sites. (f) 15N/14N of NO3− vs. the natural logarithm of soil NO3− concentration in a series of cores designed to eliminate processes other than denitrification, such as nitrification (by addition of N serve) and plant uptake (by removal of plant roots) (see Supporting Materials and Methods).
Results and Discussion
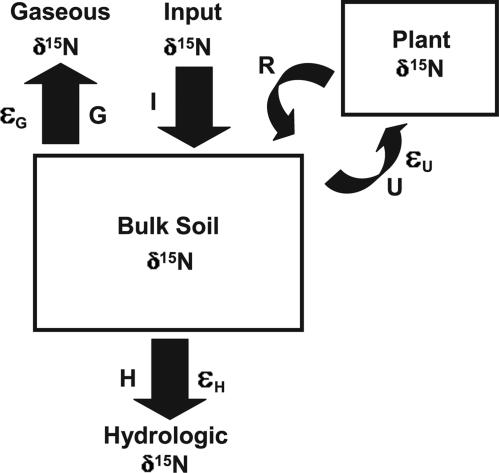
We measured over 4 years (14 events distributed across seasons and hydrological conditions) the 15N/14N of NO3− and of total dissolved N (TDN) in precipitation and cloud water inputs, in stream water losses, and in soil waters and extracts. In Fig. 1 we show that the assumption of steady state N pools permits us to exclude effects of plant N uptake, because this process only impacts bulk soil N isotopes under transient conditions such as net N accumulation (7). On the basis of previous work (11), we assume that the N contributed by biological N2 fixation has a 15N/14N close to that of air [i.e., its δ15N is 0‰, where δ15N (per mil, ‰, vs. air) = (15N/14Nsample/15N/14Nair − 1)·1,000)]. Combining these constraints on N isotope budgets with the isotope data for bulk soils and plants from Schuur and Matson (6), we test the competing hypotheses for the elevation of the 15N/14N in these forests relative to atmospheric N2 and for the observed 15N/14N decrease in soil and plant N with increasing MAP (Fig. 1).
Fig. 1.
Conceptual model of controls on forest 15N/14N; soil N and plant N are boxed. I, nitrogen input flux to the forest; H and G, hydrologic leaching and gaseous fluxes, respectively; U and R, plant fluxes (uptake and return, respectively). εU, εH, and εG are effective (i.e., expressed) isotope effects for plant uptake and external hydrologic and gaseous losses, respectively [ε (in ‰) = (14k/15k − 1)·1,000, where k is the rate constant]. Under steady-state conditions, the N inputs into plants must balance the losses from it. Hence, the same flux-weighted δ15N that plants take up (U) is returned to the soil (R), resulting in no net change in soil δ15N by plant uptake processes. By contrast, losses of N to the external environment that fractionate against soil N isotopes (i.e., εH or εG) can lead to an elevation in soil δ15N relative to inputs. Consequently, at steady state, soil N isotopes can be modeled independently of plants: δ15Nsoil = δ15Ninputs + εH·(H/(H + G)) + εG·(G/(H + G)). In this study, we test which of the following best explains the soil δ15N variation across a rainfall sequence of tropical forests: (i) the δ15N of inputs, (ii) N isotope discrimination during hydrologic leaching (εH), or (iii) discrimination during gaseous N loss (εG).
Elimination of Two Competing Hypotheses.
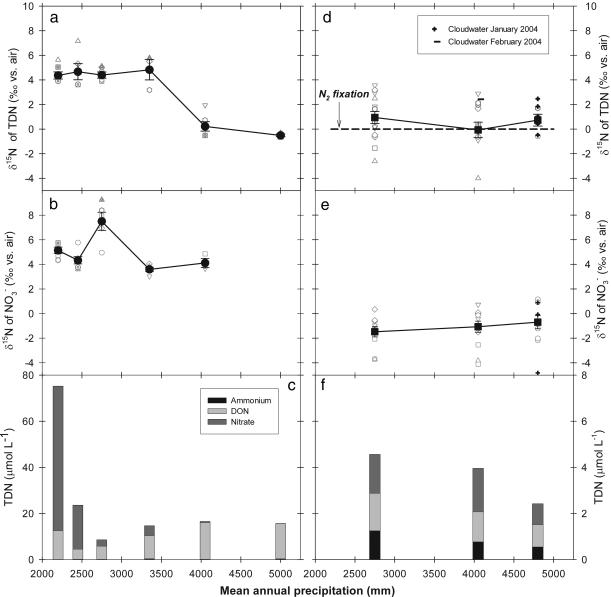
Neither the forms of N in bulk deposition nor its 15N/14N changed systematically with rainfall (Fig. 2d and f). Concentrations of all dissolved N forms were exceedingly low (<3 μmol per liter) in the rainfall but did not change in relative contribution across the sequence (Fig. 2f). The 15N/14N of TDN in deposition was statistically indistinguishable from 0‰ across the sequence (one-tailed t test, P > 0.15; n = 42) and thus similar to the isotopic ratio of N2 fixation (indicated by the dashed line in Fig. 2d). In addition, cloud water 15N/14N did not differ significantly from either bulk deposition or N2 fixation (one-tailed t test, P > 0.10; n = 6) (Fig. 2d). Thus, we found no evidence for our first hypothesis: that a trend in the 15N/14N of N inputs explains the decline in soil 15N/14N with rainfall.
Fig. 2.
Nitrogen isotope ratios and chemistry of small streams and atmospheric inputs across the rainforests. (a and b) In stream water, the 15N/14N of TDN (a) and of NO3− (b) are shown. (c) Stream water N species. (d and e) In atmospheric N inputs (precipitation and cloud water), the 15N/14N of TDN (d) and of NO3− (e) are shown; a δ15N of 0‰ for N2 fixation (11) is indicated in d. (f) Precipitation N species. Open gray symbols represent individual observations from 2001–2004 (see Supporting Materials and Methods); filled symbols connected by solid lines represent means ± 1 SE.
The 15N/14N of bulk soil (and thus of forest-integrated N) was substantially elevated relative to inputs across all but the two wettest forests (Fig. 3a). Such a difference between inputs and internal pools requires a pathway of preferential 14N loss from forests receiving <4,050 mm of MAP, which acts to elevate forest 15N/14N above the 15N/14N of the inputs to these forests (Fig. 1). However, we found no evidence for our second hypothesis: that the trend in soil 15N/14N was caused by decreasing isotopic fractionation of N leaching losses with increasing rainfall (3–8, 11). The forms of dissolved N in stream water losses changed sharply with rainfall: NO3− dominated in streams draining drier forests (<2,750 mm of MAP), whereas DON (TDN minus inorganic N) was the most important form of N in streams draining wet forests (Fig. 2c). This pattern indicates that NO3− accumulates in the drier forests to the point where NO3− leaching occurs, whereas only DON leaks from the wet forest ecosystems. Despite this shift in N forms, the 15N/14N of stream water TDN changed in a manner similar to the trend in bulk soils (Figs. 2a and 3a). In fact, we found only slight differences in 15N/14N between stream losses and soils, most notably in forests with >2,500 mm of MAP, where the δ15N of stream water TDN was 1–2‰ lower than soils. This isotopic difference between streams and soils, if anything, should cause an increase (rather than the observed decrease) in 15N/14N forest soils with increasing MAP.
Given that these forests can be assumed to be in steady state with respect to total N inputs and losses (14, 15), the 15N/14N of total losses must balance that of total inputs (Fig. 1). The 15N/14N ratios of leaching losses were consistently higher (ANOVA, P < 0.001; n = 53) than those of inputs at all but the two wettest sites (Fig. 2 a vs. d), indicating a pathway other than hydrologic loss for preferential 14N removal. The only remaining explanation is the process central to our third hypothesis: gaseous N loss. The most likely cause of such fractionating gaseous N loss is denitrification, which is known to strongly favor loss of 14N over 15N, especially in NO3− -rich soils (9, 11). Ammonia volatilization is unlikely, owing to the acidic (pH of 3.2–4.2) and NH4+ -poor soil conditions of our forests (6).
Evidence for Denitrification.
Examination of the isotope ratios of NO3− and TDN in local soil solutions and extracts indicates that soil denitrification was an important process in these forest soils. In both soil extracts and lysimeter samples, the δ15N of NO3− was substantially elevated above the ≈0‰ average input (Fig. 3c and Fig. 6, which is published as supporting information on the PNAS web site; see also ref. 16). The 15N/14N of soil water TDN (Fig. 3b) tracked this 15N enrichment in NO3−, with highest values and greatest range in the 15N/14N in the wetter forests. This similarity in 15N/14N between NO3− and TDN indicates that dissimilatory microbial reduction of NO3− to NH4+ (17) or some other aspect of internal cycling could not explain the local 15N enrichment in NO3− . Previous work indicates that, under the nutrient conditions that characterize these forests, plant uptake of dissolved inorganic N does not appear to discriminate between the N isotopes (11).
15N/14N and 18O/16O ratios of NO3− in soil solutions were highly correlated (R2 = 0.76; n = 44; P < 0.0001) within and across forests (Fig. 3e). Such a correlation has previously been found in terrestrial systems only when denitrification contributes actively to N loss (18, 19); it is caused by discrimination against both 15N and 18O during NO3− reduction. Moreover, the slope of the relationship (0.66) was similar to that associated with denitrification in groundwater systems (0.49–0.67) (18, 19).
Soil extracts (2 M KCl) indicated that the 15N/14N ratios of extracted NO3− were markedly elevated relative to those of extracted NH4+ in all but the shallowest forest soils (16). Without denitrification, NO3− that accumulates in soils would be lower in 15N/14N than NH4+ as a consequence of fractionation during nitrification of NH4+ to NO3− (9). Moreover, the soil extracts revealed decreasing NO3− concentrations and sharply increasing 15N/14N ratios from shallow to deep soils (Fig. 6). The most dramatic trends occurred in the wettest sites, where profiles of soil O2 availability (6) show sharp declines with depth, approaching levels that favor anaerobic metabolism. To our knowledge, our measurement of a δ15N of 180‰ for NO3− extracted from soil at a 35-cm depth in the 4,050-mm MAP forest is the highest δ15N ever reported from a natural soil system. This parallel decline in NO3− concentration, increase in the 15N/14N and 18O/16O of NO3−, and decrease in O2 availability with soil depth is highly suggestive of active denitrification (16).
Finally, the presence of measurable NO3− in soil extracts and soil solutions from wet forests (>2,750 mm; Fig. 3d), coupled with the virtual absence of NO3− in streams draining the same forests (Fig. 2c), suggests that denitrification occurred along the path of water flow from local soil solutions to watershed streams.
Scale Dependence of Isotopic Imprint.
Although denitrification raises the 15N/14N of soil N in our forests relative to atmospheric inputs, we have not yet resolved why this isotope ratio in soil organic matter decreases systematically with rainfall, especially because the greatest 15N enrichment of NO3− and TDN in soil waters and soil extracts is observed in the wettest forests. We must consider how the isotope effect of denitrification, a local process, is expressed at the largest scales, in the streams and bulk soils. Partial consumption of NO3− (“open-system kinetics”) leaves behind 15N-enriched NO3−, which can diffuse out of the zone of ongoing denitrification and enter the larger plant–soil N cycle. Complete NO3− consumption (“closed-system kinetics”) would cause underexpression of the isotope effect at larger scales (21, 22), because little or no 15N-rich NO3− would escape the zone of denitrification to elevate the 15N/14N of the larger plant–soil system.
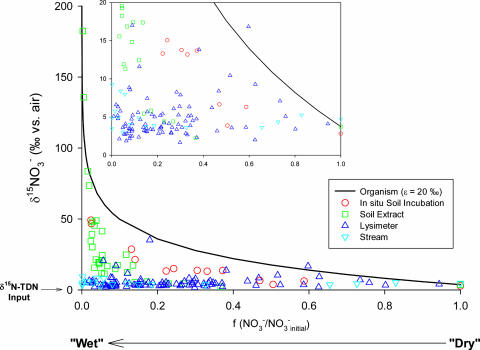
We found evidence of such scale dependence of isotope effect expression in our sites. When we plot δ15N vs. the fraction of NO3− consumed locally (see the legend of Fig. 4 for the calculation method), we find that the expressed isotope effect of denitrification decreased with increasing scale: the theoretical organism-level isotope effect (23, 24) (black line in Fig. 4) > local soil solution extracts (circles and squares) > water intercepted below rooting zones (triangles) > first-order watershed streams (inverted triangles). Moreover, the scale-dependent isotope effect underexpression was greatest in the wettest sites. Soil extracts and soil waters showed the greatest (and most variable) 15N enrichment of NO3− and TDN in the wettest sites (Figs. 3 b, c, e, and f and 6), but the stream waters and bulk soils, which integrate over the ecosystem-scale N budget (Fig. 1), displayed little to no 15N enrichment relative to inputs in these sites (Figs. 2 a and b and 3a). The absence of detectable NO3− in streams from the wettest forest provides a final indication that denitrification consumed NO3− locally, preventing isotopic expression at the watershed scale. We conclude that increasingly complete NO3− consumption by denitrification causes the observed decline in ecosystem 15N/14N with increasing rainfall.
Fig. 4.
Isotopic expression of denitrification across sampling scales. The x axis is f, the fraction of nitrate remaining, which is the ratio of measured NO3− to the estimated initial NO3− concentration. We estimated the initial NO3− concentration and 15N/14N as follows: for the incubation experiment (see Supporting Materials and Methods and Fig. 3f), we used the highest extractable NO3− concentration and its corresponding 15N/14N; for soil extracts, we used the mean of the five highest NO3− concentrations and their corresponding 15N/14N; for lysimeters, we used the mean of the five highest soil water NO3− concentrations and their corresponding 15N/14N; for streams, we used the mean of the five highest stream water NO3− concentrations and their corresponding 15N/14N. The organism-level isotope effect line was calculated using an approximate form of the Rayleigh equation, δ15NO3− = δ15NO3− initial − ε·(ln(f)) (20), and an intrinsic ε of 20‰ (23, 24).
An Isotope-Balance Approach for Reconstructing Pathways of N Loss.
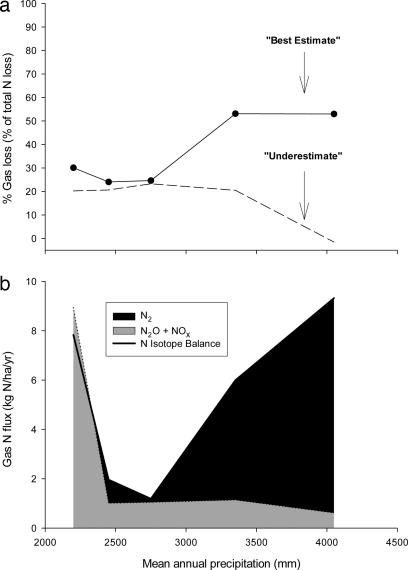
We apply an isotope-balance approach to partition the relative magnitudes of gaseous vs. hydrologic N losses across forests. We present two calculations, which derive from the same mass-balance equation but differ in the degree to which they incorporate the above findings of isotopic underexpression (see the legend of Fig. 5; see also Supporting Materials and Methods, which is published as supporting information on the PNAS web site). In the most conservative case, we assume no isotopic underexpression of denitrification [i.e., the ecosystem-level isotope effect is taken as 20‰ (23, 24)], which allows us to place a lower bound on the proportion of N loss by means of denitrification. This calculation (Fig. 5a) shows that denitrification constitutes ≈20% (and hydrological losses constitute ≈80%) of total N losses in sites with <4,050 mm of MAP. However, the fraction of N lost to denitrification drops to 0% in the 4,050-mm MAP site because, as discussed above, the organism-level isotope effect of denitrification is not expressed in streams draining our wettest forests. Given our evidence for underexpression of the denitrification isotope effect (Fig. 4), we believe that this calculation shows the lower limit of the true importance of gaseous N loss in the wettest sites.
Fig. 5.
Partitioning of N losses by isotope balance. (a) The fraction of total N loss by gaseous N using stream and lysimeter isotope data. The following equation was solved for the fraction of total N loss by gaseous N using stream and lysimeter isotope data: δ15N-TDNdeposition (i.e., 0.47‰) = δ15Ngas·(fgas) + δ15NTDN·(1 − fgas), where f is the fraction of loss. In the “underestimate,” δ15Ngas was estimated as the weighted-mean δ15N of NO3− in stream water minus an ε of 20‰ (23, 24), and δ15N-TDN was taken from the stream water; in the “best estimate,” δ15Ngas was estimated as the weighted-mean δ15N of NO3− in deep soil waters minus an ε of 13.2‰, and δ15N-TDN was taken from the soil waters (Fig. 2f). (b) Estimated rates and forms of gaseous N loss. Fluxes were calculated by applying a linear regression for the relationship between rainfall and evapotranspiration to estimated stream flow (31). Also shown are in situ fluxes of NOx and N2O from ref. 26 and P. A. Matson, personal communication. The N2 flux is estimated as the difference between total gas flux based on the N isotope balance and the N2O and NOx fluxes measured by chambers.
In the second calculation, we seek to account for local isotopic underexpression of denitrification by using the 15N/14N of NO3− from soil solutions collected from beneath the plant-rooting zone, coupled with an empirically determined denitrification isotope effect to derive the δ15N of gaseous N loss (see the legend of Fig. 5). The field-calibrated isotope effect was intended to match the degree of underexpression observed at scales of soil waters: we used in situ cores, removing the effects of plant N uptake (by excluding plant roots) and nitrification (by additions of N serve, i.e., nitrapyrin) (Supporting Materials and Methods). The 15N/14N of NO3− in these core incubations displayed a strong relationship of 15N enrichment with the logarithm of the NO3− consumed, consistent with consumption of a closed NO3− pool (ref. 20 and Fig. 3f). The slope (13.2‰) of this relationship (n = 13; R2 = 0.97; P < 0.0001) identifies an empirical isotope effect that is lower than the organism-level isotope effect (of ≈20‰; refs. 23 and 24); this result offers further evidence of heterogeneity in isotope expression within our soils.
Applying this empirical isotope effect to the soil water TDN-δ15N data (as opposed to the stream TDN-δ15N data in the calculation), we calculate that denitrification accounts for 24–53% of total N losses across our forests (Fig. 5a, circles connected by solid line). The estimates for the three driest sites (≈25%) are almost identical to the stream-based approach. However, for the 3,350- and 4,050-mm MAP sites, denitrification increased substantially above the stream-based estimates to ≈50% of total N losses.
By combining these calculations with estimates of dissolved N losses, we can derive total fluxes of both gaseous and hydrological N losses. In Fig. 5b we show that total gas N fluxes (≈2–9 kg of N per hectare per year) are appreciable when compared with the range of total N inputs (including biological N2 fixation, rain, and cloud water deposition) of <6 kg of N per hectare per year in Hawaiian forests which are not immediately downwind of active volcanoes (25, 15). In the drier forests, our fluxes do not differ substantially from short-term, chamber-based measures of oxidized N (Fig. 5b; ref. 26 and P. A. Matson, personal communication). However, in wet forests, our estimates are ≈10 times higher than chamber-based measurements. This difference could be caused by episodic denitrification (e.g., linked to rainfall events) that is not captured by chamber methods. Alternatively, and perhaps more likely, denitrification is converting almost all of the NO3− to N2 in the wettest sites, consistent with expectations for denitrification under low-O2 conditions (27).
Conclusions
We conclude that the pattern of decreasing ecosystem 15N/14N with increasing rainfall cannot be explained by changes in N inputs (9, 10) or preferential leaching of 14N to streams (3–8, 11). Rather, gaseous N loss is the major influence on forest 15N/14N across the climate gradient, with denitrification acting as a dominant pathway. In the drier sites, incomplete nitrate consumption by denitrification causes the elevation of bulk soil 15N/14N relative to atmospheric N2 and the measured N inputs to the forests. In the wettest sites, complete denitrification prevents its isotopic expression at larger scales, explaining why the 15N/14N ratios of bulk soil N and stream losses decrease with rainfall and converge on the 15N/14N ratios of the inputs. Our findings provide evidence that denitrification can be a major vector of N loss from tropical rainforests (i.e., ≈24–53% of total N loss), with a large impact in overall forest N balances. To the extent that these findings apply generally to tropical forests, they identify a poorly resolved pathway in the global N budget.
Methods
We collected bulk deposition in polypropylene funnels connected with silicon tubing to high-density polyethylene bottles. We sampled cloud water by an active collector mounted on a telescoping tower 15 m above the ground (25). We collected soil water from silica gel lysimeters at a 35-cm depth by using slight vacuum pressure (32 cm of Hg) over 72 h (14). Streams were sampled with syringes. Samples were immediately filtered through precleaned glass fiber filters (Gelman A/E, 1.0-μm nominal pore size). Chemical methods for the following were as described in ref. 14: ion chromatography for NO3−, colorimetry for NH4+, and persulfate oxidation followed by colorimetry or furnace combustion for TDN. The 15N/14N and 16O/18O ratios of NO3− were analyzed by using the denitrifier method (28, 29); 15N/14N of TDN was analyzed by persulfate oxidation followed by the denitrifier method (30). (See Supporting Materials and Methods.)
Supplementary Material
Acknowledgments
We thank Angie Knapp for analytical advice; Heraldo Farrington, Gordon Holtgrieve, Jon Benner, Alex Barron, Duncan Menge, Jennifer Houlton, and Doug Turner for assistance in sample collection or figure preparation; Paul Singleton and Herald Keyser for providing laboratory space on Maui; Barry Huebert for assistance in cloud water sampling; Michael Bender, Chris Field, Pam Matson, Ted Schuur, and Peter Vitousek for discussions of the core ideas in the manuscript; and Bill Schlesinger for editing that improved the final manuscript. This work was supported by the Andrew W. Mellon Foundation (to L.O.H.) and the National Science Foundation Biocomplexity program (DEB-0083566).
Abbreviations
- TDN
total dissolved N
- MAP
mean annual precipitation.
Footnotes
Conflict of interest statement: No conflicts declared.
This paper was submitted directly (Track II) to the PNAS office.
References
- 1.Field C. B., Behrenfeld M. J., Randerson J. T., Falkowski P. Science. 1998;281:237–240. doi: 10.1126/science.281.5374.237. [DOI] [PubMed] [Google Scholar]
- 2.Martinelli L. A., Piccolo M. C., Townsend A. R., Vitousek P. M., Cuevas E., McDowell W., Robertson G. P., Santos O. C., Treseder K. Biogeochemistry. 1999;46:45–65. [Google Scholar]
- 3.Austin A. T., Vitousek P. M. Oecologia. 1998;113:519–529. doi: 10.1007/s004420050405. [DOI] [PubMed] [Google Scholar]
- 4.Handley L., Austin A., Robinson D., Scrimgeour C., Raven J., Heaton T., Schmidt S., Stewart G. Aust. J. Plant Physiol. 1999;26:185–199. [Google Scholar]
- 5.Austin A. T., Sala O. E. Aust. J. Plant Physiol. 1999;26:293–295. [Google Scholar]
- 6.Schuur E. A. G., Matson P. A. Oecologia. 2001;128:431–442. doi: 10.1007/s004420100671. [DOI] [PubMed] [Google Scholar]
- 7.Amundson R., Austin A. T., Schuur E. A. G., Yoo K., Matzek V., Kendall C., Uebersax A., Brenner D., Baisden W. T. Global Biogeochem. Cycles. 2003;17:1031. [Google Scholar]
- 8.Vitousek P. M. J. Biogeogr. 2002;29:573–582. [Google Scholar]
- 9.Kendall C. In: Isotope Tracers in Catchment Hydrology. Kendall C., McDonnell J., editors. New York: Elsevier Science; 1998. pp. 519–569. [Google Scholar]
- 10.Heaton T. H. E. Atmos. Environ. 1987;21:843–852. [Google Scholar]
- 11.Högberg P. New Phytol. 1997;137:179–203. doi: 10.1046/j.1469-8137.1997.00808.x. [DOI] [PubMed] [Google Scholar]
- 12.Molles M. C. Ecology: Concepts and Applications. New York: WCB/McGraw–Hill; 1999. [Google Scholar]
- 13.Jenny H. Factors of Soil Formation: A System of Quantitative Pedology. New York: McGraw–Hill; 1941. [Google Scholar]
- 14.Hedin L. O., Vitousek P. M., Matson P. A. Ecology. 2003;84:2231–2255. [Google Scholar]
- 15.Vitousek P. M. Nutrient Cycling and Limitation: Hawaii as a Model System. Princeton, NJ: Princeton Univ. Press; 2004. [Google Scholar]
- 16.Houlton B. Z. Ph.D. thesis. Princeton, NJ: Princeton Univ.; 2005. [Google Scholar]
- 17.Silver W. L., Herman D. J., Firestone M. K. Ecology. 2001;82:2410–2416. [Google Scholar]
- 18.Aravena R., Robertson W. D. Ground Water. 1998;36:975–982. [Google Scholar]
- 19.Mengis M., Schiff S. L., Harris M., English M. C., Aravena R., Elgood R. J., MacLean A. Ground Water. 1999;37:448–457. [Google Scholar]
- 20.Mariotti A., Germon J. C., Hubert P., Kaiser P., Letolle R., Tardieux A., Tardieux P. Plant Soil. 1981;62:413–430. [Google Scholar]
- 21.Brandes J. A., Devol A. H. Geochim. Cosmochim. Acta. 1997;61:1793–1801. [Google Scholar]
- 22.Thunell R. C., Sigman D. M., Muller-Karger F., Astor Y., Varela R. Global Biogeochem. Cycles. 2004;18:GB3001. [Google Scholar]
- 23.Wellman R. P., Cook E. D., Krouse H. R. Science. 1968;161:269–270. doi: 10.1126/science.161.3838.269. [DOI] [PubMed] [Google Scholar]
- 24.Miyake Y., Wada E. Records Oceanogr. Works Jpn. 1971;11:1–6. [Google Scholar]
- 25.Carrillo J. H., Hastings M. G., Sigman D. M., Huebert B. J. Global Biogeochem. Cycles. 2002;16:1076. [Google Scholar]
- 26.Holtgrieve G. W., Jewett P. K., Matson P. A. Oecologia. 2006;146:584–594. doi: 10.1007/s00442-005-0222-1. [DOI] [PubMed] [Google Scholar]
- 27.Potter C. S., Matson P. A., Vitousek P. M., Davidson E. A. J. Geophys. Res. Atmos. 1996;101:1361–1377. [Google Scholar]
- 28.Sigman D. M., Casciotti K. L., Andreani M., Barford C., Galanter M., Böhlke J. K. Anal. Chem. 2001;73:4145–4153. doi: 10.1021/ac010088e. [DOI] [PubMed] [Google Scholar]
- 29.Casciotti K. L., Sigman D. M., Galanter Hastings M., Böhlke J. K., Hilkert A. Anal. Chem. 2002;74:4905–4912. doi: 10.1021/ac020113w. [DOI] [PubMed] [Google Scholar]
- 30.Knapp A. K., Sigman D. M., Lipschultz F. Global Biogeochem. Cycles. 2005;19:GB1018. [Google Scholar]
- 31.Perakis S. S., Hedin L. O. Nature. 2002;415:416–417. doi: 10.1038/415416a. [DOI] [PubMed] [Google Scholar]
Associated Data
This section collects any data citations, data availability statements, or supplementary materials included in this article.


