Abstract
Health planners in the Division of Diabetes Translation and others from the National Center for Chronic Disease Prevention and Health Promotion of the Centers for Disease Control and Prevention used system dynamics simulation modeling to gain a better understanding of diabetes population dynamics and to explore implications for public health strategy. A model was developed to explain the growth of diabetes since 1980 and portray possible futures through 2050.
The model simulations suggest characteristic dynamics of the diabetes population, including unintended increases in diabetes prevalence due to diabetes control, the inability of diabetes control efforts alone to reduce diabetes-related deaths in the long term, and significant delays between primary prevention efforts and downstream improvements in diabetes outcomes.
DIABETES MELLITUS IS A growing health problem worldwide. In the United States, the number of people with diabetes has grown since 1990 at a rate much greater than that of the general population; it was estimated at 20.8 million in 2005. Total costs of diabetes in the United States in 2002 were estimated at $132 billion, with $92 billion of that amount in direct medical expenditures and the other $40 billion in indirect costs because of disability and premature mortality.1
There are no quick or easy fixes for addressing the health and cost burdens of diabetes. Like other dynamically complex problems, diabetes is characterized by long delays between causes and effects, and the public health effort to address it is characterized by multiple concurrent goals that may conflict with one another. For example, although planners have called for reductions both in the prevalence of diabetes and in deaths because of its complications,2 the fact is that fewer deaths, other things being equal, would lead to increased, not decreased, prevalence. Given such interconnections, a satisfactory solution will be found not in focusing on just 1 aspect of the overall health system—such as disease management, or detection, or risk factor reduction—but rather in addressing all major components together as a system.
We report results of simulation experiments with a system dynamics model developed to explore the past and future burden of diabetes—its morbidity, mortality, and costs—in the United States. Model development was sponsored by the Division of Diabetes Translation and the Division of Adult and Community Health at the Centers for Disease Control and Prevention (CDC). For background on system dynamics methodology and applications, see Sterman’s comprehensive textbook.3
MODEL STRUCTURE AND CALIBRATION
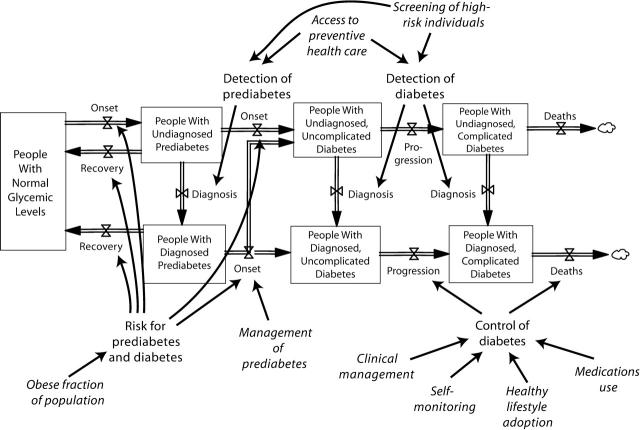
Figure 1 ▶ displays the basic causal structure of the system dynamics model. The full structure also includes an inflow of adult population growth and outflows of non–diabetes-related deaths. This structure reflects the knowledge and policy concerns of project team participants and is grounded in the scientific literature on diabetes, obesity, and related topics. Like all models, this one is a simplification: it omits many details in order to enhance understanding and includes assumptions that are uncertain to some degree. The model has evolved through a collaborative and iterative process that still continues.
FIGURE 1—
Overview of model structure, showing primary population stocks (boxes) and flows (arrows with valve symbols and cloud symbols for deaths), modifiable factors affecting flows (roman), and inputs amenable to policy intervention (italics).
At the core of the model is a chain of population stocks (appearing as boxes) and flows (appearing as double-thick arrows with valve symbols) portraying the movement of people into and out of the following stages: (1) normal blood glucose (normoglycemia); (2) prediabetes, defined as having impaired glucose tolerance, impaired fasting glucose, or both4,5; (3) uncomplicated diabetes—that is, meeting the testing criteria for diabetes but not yet symptomatic nor showing detectable signs of disease in the eyes, feet, kidneys, or other organs; and (4) complicated diabetes.
The prediabetes and diabetes (hyperglycemic) stages are further divided among stocks of people whose conditions are diagnosed or undiagnosed. Diagnosis has dynamic significance because it is a prerequisite for proper management and control of hyperglycemia and the often accompanying risk factors of hypertension and hyperlipidemia; and such management or control can, in turn, greatly reduce the rates of diabetes onset, progression, and death.6–10 In addition, diagnosis affects the extent to which the prevalence of diabetes in the population is recognized and measured, as well as the amount of effort and money that are put into the clinical management of prediabetes and diabetes.
Outside the population stock–flow structure, Figure 1 ▶ shows the potentially modifiable influences in the model that affect the rates of population flow, including influences that may be directly amenable to policy intervention (indicated in italics). These flow-rate drivers include prediabetes and diabetes detection, prediabetes management, diabetes control, and (because of its influence on the risks of prediabetes and diabetes onset) the population prevalence of obesity. Prediabetes and diabetes detection may be improved by 2 types of interventions: those increasing the glucose screening of high-risk individuals by their providers, and those increasing access to preventive health care. Diabetes control may be improved by 4 types of interventions: those enhancing clinical management and those encouraging patients to self-monitor glucose levels, adopt healthy lifestyles, or use prescribed medications. (Another factor affecting flow rates in the model, but not indicated in Figure 1 ▶, is aging of the population, which affects death rates as well as prediabetes and diabetes onset rates. The system dynamics model, for the sake of simplicity, does not explicitly depict the additional effects of changing racial and ethnic composition, as a Markov model by other researchers does.11 However, by including the effects of changes in obesity prevalence, the system dynamics model does capture what may be the most salient consequence of changes in racial and ethnic composition.)
The model’s parameters were calibrated on the basis of historical data available for the US adult population, as well as estimates from the scientific literature. The primary data sources and topics are summarized in Table 1 ▶.
TABLE 1—
Primary Data for Model Calibration
| Information Sources | Data Topics |
| US Census Bureau12,13 | Population growth and death rates Health insurance coverage |
| National Health Interview Survey 14 | Diabetes prevalence Diabetes detection |
| National Health and Nutrition Examination Survey 15 | Prediabetes prevalence Obesity prevalence |
| Behavioral Risk Factor Surveillance System16 | Glucose self-monitoring Eye and foot examinations Use of medications Attending diabetes self-management classes |
| Research literature | Effects of disease control and aging on onset, progression, death, and costs Direct and indirect costs of diabetes |
BASELINE MODEL BEHAVIOR
Figure 2 ▶ presents selected output generated by simulating the model through the historical period starting in 1980 and then into the future through 2050 under a set of hypothetical baseline assumptions. The model requires assumptions about the future for each of the policy-related model inputs indicated in italics in Figure 1 ▶. In the baseline scenario, we assume that no further changes occur in obesity prevalence after reaching a value of 37% in 2006 (Figure 2a ▶), and that inputs affecting the detection and control of prediabetes and diabetes remain fixed at their 2004 values through 2050. This fixed-inputs assumption is not meant to represent the project team’s forecast of what is most likely to occur to policy inputs in the future, but it does make a useful and transparent starting point for policy analysis.
FIGURE 2—
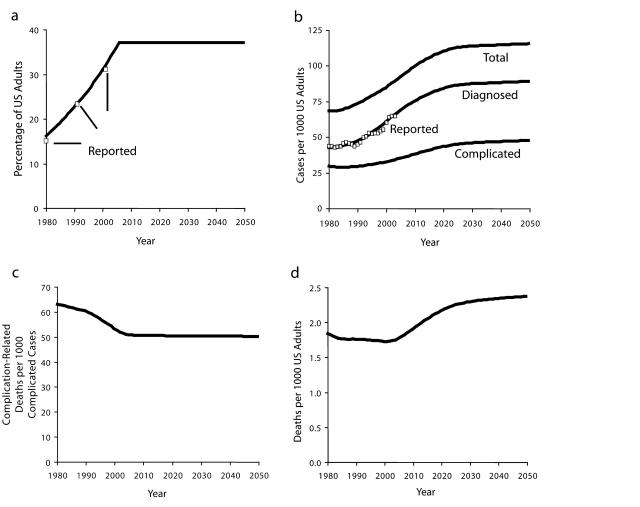
Selected baseline model output, 1980–2050, and comparison to historical data for obesity prevalence (a), diabetes prevalence (b), complication-related deaths per complicated cases (c), and complication-related deaths (d).
Note. Reported obesity prevalence based on National Health and Nutrition Examination Survey,15 and reported diabetes prevalence based on National Health Interview Survey.14 Baseline projection assumes that obesity prevalence rises to 37% in 2006 and remains fixed thereafter, and that disease detection and control efforts all remain fixed after 2004.
In addition to baseline simulation output, Figure 2 ▶ also presents historical data (Reported) on obesity prevalence in the overall population15 and diagnosed diabetes prevalence20 and shows how closely the simulated output for diagnosed diabetes prevalence lies to the latter of these time series. The model is also able to reproduce available historical data on prediabetes prevalence, the diagnosed and controlled fractions of people with diabetes, population average BMI, obese fractions of people with prediabetes and diabetes, losses in health-related quality of life because of diabetes, and the costs of both urgent/extended and preventive care of diagnosed diabetes.17
The 4 graphs in Figure 2 ▶ together tell the following story of diabetes prevalence and mortality for the historical period from 1980 to 2004 as indicated by model simulation. Two forces have worked in opposition to affect the number of diabetes-related deaths. The first force is a rise in the prevalence of obesity (Figure 2a ▶). This increase in obesity led to a greater incidence of prediabetes and diabetes through the chain of causation seen in Figure 1 ▶. Increased onset led to increased prevalence, first of uncomplicated diabetes and then of complicated diabetes (Figure 2b ▶).
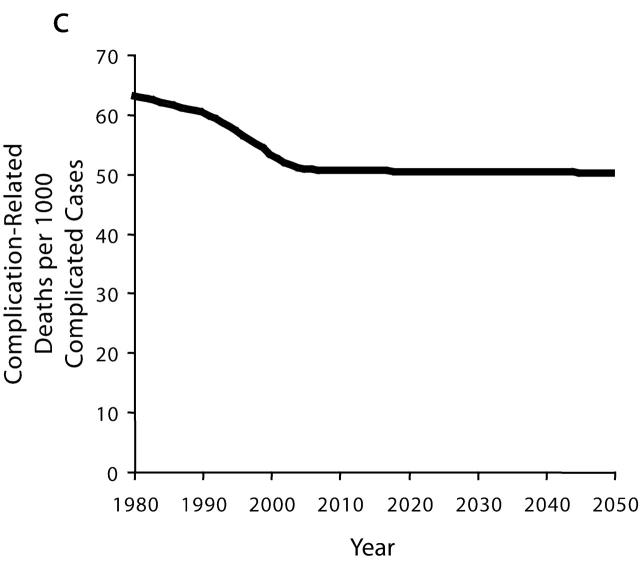
The second and opposing force is a noteworthy improvement in the control of diabetes, achieved through greater efforts to detect and manage the disease. It appears that glucose screening and clinical management of diabetes by providers, as well as self-monitoring and adoption of healthier lifestyles by people with diagnosed diabetes, all increased significantly between 1980 and 2004. For example, we estimate that the fraction of primary care physicians who periodically test blood glucose levels in their patients at high risk for hyperglycemia rose steadily from 69% in 1980 to 95% in 2004, and that such screening has been the primary driver in increasing the fraction of patients with diabetes who have been diagnosed from 62% to 74% during the same period.17 Model simulation suggests that progress on detection and management has reduced the rate at which people with diabetes move from uncomplicated to complicated diabetes, as well as the rate at which people with complicated diabetes die from the complications (Figure 2c ▶).
From 1980 to 2004, the beneficial influence of increased diabetes control managed to hold mostly in check the harmful influence of increased disease prevalence: the model indicates that per capita deaths from complications of diabetes decreased by about 5% (in fact achieving a 7% decline by 2001 before giving back some of that gain from 2001 to 2004 because of some slowing in the rate of improvement in clinical management apparent in the data16). This result occurred because although the simulated prevalence of complicated diabetes increased by 17% (Figure 2b ▶) from 1980 to 2004, the complications-related death rate for people with complicated diabetes decreased by 19% (Figure 2c ▶) during the same time period.
The baseline simulation indicates a future for diabetes prevalence and diabetes-related deaths for the period 2004–2050 quite different from the past. With obesity prevalence fixed, by assumption, at its assumed high point of 37% from 2006 onward, the diabetes onset rate would be at its high point as well, and diabetes prevalence would consequently continue to grow through 2050 (Figure 2b ▶). The rate of growth of diabetes prevalence would gradually diminish, and prevalence would become more level (from about 2025 onward) only when the outflow of deaths (because of diabetes as well as all other causes) started to catch up with the inflow of onset. The situation is comparable to the gradual filling of a bathtub that has a slow drain—in this case, the drain being deaths of people with diabetes. In fact, with the outflow of deaths being equal to only about 4% per year of the diabetes population (for example, in 2004 about 800000 deaths out of 20 million, about half of these deaths because of complications of diabetes), more than 20 years would be required—after the assumed peaking-out of obesity in 2006—for the growth in diabetes prevalence (as a fraction of a growing adult population) finally to slow to a trickle.
With the prevalence of complicated diabetes growing by 38% from 2004 to 2050 (Figure 2b ▶) and the death rate among the complicated cases declining by only 2% (Figure 2c ▶; this 2% decline reflecting some continued reduction in the undiagnosed fraction of complicated cases), deaths from complications of diabetes would increase on a per capita basis by 36% (Figure 2d ▶). Absent further improvements in disease detection, management, and control, and with obesity prevalence and diabetes onset remaining at their all-time highs, the past progress in mortality reduction would soon be undone; starting from its lowest point in 2001, the per capita complication death rate would rebound to surpass its 1980 level by 2008.
INTERVENTION TESTS
What can be done now and in the future to reduce the number of deaths associated with diabetes complications? Simulation experiments with the system dynamics model may help shed light on this question. Here we consider just 3 of many possible policy intervention scenarios that may be tested and compared with the baseline scenario. (A scenario consists of a particular set of assumptions for the future values of all time series inputs in the model.) In each of these scenarios, a single policy-related input is changed starting in 2006 and ramping up through 2012 or 2017, remaining constant thereafter. The 3 scenarios are as follows:
Enhanced clinical management of diabetes. The fraction of people with diagnosed diabetes whose providers are adequately managing their disease (doing all appropriate monitoring and adjustment of medications) is increased; specifically, this fraction is ramped up from the baseline 48% in 2006 to 67% by 2012. Real-life implementation of this strategy might involve broader adoption of clinical standards of care, better patient tracking systems, more computerized reminder systems, and greater reimbursements or other incentives for the provision of preventive clinical services.
Increased management of prediabetes. The fraction of people with diagnosed prediabetes whose providers are adequately managing their disease is increased; specifically, this fraction is ramped up from the assumed 20% in 2006 to 50% by 2012. Appropriate management of prediabetes includes monitored regimens of increased physical activity and improved diet, plus medications for control of blood glucose, blood pressure, or lipids as needed.8–10
Reduced obesity prevalence. The obese fraction of the adult population is reduced. Specifically, this fraction is ramped down from the assumed 37% in 2006 to 26% in 2017. This reduction returns obesity prevalence to where it was in about 1995. Real-life implementation of this strategy might involve consumer education, insurance reimbursements for calorie-control and physical activity programs, and working with industry and government to bring healthier foods and improved opportunities for physical activity to a broader spectrum of communities.
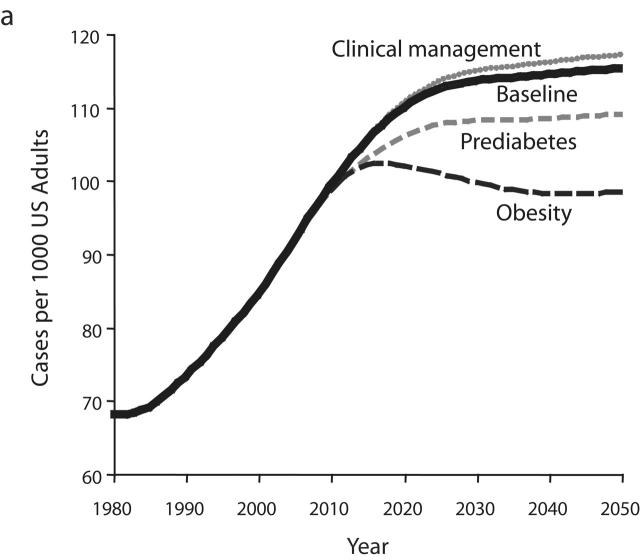
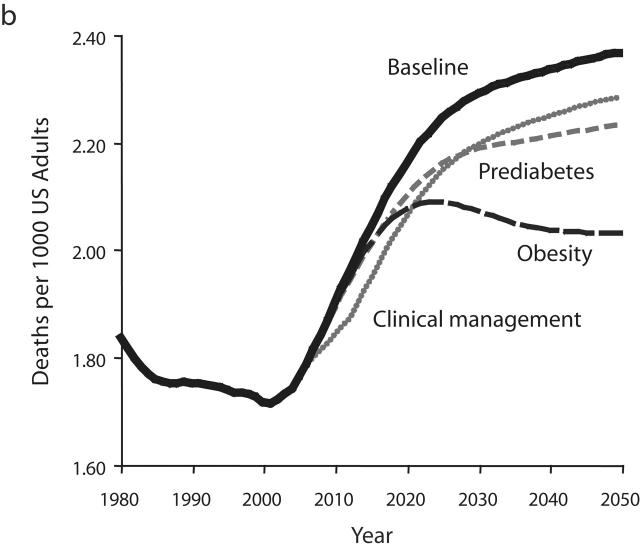
Resulting output graphs for 2 variables—total diabetes prevalence and per capita deaths from complications—are shown in Figure 3 ▶. The variables used in Figure 3 ▶ are the same as those seen previously in Figures 2b and 2d ▶ but use narrower y-axis ranges so that intervention impacts can be seen clearly. For each of the 3 intervention tests, Figure 3 ▶ shows how the intervention alters the behavior of the diabetes system from 2006 to 2050 relative to the baseline scenario.
FIGURE 3—
Model output for 3 intervention scenarios compared with the baseline scenario for diabetes prevalence (a) and complication-related deaths (b).
Enhanced Clinical Management of Diabetes
As a result of this intervention, the controlled fraction of the diagnosed diabetes population increases from 41% in 2006 to 47.5% by 2012. Increased control, in turn, immediately reduces the flow rates of diabetes progression and complications deaths. These flow-rate reductions, in turn, slow the growth in the number of diabetes-related deaths (Figure 3b ▶). Because no further improvement in clinical management is assumed to occur after 2012, and because nothing has been done to slow the growth of diabetes prevalence (Figure 3a ▶), the rapid growth in complications deaths resumes immediately after 2012. The resumed growth follows a trajectory that parallels that of the baseline scenario, actually slightly exceeding it in terms of percentage growth from 2012 to 2050. For this and any other scenario (namely, scenarios involving improved self-monitoring, medication use, or healthier lifestyles for people with diabetes) in which the proposed intervention has the sole effect in the model of increasing the fraction of diabetes patients who are controlled, the model suggests that as long as the controlled fraction is increasing, deaths from complications will grow more slowly; but after the increase in the controlled fraction ceases, deaths will resume a faster rate of growth in line with the growth in diabetes prevalence itself.
Figure 3a ▶ indicates that the intervention improving the clinical management of diabetes ultimately leads to a small but noticeable increase in the prevalence of diabetes. This is a direct reflection of the fact that deaths from complications have been reduced relative to the baseline scenario. Returning to the bathtub analogy, the outflow drain has been made smaller whereas nothing has been done to reduce the inflow. Just as the water in a bathtub with a “backed up” drain rises further than it would otherwise, one may say that the diabetes population becomes backed up when the death rate is reduced.
Increased Management of Prediabetes
As a result of this intervention, many more people with diagnosed prediabetes are effectively managed. Consequently, the per capita rate of diabetes onset decreases (by about 5%), and reduced onset then leads to reduced prevalence. From 2006 to 2050, diabetes prevalence rises by 17% under the intervention, compared with a rise of 23.5% under the baseline scenario. Although the reductions in diabetes onset and prevalence are significant, they may be less than one would expect from such a large assumed increase in effective prediabetes management. This is because the intervention does not do anything to reduce the onset of prediabetes in the first place and thus, allows a “backing up” of people in the prediabetes category. For many individuals, prediabetes management does not altogether prevent diabetes onset but, rather, just postpones it.
Although the reduction in diabetes prevalence under the prediabetes management intervention is less than one might have hoped, it is still sufficient to reduce deaths from complications, and is ultimately more effective at doing so than the diabetes management intervention described in the previous section. But it is not until after the year 2028 that per capita deaths under the prediabetes intervention begin to dip below those under the diabetes management scenario. Also, it should be noted that after 2028, although the growth in per capita deaths is less under this intervention than under the baseline or diabetes clinical management intervention scenarios, this growth in deaths does continue right through 2050. Although the growth in diabetes prevalence has been slowed under the prediabetes intervention, it has not been halted (Figure 3a ▶).
Reduced Obesity Prevalence
As a result of this intervention, onset rates for prediabetes and diabetes are reduced. Also, reduced obesity allows more recovery from prediabetes back to normal glycemic levels, and the prevalence of prediabetes thus declines. Because there are fewer people with prediabetes, and fewer of them are obese, diabetes onset declines—by 15% to 19% relative to the baseline scenario. This is enough of a decline in onset to cause diabetes prevalence to peak in 2018 and then decline continuously thereafter. Overall, diabetes prevalence rises only 5.5% from 2006 to 2050, compared with the 23.5% increase in the baseline scenario.
The peak and decline of diabetes prevalence is ultimately translated into a similar peak and decline in per capita deaths from complications. Per capita deaths under the obesity reduction scenario first dip below those under the prediabetes management scenario in 2017 and first dip below those under the diabetes management scenario in 2021. The success of the reduced obesity intervention in halting and reversing the growth of diabetes prevalence and complications deaths stands in contrast to the inability of the prediabetes and diabetes management scenarios to do so. Obesity reduction leads to a lower flow rate of diabetes onset, as in the prediabetes scenario, but also reduces prediabetes prevalence and avoids the backing-up phenomenon seen in the prediabetes scenario. The model indicates that this dual action is the key to the success of the obesity reduction intervention in stemming the growth of diabetes prevalence and deaths.
CONCLUSIONS
The analyses presented in this article indicate the sorts of insights and conclusions that one may draw from simulation experiments using the system dynamics model. In particular, such experiments can improve understanding of 4 characteristic dynamics of the simulated diabetes population: (1) obesity’s role in driving the growth of prediabetes and diabetes prevalence; (2) the “backing up” phenomenon—in which reduced outflow from a population stock causes a buildup in that stock—that may undercut the benefits of management and control efforts; (3) the inability of management and control efforts alone to reduce diabetes prevalence in the long term; and (4) the significant delays between primary prevention efforts and downstream improvements in diabetes outcomes. Simulation experiments suggest that these 4 characteristic dynamics in combination may often cause intervention impacts to look different in the short term than they do in the long term. For example, in addition to the experiments we have presented, we have also simulated strategies that represent a mix of increased diabetes management and reduced obesity prevalence. Comparing a mixed strategy to one that focuses entirely on diabetes management, the experiments suggest that the focused diabetes management scenario may quickly reduce diabetes-related complications and deaths but is less effective in the long term than the mixed strategy.
Such model-based insights may help the CDC and other organizations and individuals to identify more effective public health strategies and also to interact more effectively with one another in diabetes planning efforts. The fact that the model is an integrated tool interrelating all key dimensions of the burden of diabetes should be helpful in such endeavors. Although this article has focused on the dynamics of prevalence and deaths, the model also generates measures of morbidity and financial costs and allows one to simulate how they too may be affected in the future by alternative interventions.
The system dynamics model may also help in the setting of goals for diabetes management. Simulation experiments evaluating the national Healthy People 2010 objectives for diabetes (also see: Milstein, Jones, Homer et al., unpublished data, 2006) suggest that the specified goal for diagnosed prevalence reduction may be virtually impossible to achieve and moreover is inconsistent with other stated goals.
System dynamics modeling could also conceivably be used to integrate the effect of other chronic disease programs with diabetes prevention and control. One promising direction being pursued by the CDC is to develop a dynamic model of overweight and obesity capable of projecting plausible alternative futures, allowing an examination of a closer look at the roles of nutrition and physical activity programs. Another useful way to extend the work could be the development of separate models of hypertension and hyperlipidemia as well as explicit representation of them as risk factors (separate from obesity though certainly affected by it) in the diabetes model.
Aside from such extensions, more work remains in the refinement and testing of the existing diabetes model and in identifying alternative future scenarios and intervention strategies suitable for simulation. The model’s assumptions, embodied in its equations and parameter estimates, are continually being refined as new information and ideas come to light. We are also working to better specify the uncertainty surrounding parameter values and performing sensitivity analyses to determine the impact of this uncertainty. Even in those cases in which the impact of the uncertainty may be great enough to affect policy conclusions, modeling may contribute by helping to prioritize empirical research agendas.
In summary, system dynamics simulation modeling and experimentation help diabetes policy planners and other stakeholders to better anticipate the multiple effects of interventions in both the short and the long term.
Acknowledgments
This work was funded through the Association of Schools of Public Health Cooperative Agreement and the Center for Disease Control and Prevention’s Division of Diabetes Translation and Division of Adult and Community Health, in collaboration with the Center for Public Health Practice at the Rollins School of Public Health at Emory University, Atlanta, Ga (grant S3181).
Note. The views expressed in this article are those of the authors and do not necessarily reflect those of the funding agencies.
Peer Reviewed
Contributors A. P. Jones managed the various aspects of the modeling project, assisted with modeling, and led the writing of the article and design of the figures. J. B. Homer built the simulation model and collaborated on the writing of the article. D. A. Seville synthesized the analysis that led to model design. B. Milstein improved the scope and structure of the model. J. D. K. Essien framed and originated the study, built institutional support for it, and created the evaluation framework for it. D. L. Murphy identified the use and relevant insights of the model. All authors conceptualized ideas, framed the structure of the model, and edited drafts of the article.
References
- 1.National Diabetes Information Clearinghouse Web site. National Institute of Diabetes and Digestive and Kidney Diseases. National Diabetes Statistics. Available at: http://diabetes.niddk.nih.gov/dm/pubs/statistics/index.htm. Accessed November 30, 2005.
- 2.US Public Health Service. Healthy People 2010. Washington, DC: US Dept. of Health and Human Services; 2000. Available at: http://www.healthypeople.gov/document. Accessed January 26, 2005.
- 3.Sterman JD. Business Dynamics: Systems Thinking and Modeling for a Complex World. Boston, Mass: Irwin/McGraw-Hill; 2000.
- 4.Harris MI. Classification, diagnostic criteria, and screening for diabetes. In: National Diabetes Data Group, ed. Diabetes in America. 2nd ed. Bethesda, Md: National Institutes of Health; 1995: 15–35.
- 5.Kahn R, Genuth S, Expert Committee on the Diagnosis and Classification of Diabetes Mellitus. Follow-up report on the diagnosis of diabetes mellitus. Diabetes Care. 2003;26:3160–3167. [DOI] [PubMed] [Google Scholar]
- 6.Diabetes Control and Complications Trial Research Group. The effect of intensive treatment of diabetes on the development and progression of long term complications in insulin dependent diabetes mellitus. N Engl J Med. 1993;329:977–986. [DOI] [PubMed] [Google Scholar]
- 7.UK Prospective Diabetes Study Group. Tight blood pressure control and risk of macrovascular and microvascular complications in type 2 diabetes. Lancet. 1998;352:703–713. [PMC free article] [PubMed] [Google Scholar]
- 8.Diabetes Prevention Program Research Group. Reduction in the incidence of type 2 diabetes with lifestyle intervention or metformin. N Engl J Med. 2002;346:393–403. [DOI] [PMC free article] [PubMed] [Google Scholar]
- 9.American Diabetes Association and National Institute of Diabetes and Digestive and Kidney Diseases. The prevention or delay of type 2 diabetes. Diabetes Care. 2002;25:742–749. [DOI] [PubMed] [Google Scholar]
- 10.Bowman BA, Gregg EW, Williams DE, Engelgau MM, Jack L Jr. Translating the science of primary, secondary, and tertiary prevention to inform the public health response to diabetes. J Public Health Manage Practice. 2003; S8–S14. [DOI] [PubMed]
- 11.Honeycutt AA, Boyle JP, Broglio KR, et al. A dynamic Markov model for forecasting diabetes prevalence in the United States through 2050. Health Care Management Science. 2003;6: 155–164. [DOI] [PubMed] [Google Scholar]
- 12.Statistical Abstract of the United States: 2002. Washington, DC: US Census Bureau; 2003. Available at: http://www.census.gov/prod/www/statistical-abstract-02.html. Accessed January 26, 2005.
- 13.US Census Bureau Web site. Historical Health Insurance Tables. Available at: http://www.census.gov/hhes/hlthins/historic/hihistt7.html. Accessed January 26, 2005.
- 14.Centers for Disease Control and Prevention, National Center for Health Statistics Web site. National Health Interview Survey (NHIS). Available at: http://www.cdc.gov/nchs/nhis.htm. Accessed January 26, 2005.
- 15.Centers for Disease Control and Prevention, National Center for Health Statistics Web site. National Health and Nutrition Examination Survey (NHANES). Available at: http://www.cdc.gov/nchs/nhanes.htm. Accessed January 26, 2005.
- 16.Centers for Disease Control and Prevention, Behavioral Risk Factor Surveillance System Web site: Prevalence Data and Trends Data. Available at: http://www.cdc.gov/brfss. Accessed January 26, 2005.
- 17.Homer J, Jones A, Seville D. Diabetes System Model Reference Guide. Hartland, Vt: Sustainability Institute; 2004. Available at: http://sustainer.org/pubs/diabetessystemreference.pdf. Accessed May 28, 2005.


