

Abstract
In 1975, New York City experienced a fiscal crisis rooted in long-term political and economic changes in the city. Budget and policy decisions designed to alleviate this fiscal crisis contributed to the subsequent epidemics of tuberculosis, human immunodeficiency virus (HIV) infection, and homicide in New York City.
Because these conditions share underlying social determinants, we consider them a syndemic, i.e., all 3 combined to create an excess disease burden on the population. Cuts in services; the dismantling of health, public safety, and social service infrastructures; and the deterioration of living conditions for vulnerable populations contributed to the amplification of these health conditions over 2 decades.
We estimate that the costs incurred in controlling these epidemics exceeded $50 billion (in 2004 dollars); in contrast, the overall budgetary saving during the fiscal crisis was $10 billion. This history has implications for public health professionals who must respond to current perceptions of local fiscal crises.
IN THE 1980S AND EARLY 1990S, New York City experienced epidemics of tuberculosis (TB), human immunodeficiency virus (HIV) infection, and homicide. Although each of these has unique determinants and each affects people worldwide, in New York City the 3 epidemics played out in a specific geographic, temporal, and political context; affected similar populations; and together contributed to a public health crisis.1–3
HIV infection, TB, and homicide constituted a syndemic that affected New York City from the late 1970s to the mid-1990s. A syndemic has been defined as 2 or more epidemics, with biological determinants and social conditions interacting synergistically, that contribute to an excess burden of disease in a population.4,5 We used journalistic accounts and government reports, as well as recent epidemiological and economic analyses, to examine how budget and policy decisions made in New York City in the 1970s contributed to the increasing incidence of TB, HIV infection, and homicide during the 1980s and 1990s. Municipal, state, and federal policy and budget decisions in the late 1970s and early 1980s determined the severity of the syndemic and contributed to tens of thousands of preventable deaths and illnesses. Ultimately, it cost New York City tens of billions of dollars to deal with the consequences of these budget cuts. We hoped that an examination of this chapter of the city’s history and the longer-term social and economic costs of the policy decisions made in that era would yield lessons that could guide the public health response to future municipal fiscal crises.
MUNICIPAL RESPONSE TO THE 1975 FISCAL CRISIS
Beginning in 1975, a fiscal and political crisis left New York City without the resources to pay its operating expenses or the ability to borrow money from public credit markets, banks, or the federal government. This fiscal crisis was rooted in global economic changes (a worldwide recession and oil shortages); federal, state, and city fiscal and tax policies that failed to generate the resources needed to support growing demands for services; and demographic and political changes in New York City that left the city with less wealth and more need.6–9 The precipitating event was a decision by NYC bankers to stop lending money to the city,10,11 a move that could have caused the city to default on its outstanding loans and declare bankruptcy. The mayor then turned to the federal government for help but was turned down, in part because many in Washing-ton viewed New York City as a profligate spender that coddled its poor.9 In urging President Ford to reject Mayor Beame’s request for financial assistance, Treasury Secretary William Simon stressed the political dimensions of his recommendation. Any assistance, he said, should be on terms “so punitive, the overall experience made so painful, that no city, no political subdivision would ever be tempted to go down the same road.9(p259)
To avert bankruptcy and restore stability, city and state officials appointed a group of businessmen, bankers, and city officials to serve as an Emergency Financial Control Board (EFCB). The primary goal of the EFCB was to balance New York City’s budget so that the city could again borrow money from public credit markets. To achieve this goal, the EFCB mandated cuts in city services and reductions in the city workforce, the transfer of some municipal responsibilities to state government, and tax increases. In 1975, the city’s budget was about $13 billion. The EFCB asked the city to cut $200 million in spending, approximately 6% of its operating expenses, each year for 3 years. However, because of federal and state mandates for entitlement programs, debt services, and other fixed costs, the city had control over and could make cuts from only about a quarter of its budget.12 As a result, sectors dependent on discretionary tax levy funds experienced reductions much larger than 6%.
Agencies with health responsibilities were particularly hard hit. Between 1974 and 1977, the Department of Health (DOH) budget was cut by 20%,13 and by 1977 the department had lost 1700 staff members—28% of its 1974 workforce. To achieve these reductions, the department closed 7 of 20 district health centers, cut $1 million from its methadone program, terminated the employment of 14 of 19 health educators, and closed 20 of 75 child health stations and 6 of 14 chest clinics (the units responsible for TB screening and diagnosis).13
At the Health and Hospitals Corporation (HHC), the agency that operates municipal hospitals, the city payroll was cut by 17% between 1975 and 1978. Between 1975 and 1980, the number of beds in HHC facilities fell by 16% and the number of days of care provided dropped by 23%.14 In 1975, HHC closed all 50 of its community-based clinics to help meet a mandated budget cut.15 In the following years, the EFCB and the mayor’s budget office gained increased control over the public hospital’s operations and fired the hospital director who spoke out against budget cuts. Between 1975 and 1985, the proportion of the HHC budget covered by the city decreased from 40% to 27%.14(pp333–335)
In 1967, in response to the city’s growing heroin epidemic, Mayor John Lindsay had created a municipal agency directly responsible for substance abuse treatment, the Addiction Services Agency, and rapidly expanded treatment capacity.16 Between 1971 and 1973, New York City increased its census of methadone patients by 170%, from 19 900 cases to 34 000,17 and significantly decreased waiting time for treatment. In those 2 years, drug arrests, complaints to the police about burglary and grand larceny, and reported cases of serum hepatitis all fell significantly,17 suggesting (although not proving) that increases in availability of drug treatment contributed to these outcomes.
However, in 1976, the city eliminated the Addiction Services Agency and transferred its reduced staff to the city health department.13 City officials estimated these cuts would save the city $10 million and the state and federal governments an additional $40 million.18 In 1977, New York City ended its involvement in substance abuse treatment by transferring responsibility to the state Office of Alcoholism and Substance Abuse Services. Over the next decade, expansion of New York City’s drug treatment capacity stagnated.
City agencies that affected health indirectly were also cut. The police department lost 20% of its workforce, eliminated the youth unit and the organized crime squad,7 and cut the narcotics squad by 33%.19(p6) The budget for the special narcotics prosecutor was cut from $2.4 million in 1975 to $1.1 million in 1976.19(p6) In 1972, the New York City police force numbered 31 000; by 1980 it had shrunk to 22 000.19(p7)
The cumulative effect of these cuts significantly reduced the scope of municipal services. In the 7 years before 1975, city spending had risen 30% in real dollars; in the next 7 years it fell by 33%.10 These reductions in the scope of government sent an important political message. Felix Rohatyn, an investment banker and a chief architect of the EFCB, noted that as a consequence of the cuts in municipal services, “the direction and philosophy of a large unit of government were fundamentally and permanently changed as a result of the involvement (some would say intrusion) of the private sector in government.”20(p157)
In 1981, New York City was able to reenter the public credit market,21 and all subsequent city budgets have met the legal requirement for a balanced budget. In 1984, municipal operating expenses were 15.9% lower and capital expenses 56% lower than in 1975, after adjustment for inflation.6(p138)
FEDERAL BUDGET DECISIONS
Beginning in the mid-1970s but especially after the election of a conservative president in 1980, the federal government also initiated a series of budget, tax, and social policy decisions that adversely affected the population of New York City and other cities. For example, by 1982 federal support for low-income housing had all but ended,22 and federal funding for urban development and public health problems such as TB, sexually transmitted infections, and mental health was reduced and consolidated into “block grants,” that gave states the flexibility to shift resources into more politically popular programs.23 General revenue sharing was ended in 1985, and between 1980 and 1990 federal support for the Community Development Block Grant program, an important source for economic and infrastructure support for low-income neighborhoods, was slashed from $6.1 to $2.8 billion.24 Generous tax cuts for the wealthy and big increases in military spending further reduced federal resources for health and social problems and contributed to a political climate that favored shrinking government.25 As new problems such as AIDS, crack addiction, and a rising rate of homicide emerged, state and local governments were increasingly unable to turn to the national government for help. The lessons that Treasury Secretary Simon and banker Rohatyn had hoped to teach had taken hold.
CHANGES IN LIVING CONDITIONS
As a result of broader social and economic changes such as deindustrialization and loss of manufacturing jobs, suburbanization, 2 economic recessions,26–28 and the previously described municipal and federal policy decisions, living conditions for the city’s low-income population deteriorated significantly. Between 1970 and 1980, the number of poor people in New York City increased by 20% even as the city’s population declined by 10%.29 Arson and other fires, gentrification, suburbanization, and landlords’ abandonment of buildings contributed, in different ways, to the displacement of nearly one quarter of the city’s population.2,30
Job losses and cuts in public benefits combined to reduce family income, and housing costs increased. By 1980, a freeze on public assistance imposed by the New York State legislature in 1975 had reduced the inflation-adjusted value of the average welfare grant by 50%,31 affecting the nearly 1 million city residents dependent on welfare. Between 1970 and 1976, New York City lost 468 000 manufacturing jobs32; in the public sector, by 1980, EFCB-mandated layoffs and attrition had eliminated 1 in 5 city jobs,31 severely constricting 2 paths out of poverty. In 1981, the Wall Street Journal lamented,
Basic city services, once the model for urban areas across the nation, have been slashed to the point of breakdown. Evidence of the cutbacks is everywhere: The streets are blanketed with garbage. Robberies, to name one crime, are at an all-time high. The subway system is near collapse, plagued by aging equipment, vandalism, and frequent breakdowns and derailments.7(p42)
This deterioration contributed to “White flight” to the suburbs, corporate decisions to relocate outside New York City, and loss of tourism, further depriving the city of the tax revenues needed to combat its health and social problems.
POLICY, TB, HIV INFECTION, AND HOMICIDE
Tuberculosis
TB rates in New York City began to rise in 1978 and did not fall until 1993. Between 1978 and 1992, TB rates in New York City went up every year after almost a century of decline, a resurgence that Paolo and Nosanchuk36 estimated led to 52 000 excess TB cases. Budget cuts played an important role in the resurgence of TB. During the fiscal crisis, the DOH cut its TB control program by closing district health centers, chest clinics, and the city TB hospital.37 Fewer facilities, less staff, and overburdened hospitals led to poorer control of TB. Brudney and Dobkin37 reported that in 1988, 89% of patients discharged from Harlem Hospital, which served the district with the city’s highest TB rates, were lost to follow-up or failed to complete treatment. Concomitantly, New York City experienced a subepidemic of multidrug-resistant TB, which increased from 10% of reported cases in 1983 to 23% in 1991.36
Contributing to the resurgence of TB were the fiscal crisis reductions in safety-net programs such as public assistance and Medicaid and the post-1980 reductions in federal support for low-income housing that pushed many people into homelessness.38 Between 1982 and 1992, the city’s homeless population grew from 7584 to 23 494,36 forcing many people into the city’s homeless shelters and jails, settings associated with TB transmission.39,40 Earlier cuts in hospital services led to overcrowded and understaffed hospitals, which also contributed to TB transmission.41
Finally, the HIV/AIDS epidemic also coincided with TB resurgence. The combination of an increase in the number of HIV-infected people whose compromised immunity made them more vulnerable to reactivation of TB and to new infection36 and the rise in overcrowded living conditions that increase the probability of airborne infection illustrates the link between biological and social factors that is characteristic of a syndemic.4
HIV Infection
Most researchers believe that HIV infection first appeared in New York during the 1970s and spread rapidly among men who had sex with men and injection drug users, first, and then, throughout the 1980s, to the wider sexual and drug networks of these populations.42,43 AIDS cases, which lag behind initial infection with HIV by 8 to 10 years, peaked in 1993, then dropped sharply, in part because newly available antiretroviral treatments delayed the onset of AIDS for those who received these treatments.44 By the late 1980s, it was estimated that about 200 000 New York City residents were infected with HIV.43(p132)
How did fiscal crisis policies contribute to the spread of HIV infection? In New York City, 41% of AIDS cases were related to injection drug use, compared with 25% nationally,45 making the city’s response to drug addiction especially important. The most significant decision was to turn over responsibility for drug treatment to a state government that historically had been indifferent to the social problems of New York City.46(p562) In creating the Addiction Services Agency to counter substance abuse, the city government recognized that New York City faced a unique drug problem and needed to act to meet this threat. Dismantling that agency in the midst of a heroin epidemic compromised the city’s capacity to respond effectively for decades to come.
Between 1971 and 1974, 145 577 individuals were first reported to New York City’s Narcotics Register, more than double the numbers added between 1964 and 1967.47 Yet in the following years, the treatment capacity needed to serve this cohort of new addicts was not developed. By 1985, there were 250 000 drug addicts in New York City, of whom 30 000 were in treatment and 1500 on waiting lists for treatment.48 In that year, New York City Health Commissioner David Sencer called drug abuse “the main health problem in the city today” and warned that little could be done to stop the spread of AIDS among drug addicts.48 Yet in 1986 and 1987, only 23 057 drug users were treated in state-funded drug treatment programs in New York City.47 By the early 1990s, the number admitted to New York City drug treatment programs more than doubled to 50 805.47 However, by that time, it is estimated, more than 100 000 New York City injection drug users were already infected with HIV.42 As late as 1990, the New York State Office of Substance Abuse Services estimated that only 42 000 treatment slots were available for the city’s 500 000 drug abusers.49
By the mid-1970s, the relative efficacy of methadone in reducing drug use and associated criminal activity had been established.50 Later research showed that participation in methadone maintenance programs or harm reduction programs also decreased new HIV infections substantially.51–53 New York City focused almost all its limited resources on methadone programs and failed to expand the capacity or improve the infrastructure of its drug treatment system. Unfortunately, methadone is ineffective in treating crack addiction. When the crack epidemic arose in the mid-1980s, further increasing the transmission of HIV infection,54 the city was ill-equipped to respond. Again, both broader factors, such as the growing globalization of the drug trade and lower drug prices, and more local factors, such as the breakdown of community networks that can protect against drug use, contributed to the spread of drug addiction.
Other decisions made during the fiscal crisis contributed to inadequate HIV prevention services. Because most of its health educators were laid off in 1975, the DOH lacked a mechanism to communicate health information effectively and credibly. In the city’s gay communities, nonprofit organizations quickly emerged to take on HIV prevention, but in the city’s low-income minority communities, it took the DOH more than a decade to establish a network of AIDS educators—an interval during which HIV transmission proceeded rapidly.55
Cuts in school health services delayed the establishment of effective school-based HIV programs. Between 1970 and 1980, the city cut physicians’ hours in city schools by 84%, cut nurses’ hours by more than 50%,56 and reduced the number of health education teachers. At the time when New York City’s school children could have most benefited from comprehensive health, sexual, and substance abuse education and services, schools lacked the resources to provide them. New York City did not implement a comprehensive school-based HIV prevention program until 1992.
Comprehensive primary and preventive care can help enable early identification of HIV, prompt treatment of other sexually transmitted infections that facilitate HIV transmission, and establishment of patient–provider communication that increases early diagnosis, adherence to prescribed medications, and appropriate referrals.57 The cuts in DOH and HHC clinics and health centers diminished opportunities for these services, especially in the poorest communities, where HIV was spreading most rapidly.
Homicide
Homicide rates rose in New York City in the late 1970s and began to decline in 1991, finally falling below the 1975 level in 1993. Between 1975 and 1993, a total of 26 980 New Yorkers were victims of homicide. Among the factors that may have contributed to the increase were the 20% reduction in the size of the New York City Police Department, the lower morale within the police department, and the dismantling of special units such as the narcotics squad. In 1980, for example, felony complaints rose by 16% and felony arrests fell by 5.5%.19 The relationships between policing and crime are complex, but the dismantling of substantial portions of the police department without implementation of other public safety programs contributed to a cycle of escalating crime and decreasing community capacity to control criminal behavior.
Most observers agree that the development of crack cocaine in the early 1980s contributed significantly to the increasing level of violence in New York City.58,59 Crack use spread quickly in the homeless shelters. In addition, high rates of youth unemployment caused by the recession of the early 1980s and federal cuts in job training programs provided the crack industry with a ready, willing, and able marketing force of young people. Cuts in youth and job training programs put more young people on the street, where they were more vulnerable to the street culture of crime and violence. By the mid-1980s, crack was available on many low-income street corners, which dealers would protect using high-caliber automatic weapons to discourage competition, further contributing to the violence.60,61
In summary, a variety of policy decisions made during the fiscal crisis and thereafter contributed to the TB, HIV, and homicide syndemic that peaked in the mid-1990s (Figure 1 ▶). The actions taken to achieve a structural adjustment of the city’s budget by balancing revenues and expenses had the unintended consequence of imposing new burdens on the city’s poorest residents. Although each of the 3 epidemics had its own dynamics, city, state, and federal decisions about drug treatment, primary health care, and housing worsened all 3, and the policy-driven deterioration in living conditions expanded the size of the populations most vulnerable to these health problems.
FIGURE 1—

Incidence of tuberculosis (TB), AIDS, and homicide in New York City (NYC) from 1970 to 2002, and relative timing of the New York City’s financial crisis and federal budget cuts (box).
Note. Data for TB obtained from NYC Department of Health and Mental Hygiene, Bureau of Tuberculosis Control.33 Data for AIDS obtained from HIV Epidemiology Program, New York City Department of Health and Mental Hygiene.34 Data for homicide obtained from Langan and Durose.35
Data for TB, AIDS, and homicide were scaled by 1985 (median year of interval of interest) incidence rate for ease of comparison. Therefore, the y-axis represents the incidence rate for a given year compared with the 1985 incidence rate; a y-axis measure of more than 1 suggests incidence higher than 1985, and a measure of less than 1 suggests lower incidence than 1985.
ECONOMIC COSTS OF THE SYNDEMIC
In the last half of the 20th century, public health economists applied principles of neoclassical theory linking population health and economic productivity62,63 to develop cost-of-illness methodologies. These multidisciplinary methods are used to measure economic consequences of illness in society.64–69 On the basis of this literature, we extended our analysis of the New York City syndemic to obtain a partial estimate of its cumulative economic consequences. We obtained an indication of the order of magnitude of the syndemic’s economic burden to society70–73 by applying published cost-of-illness estimates developed during the New York City syndemic to the incidence rates illustrated in Table 1 ▶.
TABLE 1—
Summary Cost-of-Illness Estimates for HIV, AIDS, Homicides, and Tuberculosis (TB), in 2004 Dollars: New York City, 1979–1999
| Conditiona | Total Cases | Excess Cases | Total Excess Medical Expenditures $1000sb,c | Productivity Loss, $ | Economic Value of Quality of Life Lost $1000s | Total, $1000s |
| AIDS/HIV (through 1995) | ||||||
| PWAs | 41 623 | 8325 | 1 812 738 | NA | NA | 1 812 738 |
| AIDS Deaths | 51 783 | 10 357 | 2 262 673 | NA | 31 069 800 | 33 332 473 |
| HIV Subtotal | 50 000 | 10 000 | 666 188d | NA | NA | 666 188 |
| AIDS only | 93 406 | 18 681 | 4 075 412 | NA | 31 069 800 | 35 145 212 |
| HIV+AIDS | 143 406 | 28 681 | 4 741 600 | NA | 31 069 800 | 35 811 400 |
| Homicides (1979–1993) | 26 890 | 3265 | 110 709 | 4 861 257 | 12 712 010 | 17 683 976 |
| Tuberculosis (1979–1999) | 47 105 | 10 717 | 498 512e | NA | NA | 498 512 |
| Total | 5 350 821 | 54 660 076 | ||||
aData for TB obtained from New York City Department of Health and Mental Hygiene, Bureau of Tuberculosis Control.33 Data for AIDS obtained from HIV Epidemiology Program, New York City Department of Health and Mental Hygiene.34 Data for homicide obtained from Langan and Durose.35 Not all conditions use the same time span.
bSources for cost of illness estimates: for AIDS, see Hellinger,76,77 and Freedberg.81 For homicides, see Miller75 and Rice.78 For TB, see Brown79 and Frieden.80
cCost of illness estimates updated using New York/New Jersey regional Consumer Price Index and the Medical Care Component of the Consumer Price Index, Bureau of Labor Statistics, 2005. Additional details regarding cost updating are presented in Technical Appendix A, available from the author.
dHIV cost of illness estimates are updated and modified from Hellinger’s estimates to include changes in the standards of care from no antiretrovirals or ziduvudine monotherapy from 1987–1991 to HIV prophylaxis which included combination antiretroviral medications. We chose the most conservative economic estimate of prophylaxis combination therapy, Trimethoprim-sulfamethoxacaole and Azithromycin. We did not include Fluconazole nor the highly costly Gangciclovar. Thus our estimates are likely highly conservative. While HIV prophylaxis changed after Hellinger’s study, survival was not yet significantly affected, so we did not make survival modifications to Hellinger’s study.
eWe used national estimates through 1988, and used New York city-specific cost data from 1989 on, to reflect highly resource-intensive directly-observed therapy practices in effect.
Our economic estimates for TB and HIV infection included the direct costs associated with treating that proportion of illness represented by the post–fiscal crisis increase in rates. For deaths because of homicide and AIDS, we included the economic value attributed to lost life.74,75 Our estimates were based on economic cost-of-illness studies using nationally representative samples.75–79 When possible, we adjusted for temporally specific New York City differences, using published sources. For instance, to better reflect the way in which New York City used resources during the TB epidemic, we adjusted national cost estimates to take into account the increased expenditures for TB cases resulting from directly observed therapy in New York City.80 For HIV, we adjusted drug costs to take into account the new antiretroviral therapies that began to become available in the early 1990s.81 We adjusted all estimates to 2004 dollars, using the medical services component and the New York regional component of the US consumer price index for urban wage earners.82
For TB, we considered cases reported between 1979, the year TB incidence began to rise, and 1999, the year it fell below the 1978 rate. In these 20 years, 47 105 new cases of TB were reported in New York City. Had the TB incidence rate observed between 1974 and 1978 persisted, an estimated 10 717 fewer cases would have been reported. We calculated the costs of these cases, a conservative estimate: had the TB rate continued to decline after 1978 as in previous decades, an estimated 20 000 to 52 000 cases would have been averted.36,80
For homicide, we considered the number of deaths between 1979, the year rates began to increase sharply, and 1993, the year they returned to the 1978 level. In this interval, 26 890 people were murdered, 3265 more deaths than would have occurred had the homicide rate in the 1974 through 1978 period persisted.
Because HIV infection arose in New York City at about the same time as the fiscal crisis,43 we could not attribute a specific component of illness to the social climate of that period by comparing pre– and post–fiscal crisis AIDS case rates. Therefore, we used published estimates of the proportion of cases that could have been averted had robust prevention programs been established in the early 1980s, when AIDS was first recognized as an epidemic. Reports reviewing the efficacy of HIV prevention interventions in the United States have shown that participation in drug treatment programs is associated with a 17% to 78% reduction in HIV prevalence,52 and a recent international review suggests that “expanded” responses to the HIV epidemic can avert 60% to 69% of new cases.83 We conservatively estimated that a citywide effort to expand drug treatment and harm reduction services, improve access to primary care and treatment of sexually transmitted infections, and provide more aggressive HIV prevention services might have averted 20% of the overall HIV infections and AIDS cases in New York City between 1976 and 1995.
According to the DOH, at the end of 1995, 51 783 New York City residents had died of AIDS, 41 623 were estimated to be living with AIDS,84 and about 50 000 were HIV infected but had not yet been diagnosed with AIDS.85 Thus, we estimate that by the end of 1995, 10 357 AIDS deaths, 8325 AIDS cases, and 10 000 HIV infections could have been averted.
Applying our cost-of-illness estimates associated with these conditions, and using our conservative estimates of excess burden of morbidity and mortality, we calculated that the excess diagnosed and suspected TB cases following the New York City fiscal crisis incurred just under $500 million in direct medical costs. The higher estimates of excess cases would yield direct medical costs ranging from more than $900 million (by Frieden et al.’s estimate80) to about $2.4 billion (by Paolo and Nosanchuk’s estimate36).
We estimated the direct costs, lost productivity costs, and lost-quality-of-life costs for the 3265 excess homicides to be $17.7 billion. For HIV and AIDS, the direct costs were $2.3 billion for preventable deaths, $1.8 billion for preventable cases living with AIDS, and $666 million for preventable cases of HIV infection—a total of $4.7 billion. Adding the economic value of loss of life only for AIDS deaths during our period of study adds another $31 billion to the AIDS costs. (A detailed description of our methods is available from the corresponding author.)
In summary, the costs of the excess cases of TB, the excess homicides, and the potentially preventable cases of HIV/AIDS that occurred after the New York City fiscal crisis ranged from $54.7 billion to more than $160 billion, depending on the definition of “excess” cases. In comparison, spending cuts between 1976 and 1983, when spending began to increase again, saved the city $9.9 billion (in 2004 dollars) over what it would have spent had it continued spending at the 1976 level. Thus, the costs of excess TB and homicide and preventable HIV infection alone were 5 to 15 times greater than the total dollar savings in city expenditures during the fiscal crisis.
LIMITATIONS
Several caveats are in order. First, the study of complex health problems with multiple causes seldom allows assignment of definitive causality or quantification of the burden of disease attributable to any one factor. The very concept of syndemics argues against singular causes.4 Thus, not all “excess” or avertable TB cases, homicide deaths, or HIV/AIDS cases that occurred during and after the fiscal crisis can be attributed specifically to policy decisions made during that period. Rather, we believe that the fiscal crisis policies precipitated a cascading series of events that made the TB, homicide, and HIV epidemics much worse than they would have been had other policy decisions been made. Other secular trends not directly tied to the fiscal crisis, including deindustrialization,26 “planned shrinkage” of municipal services,2,32 and complacency about infectious diseases55 also contributed to the syndemic.
Second, in modifying the major cost-of-illness studies that served as background for our estimates,75–77,79 we used assumptions that erred on the conservative side. In other ways, however, our cost estimates may incorrectly attribute illnesses to the climate of the fiscal crisis rather than to some other cause. Similarly, although we believe that the combination of improving economic conditions and targeted public interventions ultimately led to the control of the TB, homicide, and HIV infection epidemics in the later 1990s, we cannot rule out other causes as well.
Third, we have not attempted to calculate all the costs of the New York City fiscal crisis. Other major costs include the declines in economic growth and tourism as a result of the negative perceptions of New York City in the post–fiscal crisis era,86 the adverse impact that the budget cuts had on the New York City school system,87 and the costs of housing displacement as a result of fires exacerbated by reductions in fire services.88 Thus, our estimates of the economic consequences of the fiscal crisis describe only a portion of its full costs.
CONCLUSION
Obviously, many factors contributed to the city’s health crises of the 1980s.1,55,80,89,90 We have focused on the role of public policy because unlike social and economic trends, which appear difficult to change in the short or middle run, policies can and do change. Identifying the types of decisions that harmed health in the past may make it possible to advocate different approaches in the future. Similarly, examining policies that contributed to several adverse health outcomes—in this case the TB, HIV, and homicide syndemic—may make it possible to suggest more efficient approaches to policy advocacy and to frame policy messages that resonate in the current political climate. As city, state, and federal governments again face deficits and propose deep cuts in services,91,92 it seems particularly urgent to avoid a repetition of the 1975 decisions that so damaged New York City’s health.
Our historical health impact assessment93 demonstrates several pathways by which these policy decisions exacerbated the syndemic. First, city, state, and federal budget cuts diminished the public health, public safety, medical, and social service infrastructures that respond to health emergencies, compromising their ability to respond effectively to emerging threats such as HIV infection and crack addiction. Second, the cuts led to reductions in services such as drug treatment, preventive clinical services, health education, and policing and thus contributed to increases in TB, HIV infection, and homicide. Third, these policy decisions amplified other trends that were pushing vulnerable populations such as the homeless, drug users, the incarcerated, single mothers, and the unemployed into living situations that put them squarely in the path of TB, HIV infection, and violence. With the benefit of hindsight, it appears evident that more prudent fiscal and social policies could have saved the lives of tens of thousands of New Yorkers as well as billions of taxpayer dollars.
What made dedicated and well-trained public health professionals participate in the dismantling of vital services? Most felt that they had no choice. Elected officials ordered agency heads to make cuts. When the head of the public hospital system resisted, he was fired.94,95 As Brash11 has explained, the discourse of fiscal crisis, created in New York City in the 1970s, proved to be a powerful tool for making cuts seem inevitable and resistance futile, even irresponsible. Whereas some advocates and health professionals did resist the EFCB’s prescriptions, their efforts were short-lived and mostly ineffective.9,11
One lesson from this historical analysis is that health advocates may need to challenge the discourse of fiscal crisis directly. In 1975, New York City and other cities did face real problems, but the decision to impose the highest costs on the most vulnerable populations was a political decision. Alternative solutions included looking for additional revenue, such as from city income tax increases or financial service surcharges; transferring some costs to higher, richer levels of government; and imposing a moratorium on interest on loans to the city. These options would have presented different economic, political, and health costs and benefits. Had advocates been more successful in forcing consideration of these options, the human costs of the fiscal crisis could have been reduced.
Perhaps the principal lesson is that if the public health community is to advocate effectively against budget and policy decisions that damage health, it will need to identify constituencies that can bring new clout into the political arena. In the late 19th and early 20th century, progressive movements, labor unions, and wealthy reformers often worked together to improve living conditions and health, in part because sectors of the elite believed such reforms enhanced stability and promoted growth. In 1975, such alliances were not strong enough to resist the EFCB’s plan.9,11 A key challenge for health advocates today is to create broad coalitions that have the will and power to resist policies and budgets that can damage health.
Another lesson may help public health professionals join the current debate on the roles of government and markets in responding to social problems. New York City’s fiscal crisis spurred the call for allowing market forces to solve social problems. Yet as the syndemic unfolded, it was the government, not market forces, that ultimately contained TB, homicide, and AIDS. TB rates began to drop in 1993 after a comprehensive DOH campaign that cost more than $1 billion.80 Beginning in 1991, New York City began to rebuild its police force, and by 1999, the city had almost double the number of police officers employed in 1980. Homicide rates started to fall in 1991, and by 1995 they had dropped below the 1970 level. Many factors contributed to the decline in homicide,90 but it seems likely that increased police presence was one. New cases of AIDS started to decline in 1993 after city, state, and federal programs, including the Ryan White HIV CARE Act and CDC prevention programs, made HIV prevention and new treatments available to populations hardest hit by the epidemic.44 Once again, federal policy and broader economic changes, such as the economic prosperity of the 1990s and the growth of job opportunities in the service sector, amplified the impact of local policy decisions, although this time in a salubrious direction.
The story of the public health consequences of the New York City fiscal crisis is a cautionary tale about the value of health impact assessment. In hindsight, it seems evident that freezing drug treatment programs and cutting the narcotics squad during a surge in heroin use, cutting TB services even after new cases had started to increase, and failing to act decisively against the burgeoning HIV epidemic could damage public health. It appears that because there was no mechanism that required an assessment of the impact of proposed policies and budgets on health, public officials did not adequately consider the costs and benefits of their actions. The pre-cautionary principle suggests that public health officials have an obligation to ensure that new policies are safe rather than to count bodies after the changes have been implemented.96
This history illustrates that budget and policy decisions have long-term and systemic consequences. It took almost 2 decades for the adverse health consequences of the fiscal crisis decisions to play out. Most elected officials do not consider the consequences of their actions beyond the election or the budget cycle. If public health professionals want to avoid future complicity in implementing health-damaging policies, we will need to find new ways to engage the public in making decisions about health.
Figure 2.
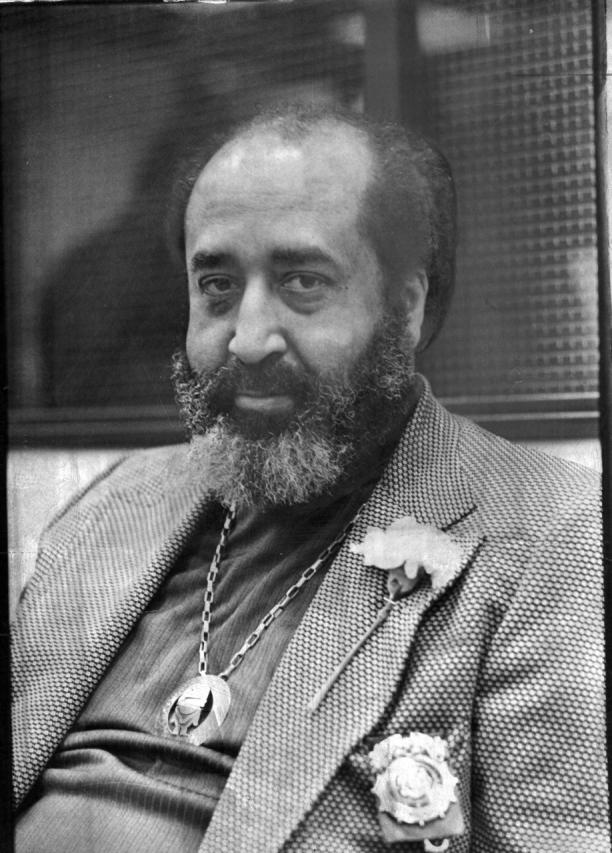
John L. Holloman Jr, MD, president of New York City Health and Hospitals Corporation from 1974 to 1976. In 1976, Holloman said, “I’m going to stay and fight this out. They’re trying to balance the budget on the backs of the poor.” A few months later he was fired.
Reprinted with permission from the New York Times, October 21, 1976.
Figure 3.

Workers at Bellevue Hospital, a New York City public hospital, protesting budget cuts in 1976. They averted one round of cuts by forgoing cost-of-living increases for 2 years, a giveback worth $10 million.
Reprinted with permission from the Bellevue Hospital Archives.
Peer Reviewed
Contributors N. Freudenberg originated the study, wrote the first draft, and edited all subsequent drafts. M. Fahs designed, conducted, and wrote drafts on economic analyses. S. Galea organized epidemiological information on the 3 epidemics. A. Greenberg prepared the history of the New York City fiscal crisis. All authors revised the final draft.
References
- 1.Cahill KM, ed. Imminent Peril: Public Health in a Declining Economy. New York, NY: 20th Century Fund Press; 1991.
- 2.Wallace R. A synergism of plagues. Environ Res. 1988;47:1–33. [DOI] [PubMed] [Google Scholar]
- 3.Oryshkevich BA. New York City’s health care crisis: AIDS, the poor, and limited resources. JAMA. 1989;261: 378. [PubMed] [Google Scholar]
- 4.Singer M, Clair S. Syndemics and public health: reconceptualizing disease in biosocial context. Med Anthropol Q. 2003;17:423–441. [DOI] [PubMed] [Google Scholar]
- 5.CDC Syndemics Prevention Network. Syndemics overview. Available at: http://www.cdc.gov/syndemics/overview.htm. Accessed on December 6, 2004.
- 6.Shefter M. Political Crisis/Fiscal Crisis. The Collapse and Revival of New York City. New York, NY: Basic Books; 1985.
- 7.Tabb W. The Long Default: New York City and the Urban Fiscal Crisis. New York, NY: Monthly Review Press; 1982.
- 8.Alcaly RE, Mermelstein D, eds. The Fiscal Crisis of American Cities. New York, NY: Vintage; 1977.
- 9.Freeman JB. Working-Class New York: Life and Labor Since World War II. New York, NY: New Press; 2000.
- 10.Netzer D. The economy and the governing of the city. In: Bellush J, Netzer D, eds. Urban Politics New York Style. Armonk, NY: ME Sharpe; 1990:27–62.
- 11.Brash J. Invoking fiscal crisis: moral discourse and politics in New York City. Social Text. 2003;76:59–83. [Google Scholar]
- 12.Imperato PJ. The New York City Department of Health under Lowell E. Bellin, MD. J Ambul Care Manage. 1991; 14(2):73–81. [DOI] [PubMed] [Google Scholar]
- 13.Imperato PJ. The effect of New York City’s fiscal crisis on the Department of Health. Bull N Y Acad Med. 1978;54:276–89. [PMC free article] [PubMed] [Google Scholar]
- 14.Brecher C, Spiezio S. Privatization and Public Hospitals: Choosing Wisely in New York City. New York, NY: 20th Century Fund Press, 1995.
- 15.Maitland L. Fifty city hospital clinics will close. New York Times. November 6, 1975:45.
- 16.Bird D. Ramirez to head addiction agency. New York Times. Nov 27, 1967:71.
- 17.Joseph H. The criminal justice system and opiate addiction: a historical perspective. NIDA Res Monogr. 1988; 86:106–138. [PubMed] [Google Scholar]
- 18.Ranzal E. City to cut budget further: addiction agency may die. New York Times. March 17, 1976:45.
- 19.Newfield J, DuBrul P. The Permanent Government: Who Really Runs New York? New York, NY: Pilgrim Press; 1981.
- 20.Rohatyn F. The Twenty-Year Century: Essays on Economics and Public Finance. New York, NY: Random House; 1983.
- 21.Koch EI. Milestones on New York City’s road to fiscal health [letter]. New York Times. March 6, 1981:A26.
- 22.von Hoffman A. High ambitions: the past and future of American low-income housing policy. Housing Policy Debate. 1996;7:423–446. [Google Scholar]
- 23.Altman DE, Morgan DH. The role of state and local government in health. Health Aff (Millwood). 1983;2:7–31. [DOI] [PubMed] [Google Scholar]
- 24.Petersen PE. The changing fiscal place of big cities in the federal system. In: Cisneros H, ed. Interwoven Destinies: Cities and the Nation. New York, NY: Norton; 1993:187–210.
- 25.Stockman D. Triumph of Politics: Why the Reagan Revolution Failed. New York, NY: Avon; 1987.
- 26.Bluestone B, Harrison B. Deindustrialization of America: Plant Closings, Community Abandonment, and the Dismantling of Basic Industry. New York, NY: Basic Books; 1982.
- 27.Jackson KT. Crabgrass Frontier: the Suburbanization of the United States. New York, NY: Oxford University Press; 1985.
- 28.Lees L, Bondi L. De-gentrification and economic recession: the case of New York City. Urban Geography. 1995; 16:234–253. [Google Scholar]
- 29.Roberts S. Report says city’s upturn is incomplete. New York Times. November 28, 1983:B1.
- 30.Wallace DN. Discriminatory public policies and the New York City tuberculosis epidemic, 1975–1993. Microbes Infect. 2001;3:515–524. [DOI] [PubMed] [Google Scholar]
- 31.Brecher C, Horton R. Retrenchment and social equity here [editorial]. New York Times. November 17, 1980:A23.
- 32.Fitch R. The Assassination of New York. New York, NY: Verso; 1993.
- 33.Bureau of Tuberculosis Control, New York City Department of Health and Mental Hygiene. 2003 Information Summary. Available at: http://www.nyc.gov/html/doh/downloads/pdf/tb/tb2003.pdf. Accessed on December 29, 2004.
- 34.HIV Epidemiology Program, New York City Department of Health and Mental Hygiene. New York City HIV/AIDS Surveillance Statistics 1995 and 2003. Available at: http://www.nyc.gov/html/doh/html/ah/hivtables2003.shtml. Accessed on December 29, 2004.
- 35.Langan P, Durose M. Homicide counts: The remarkable drop in crime in New York City. Available at: http://samoa.istat.it/Eventi/sicurezza/relazioni/Langan_rel.pdf. Accessed on December 29, 2005.
- 36.Paolo WF Jr, Nosanchuk JD. Tuberculosis in New York city: recent lessons and a look ahead. Lancet Infect Dis. 2004;4(5):287–293. [DOI] [PubMed] [Google Scholar]
- 37.Brudney K, Dobkin J. Resurgent tuberculosis in New York City. Human immunodeficiency virus, homelessness, and the decline of tuberculosis control programs. Am Rev Respir Dis. 1991;144: 745–749. [DOI] [PubMed] [Google Scholar]
- 38.Glaeser EL, Kahn ME. From John Lindsay to Rudy Giuliani: the decline of the local safety net? FRBNY Econ Policy Rev. September 1999:117–132.
- 39.Paul EA, Lebowitz SM, Moore RE, Hoven CW, Bennett BA, Chen A. Nemesis revisited: tuberculosis infection in a New York City men’s shelter. Am J Public Health. 1993;83:1743–1745. [DOI] [PMC free article] [PubMed] [Google Scholar]
- 40.Bellin EY, Fletcher DD, Safyer SM. Association of tuberculosis infection with increased time in or admission to the New York City jail system. JAMA. 1993; 269(17):2228–2231. [PubMed] [Google Scholar]
- 41.Frieden TR, Sherman LF, Maw KL, et al. A multi-institutional outbreak of highly drug-resistant tuberculosis: epidemiology and clinical outcomes. JAMA. 1996;276:1229–1235. [PubMed] [Google Scholar]
- 42.Des Jarlais DC, Marmor M, Friedmann P, et al. HIV incidence among injection drug users in New York City, 1992–1997: evidence for a declining epidemic. Am J Public Health. 2000;90: 352–359. [DOI] [PMC free article] [PubMed] [Google Scholar]
- 43.Bayer R. The Dependent Center: the first decade of the AIDS epidemic in New York City. In: Rosner D, ed. Hives of Sickness: Public Health and Epidemics in New York City. New Brunswick, NJ: Rutgers University Press; 1995: 131–150.
- 44.Chiasson MA, Berenson L, Li W, et al. Declining HIV/AIDS mortality in New York City. J Acquir Immune Defic Syndr. 1999;21:59–64. [DOI] [PubMed] [Google Scholar]
- 45.Centers for Disease Control and Prevention. AIDS Public Information Data Set, 2001. Available at: http://www.cdc.gov/hiv/softward/apids.htm. Accessed on January 24, 2005.
- 46.Sayre WS. Governing New York City. New York, NY: Norton; 1965.
- 47.Frank B. An overview of heroin trends in New York City: past, present and future. Mt Sinai J Med. 2000;67: 340–346. [PubMed] [Google Scholar]
- 48.Barbanel J. To combat AIDS, Koch urges anti-drug effort. New York Times. December 17, 1985:B7.11647364
- 49.Treaster JB. Dinkins plans drug-fighting centers at 9 schools. New York Times. May 22, 1990:B3.
- 50.Newman RG, Tytun A, Bashkow S. Retention of patients in the New York City methadone maintenance treatment program. Int J Addict. 1976;11: 905–931. [DOI] [PubMed] [Google Scholar]
- 51.Marmor M, Des Jarlais DC, Friedman SR, Lyden M, el-Sadr W. The epidemic of acquired immunodeficiency syndrome (AIDS) and suggestions for its control in drug abusers. J Subst Abuse Treat. 1984;1:237–47. [DOI] [PubMed] [Google Scholar]
- 52.Metzger DS, Navaline H, Woody GE. Drug abuse treatment as AIDS prevention. Public Health Rep. 1998;113: 97–106. [PMC free article] [PubMed] [Google Scholar]
- 53.Sloboda Z. What we have learned from research about the prevention of HIV transmission among drug abusers. Public Health Rep. 1998;11:194–204. [PMC free article] [PubMed] [Google Scholar]
- 54.Alpert PL, Shuter J, DeShaw MG, Webber MP, Klein RS. Factors associated with unrecognized HIV-1 infection in an inner-city emergency department. Ann Emerg Med. 1996;28(2):159–164. [DOI] [PubMed] [Google Scholar]
- 55.Perrow C, Guillen MF. The AIDS Disaster: The Failure of Organizations in New York and the Nation. New Haven, Conn: Yale University Press; 1990.
- 56.Schanberg S. New York: the unseen casualties [editorial]. New York Times. January 31, 1984:A23.
- 57.Gerber AR, Valdiserri RO, Holtgrave DR, et al. Preventive services guidelines for primary care clinicians caring for adults and adolescents infected with the human immunodeficiency virus. Arch Fam Med. 1993;2(9): 969–979. [DOI] [PubMed] [Google Scholar]
- 58.Bourgois P. The political economy of resistance and self-destruction in the crack economy. An ethnographic perspective. Ann N Y Acad Sci. 1995;749: 97–118. [DOI] [PubMed] [Google Scholar]
- 59.Kolata G. In cities, poor families are dying of crack. New York Times. August 11, 1989:A1, A13. [Google Scholar]
- 60.Fagan J, Chin KL. Violence as regulation and social control in the distribution of crack. NIDA Res Monogr. 1990; 103:8–43. [PubMed] [Google Scholar]
- 61.Williams T. The Cocaine Kids: The Inside Story of a Teenage Drug Ring. Reading, Mass: Addison Wesley; 1989.
- 62.Marshall A. Principles of Economics: An introductory volume. Reprint of 1920 ed. Philadelphia, Pa: Porcupine Press; 1990.
- 63.Bloom DE, Canning D. Policy forum: public health. The health and wealth of nations. Science. 2000;287: . [DOI] [PubMed] [Google Scholar]
- 64.Weisbrod BA. Economics of Public Health. Philadelphia, Pa: University of Pennsylvania; 1961.
- 65.Mushkin SJ. Health as an investment. J Polit Econ. 1990;70:129–57. [Google Scholar]
- 66.Rice DP. Estimating the Cost of Illness. Rockville, Md: Dept of Health, Education, and Welfare; 1966. Health Economics Series no. 6. DHEW publication PHS 947–6.
- 67.Hartunian NS, Smart CN, Thompson M. The Incidence and Economic Costs of Major Health Impairments. Lexington, Mass: DC Heath & Co; 1981.
- 68.Hodgson TA, Meiners M. Guidelines for Cost of Illness Studies in the Public Health Service. Washington, DC: Task Force on Cost of Illness Studies, US Public Health Service; 1979.
- 69.Rice DP, Hodgson TA, Kopstein AN. The economic costs of illness: a replication and update. Health Care Financ Rev. 1985;7:61–80. [PMC free article] [PubMed] [Google Scholar]
- 70.Williams A. Priority setting in public and private health care. A guide through the ideological jungle. J Health Econ. 1988;7:173–183. [DOI] [PubMed] [Google Scholar]
- 71.Murray CJL, Lopez A, eds. The Global Burden of Disease. Cambridge, Mass: Harvard University Press; 1996.
- 72.Hinman AR. Quantitative policy analysis and public health policy: a macro and micro view. Am J Prev Med. 1997;13:6–11. [PubMed] [Google Scholar]
- 73.Varmus H. Disease-Specific Estimates of Direct and Indirect Costs of Illness and NIH Support. Bethesda, Md: Office of the Director, National Institutes of Health; September 1997.
- 74.Cutler DM. Your Money or Your Life. Oxford, United Kingdom: Oxford University Press; 2004.
- 75.Miller TR, Cohen MA, Rossman SB. Victim costs of violent crime and resulting injuries. Health Aff (Millwood). 1993;12:186–197. [DOI] [PubMed] [Google Scholar]
- 76.Hellinger FJ. Forecasts of the costs of medical care for persons with HIV: 1992–1995. Inquiry. 1992;29:356–365. [PubMed] [Google Scholar]
- 77.Hellinger FJ. The lifetime cost of treating a person with HIV. JAMA. 1993; 270:4. [PubMed] [Google Scholar]
- 78.Scitovsky AA, Rice DP. Estimates of the direct and indirect costs of acquired immunodeficiency syndrome in the United States, 1985, 1986, and 1991. J Med Pract Manage. 1988;3:234–241. [PubMed] [Google Scholar]
- 79.Brown RE, Miller B, Taylor WR, et al. Health-care expenditures for tuberculosis in the United States Arch Intern Med. 1995;155:1595–1600. [PubMed] [Google Scholar]
- 80.Frieden TR, Fujiwara PI, Washko RM, Hamburg MA. Tuberculosis in New York City—turning the tide. N Engl J Med. 1995;333:229–233. [DOI] [PubMed] [Google Scholar]
- 81.Freedberg KA, Scharfstein JA, Seage GR, et al. The cost-effectiveness of preventing AIDS-related opportunistic infections. JAMA. 1998;279:130–134. [DOI] [PubMed] [Google Scholar]
- 82.US Department of Labor. Inflation calculator. Available at: http://www.bls.gov/cpi. Accessed on January 15, 2005.
- 83.Stover J, Walker N, Garnett GP, et al. Can we reverse the HIV/AIDS pandemic with an expanded response? Lancet. 2002;360:73–77. [DOI] [PubMed] [Google Scholar]
- 84.Estimates of People Living with AIDS in New York City, 1999 Edition. New York, NY: Office of AIDS Surveillance, New York City Department of Health; 2000.
- 85.HIV prevalence in New York City, 2002. HIV Epidemiology Program Special Supplemental Report. 2004;2(S1). Available at: http://www.nyc.gov/html/doh/downloads/pdf/dires/dires-2004-report-vol2noS2.pdf. Accessed on December 29, 2005.
- 86.Netzer D. The outlook for the metropolitan area. FRBNY Econ Policy Rev. 1997;3:93–112. [Google Scholar]
- 87.Berne R, Stiefel L. Cutback budgeting: the long-term consequences. J Policy Anal Manage. 1993;12:664–684. [Google Scholar]
- 88.Wallace R. The New York City fire epidemic as a toxic phenomenon. Int Arch Occup Environ Health. 1982;50: 33–51. [DOI] [PubMed] [Google Scholar]
- 89.Wallace R, Wallace D. Origins of public health collapse in New York City: the dynamics of planned shrinkage, contagious urban decay and social disintegration. Bull N Y Acad Med. 1990;66: 391–434. [PMC free article] [PubMed] [Google Scholar]
- 90.Karmen A. New York murder mystery: The true story Behind the Crime Crash of the 1990s. New York, NY: NYU Press; 2000.
- 91.Hernandez R, Baker A. Pataki budget is said to seek Medicaid cuts. New York Times. January 15, 2005:A1.
- 92.Weisman J. 2006 cuts in domestic spending on table. Washington Post. May 27, 2004:A1.
- 93.Quigley RJ, Taylor LC. Evaluating health impact assessment. Public Health. 2004;118:544–552. [DOI] [PubMed] [Google Scholar]
- 94.Sullivan R. Beame’s fiscal aide gets hospital post. New York Times. April 27, 1977:26.
- 95.Sullivan R. Aides say Beame still seeks to oust hospital corporation’s chief. New York Times. December 12, 1976:82.
- 96.Grandjean P. Implications of the precautionary principle for primary prevention and research. Annu Rev Public Health. 2004;25:199–223. [DOI] [PubMed] [Google Scholar]