Abstract
CaBP1 (calcium-binding protein 1) is a 19.4-kDa protein of the EF-hand superfamily that modulates the activity of Ca2+ channels in the brain and retina. Here we present data from NMR, microcalorimetry, and other biophysical studies that characterize Ca2+ binding, Mg2+ binding, and structural properties of recombinant CaBP1 purified from Escherichia coli. Mg2+ binds constitutively to CaBP1 at EF-1 with an apparent dissociation constant (Kd) of 300 μm. Mg2+ binding to CaBP1 is enthalpic (ΔH = -3.725 kcal/mol) and promotes NMR spectral changes, indicative of a concerted Mg2+-induced conformational change. Ca2+ binding to CaBP1 induces NMR spectral changes assigned to residues in EF-3 and EF-4, indicating localized Ca2+-induced conformational changes at these sites. Ca2+ binds cooperatively to CaBP1 at EF-3 and EF-4 with an apparent Kd of 2.5 μm and a Hill coefficient of 1.3. Ca2+ binds to EF-1 with low affinity (Kd >100 μm), and no Ca2+ binding was detected at EF-2. In the absence of Mg2+ and Ca2+, CaBP1 forms a flexible molten globule-like structure. Mg2+ and Ca2+ induce distinct conformational changes resulting in protein dimerization and markedly increased folding stability. The unfolding temperatures are 53, 74, and 76 °C for apo-, Mg2+-bound, and Ca2+-bound CaBP1, respectively. Together, our results suggest that CaBP1 switches between structurally distinct Mg2+-bound and Ca2+-bound states in response to Ca2+ signaling. Both conformational states may serve to modulate the activity of Ca2+ channel targets.
A family of neuronal calcium-binding proteins (CaBP41-5 (1, 2)), similar in sequence to calmodulin, represents a new sub-branch of the EF-hand superfamily (3-5). CaBPs are vertebrate-specific proteins expressed predominantly in the brain and retina. Multiple splice variants and various isoforms of CaBPs have been identified and localized in different neuronal cell types (6-9). The abundance and multiplicity of CaBPs in the central nervous system suggest a role in signal transduction. Indeed, it was recently discovered that CaBP1, also termed caldendrin (10), modulates the Ca2+-sensitive activity of inositol 1,4,5-trisphosphate receptors (InsP3Rs) that serve as Ca2+ release channels on the endoplasmic reticulum membrane (11, 12). CaBP1 also interacts with P/Q-type voltage-gated Ca2+ channels (13), L-type channels (14, 15), and the transient receptor potential channel, TRPC5 (16). CaBP4 has been shown to regulate Ca2+-dependent voltage gating of L-type Ca2+ channels in the retina (17). Thus, the CaBP proteins are emerging as a family of calcium sensors that modulate the activity of multiple neuronal Ca2+ channels.
CaBP proteins each contain four EF-hands, similar in sequence to those found in calmodulin and troponin C (3, 4) (Fig. 1). By analogy to the structure of calmodulin (18), the four EF-hands of CaBP proteins are believed to form an N-terminal domain composed of EF-1 and EF-2 and a C-terminal domain composed of EF-3 and EF-4. The two domains are connected by a central linker that is four residues longer in CaBPs than in calmodulin. The extra residues in the linker may extend a “central helix” by one turn, generating an elongated structure similar to calmodulin. Alternatively, the extra residues might form a U-shaped linker that promotes interdomain association similar to that found in recoverin (5, 19, 20) and other members of the neuronal calcium sensor protein family (21-26). In contrast to calmodulin, the CaBPs contain a variable stretch of nonconserved amino acids within the N-terminal region. The variable N-terminal residues of CaBPs are generated in part by splice variants of CaBP1 and CaBP2 (see the italicized residues in Fig. 1). The N-terminal sequence variability is likely to confer target specificity. Another distinguishing property of the CaBPs is that the second EF-hand lacks critical residues required for high affinity Ca2+ binding. A conserved glycine at the 5-position of the loop in EF-2 (e.g. Gly-75 in CaBP1) cannot chelate Ca2+ and therefore would be expected to disable physiological Ca2+ binding to EF-2. By contrast, EF-2 of calmodulin contains asparagine at the 5-position, which promotes high affinity Ca2+ binding at this site (18, 27).
FIGURE 1.
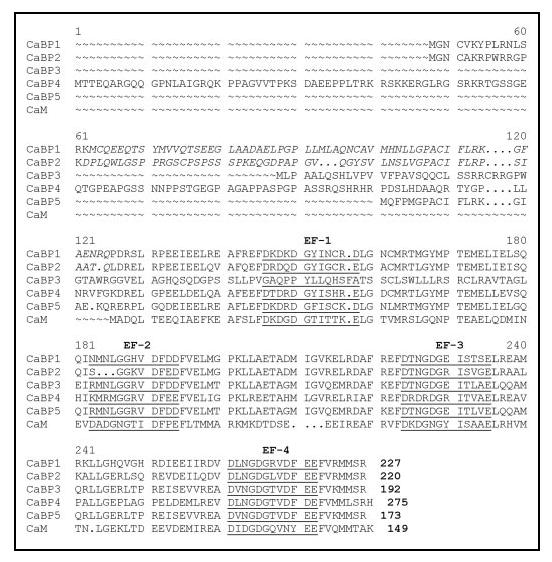
Alignment of amino acid sequence of human CaBP1 with those of calmodulin and other members of the neuron-specific CaBP sub-branch of the EF-hand superfamily. The Ca2+ binding loops of the four EF-hands are underlined. The sequences of long splice variants of CaBP1 and CaBP2 (as defined in Ref. 1) are shown. Short splice variants lack the italicized residues.
In CaBP1 and CaBP5, the first EF-hand (EF-1) contains aspartate (e.g. Asp-46 in CaBP1) instead of the usual glutamate at the 12-position of the EF-hand binding loop (Fig. 1). This substitution in other EF-hand proteins is known to diminish binding selectivity of Ca2+ versus Mg2+ (28-30). Mg2+ binding to the first EF-hand of CaBP1 or CaBP5 might be sufficient to drive functional protein conformational changes. Magnesium is not normally considered a regulator, but recent in vivo measurements have detected changes in free Mg2+ concentrations in cortical neurons after treatment with neurotransmitter (31). Other neuronal calcium-binding proteins such as DREAM (29), GCAP2 (32), and neuronal calcium sensor-1 (33) also bind Mg2+ and exhibit Mg2+-induced physiological effects. Therefore, it is of interest to investigate the structure and function of Mg2+ binding to CaBPs.
Here we present a structural analysis of Mg2+ and Ca2+ binding to the individual EF-hands in CaBP1. The results reveal that EF-1 binds constitutively to Mg2+; EF-2 does not bind Ca2+ or Mg2+; EF-3 and EF-4 bind functionally to Ca2+; and both Mg2+ and Ca2+ promote protein dimerization and increase folding stability. These results serve as a prelude to future structural analyses that will determine at atomic resolution the Ca2+-induced conformational changes of CaBPs in order to understand their Ca2+-sensitive regulation of physiological target proteins.
EXPERIMENTAL PROCEDURES
Expression and Purification of Human CaBP1—All experiments in this study were performed on a small splice variant of human CaBP1, previously termed s-CaBP1 (1) and referred to in this study as CaBP1. Escherichia coli strain BL21 (DE3), transformed with plasmid pET15b-CaBP1, was grown in LB broth (containing 100 μg/ml ampicillin) at 37 °C until the A600nm reached ∼1.0 and then was diluted 1:50 in LB and grown again at 37 °C. At A600nm = 0.5, CaBP1 expression was induced with 0.5 mm isopropyl 1-thio-β-d-galactopyranoside. After a 3-h induction period, the cells were harvested by centrifugation. The cell pellet was then suspended in Lysis Buffer containing 20 mm Tris, 0.1 m KCl, 1 mm EGTA, 1 mm dithiothreitol, and 10% glycerol, pH 7.5, and flash-frozen using liquid nitrogen. Frozen aliquots were stored at -70 °C. Thawed cells with 0.1 mm phenylmethylsulfonyl fluoride were disrupted via sonication using a Branson Sonifier 450 at 50% duty cycle, output 4-5 on ice, for 2 min with two repetitions and a 2-min cooling period in between. CaBP1 was recovered by ultracentrifugation at 35,000 rpm for 1 h at 4°C. The supernatant, supplemented with 4 mm CaCl2 and 0.2 m KCl, was passed through a phenyl-Sepharose column (Amersham Biosciences), washed for 6 column volumes, and eluted with a 200-min gradient elution in a low salt buffer containing 50 mm KCl and 2 mm EGTA. Fractions containing protein were visualized by Coomassie-stained SDS-polyacrylamide gels. Selected fractions were then pooled, diluted 1:3 with an equilibration buffer (20 mm Tris, 2 mm EGTA, 1 mm dithiothreitol, pH 7.5), and further purified using a Q HP-Sepharose column (Amersham Biosciences) at room temperature using a 200-min gradient elution. Fractions containing pure CaBP1 as visualized by Coomassie-stained SDS-polyacrylamide gels were pooled and concentrated using Amicon Ultra 15 centrifugal filters (Millipore) with a 10-kDa molecular mass cut-off. The overall yield was ∼16 mg of protein from 1 liter of cell culture. The protein concentration was determined by measuring the A280nm and a molar absorption coefficient of ϵ = 3960 m-1 cm1-.
Preparation of ApoCaBP1 and Mg2+-bound CaBP1 for Ca2+ Binding Studies—ApoCaBP1 was prepared by adding 5 mm EGTA to purified material in a pre-rinsed Amicon filter. The CaBP1 was then concentrated to 1 ml and washed with 15 ml of Ca2+-free, Mg2+-free buffer. The washes were repeated five times until remaining EGTA was negligible (<1 nm). Mg2+-bound CaBP1 was prepared similarly but was washed with a buffer containing Mg2+. All glassware and tubes that contacted apo- or Mg2+-bound CaBP1 were first washed with 0.1 m HCl, followed by multiple rinses with decalcified buffer.
Binding of 45Ca2+—45Ca2+ radioactive isotope (calcium-45, calcium chloride in aqueous solution, specific activity = 850 mCi/ml; Amersham Biosciences) was used to quantitate the binding of Ca2+ to CaBP1. 45Ca2+ binding to CaBP1 was measured as the protein-bound radioactivity retained after ultrafiltration using a procedure described previously (34) based on the original method of Paulus (35). The buffer used in the Ca2+ titration (20 mm Tris-HCl, 0.1 m KCl, 1 mm dithiothreitol, pH 7.5) and protein samples were decalcified by treatment with Chelex resin (Bio-Rad). A Centricon-10 concentrator (10-kDa cut-off, 2-ml sample compartment; Millipore Corp.) used in the titration was pretreated to remove contaminating Ca2+. The lower chamber was rinsed with 0.1 m HCl, followed by several rinses with decalcified buffer. The concentrator membrane was decalcified by rinsing with 5% NaHCO3 followed by several rinses with decalcified buffer. A decalcified protein sample (1.5 ml, 80 μm) was placed into the sample compartment, and 12 μl of 0.25 mm 45Ca2+ solution (2.6 μCi) was added. The sample was carefully mixed and centrifuged (2300 rpm, 2 min) by using a tabletop centrifuge (Beckman model TJ-6), forming 25 μl of filtrate. The filtrate was returned to the sample chamber, mixed, and centrifuged a second time to minimize any dead volume. The radioactivity of 10 μl of the filtrate (proportional to the free Ca2+ concentration) and radioactivity of an equal volume of the protein sample (proportional to total Ca2+ concentration) were separately measured by liquid scintillation counting (Liquid Scintillation Analyzer, Packard Instrument Co.). Aliquots of nonradioactive Ca2+ were added serially to the protein sample to adjust the total Ca2+ concentration throughout the titration (2, 15, 29, 56, 83, 112, 140, 197, 255, 313, 458, and 605 μm). The corresponding radioactivities of filtrate and protein sample were measured for each point in the titration. The free and bound Ca2+ concentrations at each point in the titration were calculated from the measured radioactivity as described previously (36), and fractional saturation was plotted as a function of free Ca2+ concentration (Fig. 2).
FIGURE 2.
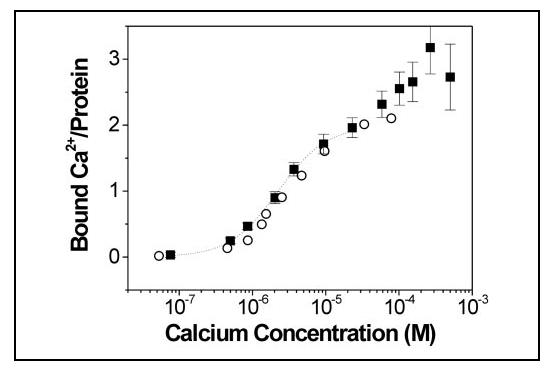
Equilibrium Ca2+ binding to CaBP1. Titrations of 45Ca2+ binding to CaBP1 were conducted using an ultrafiltration method, as described under “Experimental Procedures.” Number of ions bound per protein is plotted as a function of the free calcium concentration. Binding data measured in the absence and presence of 5 mm Mg2+ are indicated by black squares and open circles, respectively. The solid line represents the best fit to the Hill model using parameters as defined in the text, Kd = 2.5 μm and Hill coefficient of 1.3.
Differential Scanning Calorimetry—DSC experiments were performed using a MicroCal VP-DSC microcalorimeter as described previously (37). Samples of apoCaBP1 were prepared as for the Ca2+ binding studies. Aliquots of the apoCaBP1 were dialyzed overnight in buffer supplemented with 5 mm EGTA (apo-), 5 mm MgCl2 (Mg2+-bound), or 5 mm CaCl2 (Ca2+-bound) using Pierce Slide-a-lyzer minidialysis units, 3.5-kDa molecular mass cut-off. The buffer consisted of 20 mm Tris, pH 7.5, 100 mm NaCl, and 1 mm DTT. Samples of 126 μm CaBP1 were heated in a MicroCal VP-DSC calorimeter in a 10-120 °C range at a scan rate of 60 °C/h, then cooled, and rescanned to check for thermal transition reversibility. Samples were also scanned at slower scan rates in order to examine resolution of any peak shoulders. A buffer scan was subtracted from each data set to correct for base-line error. Data analysis was performed using the EXAM program (37).
Isothermal Titration Calorimetry—ITC experiments were performed using a MicroCal VP-ITC microcalorimeter as described previously (29). Samples of apoCaBP1 were prepared as described for the Ca2+ binding studies, and apoCaBP1 was dialyzed against decalcified buffer overnight. A sample of the dialysis buffer was placed in the reference cell, and samples of apo- or Mg2+-bound CaBP1 were placed in the sample cell. Experiments were performed at 25 °C and with protein concentrations between 120 and 180 μm. 40 injections of 15 mm MgCl2 or 5 mm CaCl2, prepared using decalcified buffer, were made in 5-μl aliquots. An injection delay of 240 s was utilized to allow for the base line to return after each injection. A titration into dialysis buffer was subtracted from the data to correct for heat of dilution. For each addition of ligand, the molar heat (Qt) was measured as a function of total ligand concentration (Xt) as shown in Equation 1,
| (Eq.1) |
where n is the number of sites; Mt is the total protein monomer concentration; Ka is the metal-binding association constant (1/Kd), and V is the cell volume. The differential heat (dQt) was fit to various kinetic models (sequential and independent sites) by using a nonlinear least squares minimization method (38, 39) performed using MicroCal Origin ITC software. Thermodynamic parameters in the analysis were defined as shown in Equation 2,
| (Eq.2) |
and
| (Eq.3) |
where n is the number of moles; T is the absolute temperature, and R is 8.3151 J mol-1 K-1.
Gel Filtration Size Exclusion Chromatography—Size exclusion chromatography experiments were performed on CaBP1 in buffer containing 20 mm Tris, pH 7.5, 0.1 m KCl, 1 mm DTT with the addition of either 2 mm EGTA (apo-), 2 mm EGTA + 1 mm MgCl2 (Mg2+-bound), or 2 mm CaCl2 (Ca2+-bound). 250 μl of each sample/standard was freshly prepared, injected, and eluted on a Superdex 200 column (Amersham Biosciences) via the AKTA Prime (Amersham Biosciences) at a flow rate of 0.4 ml/min at room temperature. To run successfully at such a low flow rate, all air bubbles were purged before each run according to the manufacturer’s instructions. The protein standards used in the analysis were β-amylase (200 kDa), alcohol dehydrogenase (150 kDa), albumin (66 kDa), carbonic anhydrase (29 kDa), and cytochrome c (12.4 kDa). The elution volume (Ve) of each protein was monitored separately at 280 nm. Dextran blue was injected and used to determine the column void volume (Vo). The molecular mass of CaBP1 was extrapolated from a standard curve of Ve/Vo versus molecular mass on a semilog scale. Experiments were repeated twice to ensure consistency and accuracy.
Static Light Scattering—Static light scattering experiments were performed using a Zetasizer Nano S (Malvern Instruments). CaBP1 samples were filtered with a 0.02-μm Anotop 10 filter (Whatman). Measurements were performed at 25 °C in a buffer containing 20 mm Tris, pH 7.5, 100 mm KCl, and 1 mm tris(2-carboxyethyl)phosphine supplemented with either 2 mm EGTA (apo-), 5 mm MgCl2 (Mg2+-bound), or 2 mm CaCl2 (Ca2+-bound). SLS measurements were made using serial dilutions of CaBP1 (3 to 0.75 mg/ml). The average molecular mass of CaBP1 in solution was determined from analysis of a Debye plot of the light scattering as described previously (40). Toluene served as a standard reference, and a differential refractive index (dn/dc) of 0.185 ml/g was used in the analysis. Data were analyzed using the Zetasizer Nano software provided with the instrument.
Dynamic Light Scattering—DLS experiments were performed on filtered samples of CaBP1 (described above) at 25 °C using a Zetasizer Nano S instrument (Malvern Instruments). Multiple experimental runs were performed to ensure accuracy. Time-correlated fluctuations in light scattering caused by Brownian motion of CaBP1 were analyzed by an autocorrelator inside the DLS instrument and modeled by the first-order autocorrelation function as described previously (40). The translational diffusion coefficient (Dt) of CaBP1 derived from this analysis was then used to calculate the hydrodynamic radius (RH) using the Stokes-Einstein equation, Dt = kBT/6πηRH, where kB is Boltzmann constant; T is temperature in Kelvin; η is solvent viscosity, and RH is the hydrodynamic radius of CaBP1.
NMR Spectroscopy—Samples for NMR analysis were prepared by dissolving 15N-labeled CaBP1 (0.5 mm) in 0.3 ml of a 95% H2O, 5% [2H]H2O solution containing 10 mm [2H11]Tris, pH 7.4, 5 mm [2H10]tris(2-carboxyethyl)phosphine, 0.1 m KCl, and either 5 mm EDTA (apo-), 5 mm MgCl2 (Mg2+-bound), or 10 mm CaCl2 + 5 mm MgCl2 (Ca2+-bound). All NMR experiments were performed at 30 °C on a Bruker Avance 600 MHz spectrometer equipped with a four-channel interface and triple resonance probe with triple axis pulsed field gradients. The 15N-1H HSQC spectra (see Fig. 7) were recorded on samples of 15N-labeled CaBP1 (in 95% H2O, 5% 2H2O). The number of complex points and acquisition times were 256, 180 ms (15N(F1)), and 512, 64 ms (1H (F2)). Partial sequence-specific resonance assignments were obtained as described previously (41).
FIGURE 7.
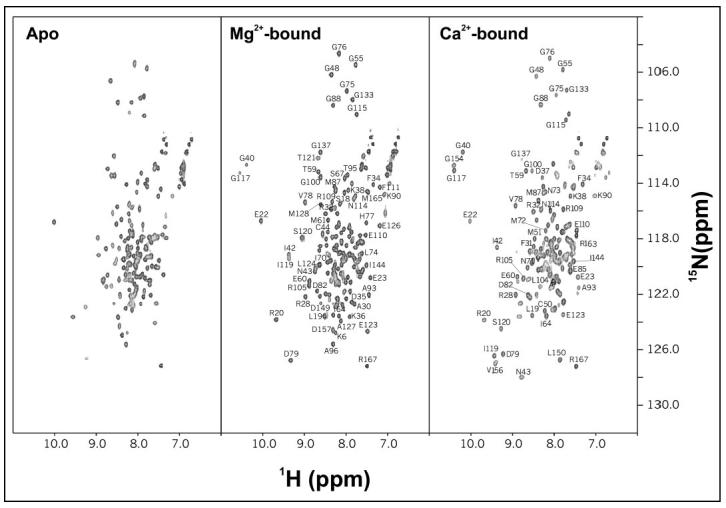
Two-dimensional 15N-1H HSQC NMR spectra of apo- (left panel), Mg2+-bound (middle panel), and Ca2+-bound (right panel) CaBP1. Each protein sample was uniformly labeled with nitrogen-15, and spectra were recorded at 600-MHz 1H frequency.
RESULTS
Equilibrium 45Ca2+ Binding Measurements—CaBP1 contains four EF-hand Ca2+-binding motifs (Fig. 1). The second EF-hand (EF-2) contains Gly-75 at the 5-position of the EF-hand loop that should preclude Ca2+ binding. The remaining EF-hands in CaBP1 (EF-1, EF-3, and EF-4) match the consensus and were expected to bind Ca2+. To quantitate the number of ions that bind to CaBP1 at saturation, direct measurements of 45Ca2+ binding were performed on samples of recombinant CaBP1 purified from E. coli (Fig. 2). At least two Ca2+ bind to the protein with relatively high affinity at physiological Ca2+ concentrations (0.1-20 μm), and a third Ca2+ appears to bind with much lower affinity at Ca2+ concentrations beyond 100 μm. The binding of three Ca2+ to CaBP1 at saturation (Fig. 2) is consistent with the view that EF-2 is disabled, whereas EF-1, EF-3, and EF-4 are functional. However, the relatively high uncertainty of the 45Ca2+ binding data at higher Ca2+ concentrations in the titration (>100 μm), due to nonspecific binding of Ca2+ and other experimental artifacts, precluded a quantitative description of the low affinity site in the analysis below.
The fractional saturation (Y), computed from the 45Ca2+ binding data, can be represented by the Hill equation as shown in Equation 4,
| (Eq.4) |
where [Ca2+] is the free Ca2+ concentration; Kd is the apparent dissociation constant, and a denotes the Hill coefficient. The fractional saturation data for CaBP1 (Fig. 2), at physiological Ca2+ concentrations (0.1-30 μm), is best fit by the Hill equation using the parameters Kd = 2.5 μm and a = 1.3 (see dotted line in Fig. 2). A Hill coefficient greater than 1 in this case suggests that two Ca2+ bind to the protein in the physiological range with positive cooperativity, suggesting that the two physiological sites are likely EF-3 and EF-4, as they interact structurally with one another in the C-terminal domain of CaBP1. This implies that the low affinity site is EF-1, consistent with the NMR analysis below. The presence of Asp-46 (instead of Glu) at the 12-position of EF-1 may explain the unusually low Ca2+ affinity of EF-1.
The 45Ca2+ binding assay was also conducted on CaBP1 in the presence of physiological Mg2+ concentrations (5 mm). The fractional saturation data for CaBP1 in the physiological range of Ca2+ and the presence of Mg2+ (open circles in Fig. 2) is best fit to the Hill equation using the parameters Kd = 3 μm and a = 1.3, indicating that Mg2+ has only a minor effect on Ca2+ binding to the two high affinity sites (EF-3 and EF-4). By contrast, Ca2+ binding to the low affinity site (EF-1) was less apparent in the presence of Mg2+, suggesting that EF-1 might be constitutively occupied by Mg2+ under physiological conditions (0.1-10 μm Ca2+ and 5 mm Mg2+).
Energetics of Ca2+ and Mg2+ Binding—The energetics of Ca2+ and Mg2+ binding to CaBP1 were measured using isothermal titration calorimetry (ITC, see Equations 1-3). Intrinsic metal binding to proteins is usually entropically driven (ΔH >0) because of the high dehydration enthalpies of divalent cations (42). However, the overall enthalpy of divalent cation binding to a protein can be exothermic (ΔH <0) if it is thermodynamically coupled to enthalpic equilibria such as a protein conformational change (43).
Titration of CaCl2 into apoCaBP1 (in the absence of Mg2+) resulted in a multiphasic calorimetric Ca2+ binding isotherm that could be fit by the binding of 2 or more Ca2+ ions (Fig. 3A). The ITC isotherm exhibits an initial endothermic phase (Kd ∼2.5 μm and ΔH = +0.7 kcal/mol) representing stoichiometric binding of one Ca2+, to the protein, followed by an exothermic phase, representing subsequent binding of multiple Ca2+ ions. The exothermic phase likely represents the binding of two Ca2+ to the protein because the negative enthalpy observed in the latter part of the titration persists until a Ca2+/protein ratio of 3 is reached, and declines substantially thereafter.
FIGURE 3.
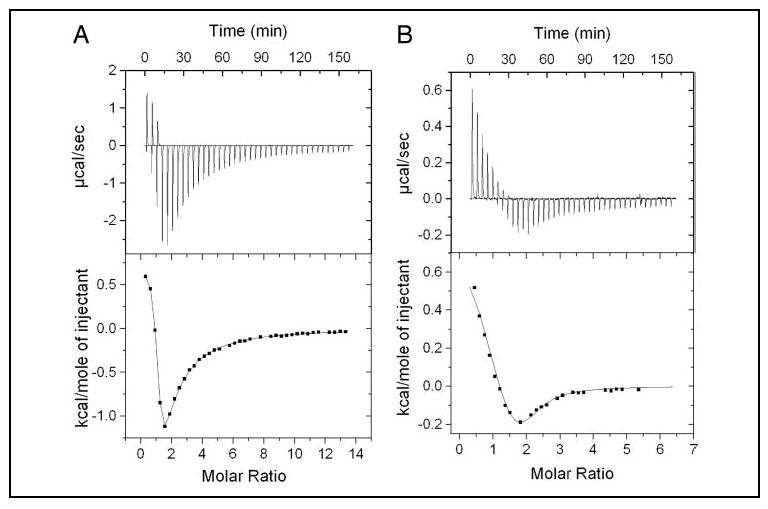
Isothermal titration microcalorimetric analysis of Ca2+ binding to apo- (A) and Mg2+-bound (B) CaBP1. Trace of the calorimetric titration of 40× 5-μl aliquots of 15 mm CaCl2 into 180 μm CaBP1 (A) or 5 mm CaCl2 into 120 μm CaBP1 (B) (top), and integrated binding isotherms (bottom). Solid lines represent the best fit to sequential sites model in A, where K1 = 4 × 10⁵ m-1, ΔH1 = 0.703 ± 0.012 kcal/mol, K2 = 3019 m-1, and ΔH2 = -8.14 kcal/mol; and in B where K1 = 4 × 10⁵ m-1, ΔH1 = 0.611 kcal/mol, K2 = 5 × 10⁴ m-1, and ΔH2 =-0.531 kcal/mol.
The ITC Ca2+ binding isotherm was also measured in the presence of physiological Mg2+ (Fig. 3B). In this case, the isotherm exhibits an initial endothermic phase (Kd∼2.5 μm and ΔH =+0.61 kcal/mol), representing stoichiometric Ca2+ binding to a high affinity site, followed by exothermic binding to a lower affinity site (Kd∼20 μm and ΔH = -0.53 kcal/mol). The endothermic Ca2+ binding appears insensitive to Mg2+. The exothermic Ca2+ binding, by contrast, is much more responsive to Mg2+, and the apparent negative amplitude of the isotherm is much shallower in the presence of saturating Mg2+ than it is in the absence of Mg2+. As a consequence, the exothermic phase represents binding of just one Ca2+ to the protein in the presence of Mg2+ (Fig. 3B), in contrast to at least two sites in the absence of Mg2+ (Fig. 3A). In summary, the ITC analysis indicates that a total of three Ca2+ bind to the protein in the absence of Mg2+ (Fig. 3A) and only two Ca2+ bind to CaBP1 in the presence of a physiological level of Mg2+(Fig. 3B). The ITC results are consistent with constitutive Mg2+ binding at EF-1 under physiological conditions as suggested above by the 45Ca2+ binding data (Fig. 2) and NMR analysis (below).
The effect of Mg2+ on the Ca2+ binding isotherm (Fig. 3) prompted us to quantitate the Mg2+ binding properties of CaBP1 using ITC. Titration of MgCl2 into apoCaBP1 resulted in a simple monophasic isotherm (Fig. 4). Analysis of the Mg2+ binding isotherm using a “1-site” model (Microcal Origin software) revealed that at least one Mg2+ binds enthalpically to CaBP1 with modest affinity (dissociation constant of 300 μm and ΔH =-3.7 kcal/mol). Intrinsic Mg2+ binding to most proteins is usually entropically driven (30). The enthalpic binding of Mg2+ to CaBP1 suggests a possible Mg2+-induced conformational change. NMR spectra of CaBP1 and protein folding stability change quite dramatically upon the addition of saturating Mg2+ (see below), suggesting that Mg2+ binding stabilizes the tertiary structure of CaBP1.
FIGURE 4.
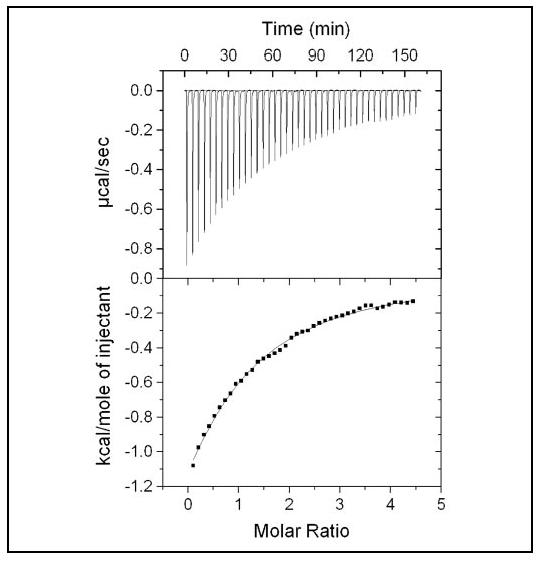
Isothermal titration microcalorimetric analysis of the Mg2+ binding to CaBP1. Trace of the calorimetric titration of 40× 5-μl aliquots of 15.0 mm MgCl2 into the cell containing 172 μm apoCaBP1 (top) and integrated binding isotherm (bottom). The binding isotherm was fit using a 1-site model where K1 = 3329 m-1 and ΔH1 =-3.725 kcal/mol-1.
Mg2+ and Ca2+ Stabilize Protein Folding—DSC experiments were performed on CaBP1 to assess quantitatively the effect of Ca2+ and Mg2+ on protein folding stability. Representative DSC scans of CaBP1 are shown in Fig. 5A. The peak maximum of apoCaBP1 (transition temperature, Tm = 53 °C) is almost 20 °C lower than the peak maxima of both Mg2+-bound (Tm = 74 °C) and Ca2+-bound (Tm = 76 °C) CaBP1, indicating that both Mg2+ and Ca2+ increase the folding stability to nearly the same extent. The transition peaks did not fully reappear upon re-scanning each of the samples, suggesting irreversible unfolding due to aggregation and/or denaturation. However, the post-transitional base line and Tm in each case were independent of protein concentration and scan rate, consistent with a two-state model of unfolding. The DSC thermogram of apoCaBP1 is broad with at least two transitions and could not be fit by a two-state model. By contrast, the DSC thermograms for both Mg2+-bound and Ca2+-bound forms of CaBP1 each exhibit a sharp transition peak, suggesting that unfolding takes place in one cooperative step. A sharp one-step folding transition suggests that the two predicted domains of CaBP1 may be structurally associated with each other, in contrast to the independently folded domains of calmodulin (44-46). The DSC thermograms for Mg2+-bound and Ca2+-bound CaBP1 were optimally fit by the two-state model, B → 2A, where B and A represent the folded and unfolded states, respectively (Fig. 5, B and C). The optimal fitting parameters were Tm = 76.6 °C and ΔHv = 287 cal/mol for Mg2+-bound CaBP1, and Tm = 76.8 °C and ΔHv = 341 cal/mol for Ca2+-bound CaBP1. The fits were markedly worse using the simpler model, B → A, where the folded state is a monomer. The robust precision of the fit to the dimer model (B → 2A) strongly suggests that both Mg2+-bound and Ca2+-bound forms of CaBP1 exist as a dimer in the folded state. These results are in contrast with that of calmodulin (45-47) and related EF-hand proteins such as CIB (30), which exhibit a monomeric folded state and significantly lower Tm for the Mg2+-bound protein.
FIGURE 5.
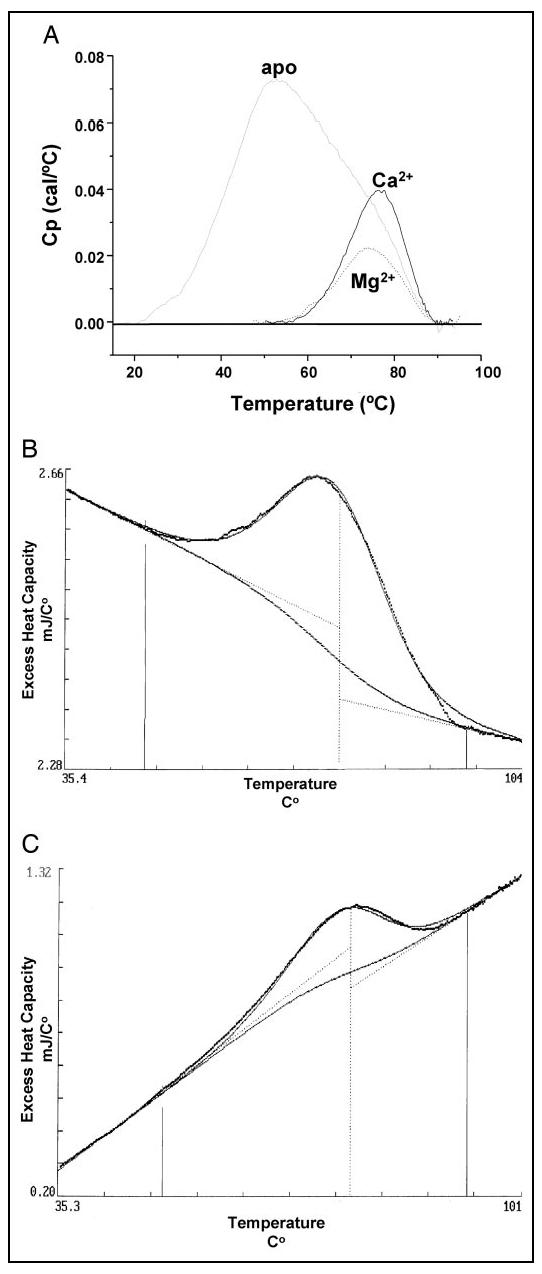
Differential scanning calorimetric analysis of protein unfolding of CaBP1. A, overlay of DSC scans of apo-, Ca2+-bound, and Mg2+-bound CaBP1. The protein concentration was 126 μm in 20 mm Tris buffer, pH 7.5, containing 0.1 m KCl, 1 mm DTT supplemented with either 5 mm EGTA (apo-), 5 mm MgCl (Mg2+-bound), or 5 mm CaCl2 (Ca2+-bound). The scan rate was 60 K/h-1, and the cell volume was 0.511 ml. A two-state transition model (B → 2A) was fit to DSC scans of Mg2+-bound (B) and Ca2+-bound (C) CaBP1 as indicated by dotted lines. The fitting parameters were ΔHv = 287/341 cal/mol, ΔCp =-5.8/-12 kJ/°C, and Tm = 76.57/76.82 °C in B and C, respectively.
Hydrodynamic Analysis of CaBP1 Dimerization—Dynamic light scattering (DLS), static light scattering (SLS), and size exclusion chromatography (SEC) experiments were performed on CaBP1 to estimate the hydrodynamic radius and oligomerization state of the protein in solution. Static light scattering (SLS) measurements determined an average protein mass of 20.6 kDa for apoCaBP1, similar to the theoretical mass of the CaBP1 polypeptide (19.4 kDa). By contrast, the protein masses of Mg2+-bound (40.54 kDa) and Ca2+-bound (38.78 kDa) CaBP1 as determined by SLS suggest protein dimer formation. The second virial coefficient (A2) calculated from the SLS data were positive for Mg2+-bound CaBP1, suggesting moderate solubility, whereas negative A2 values for both apo- and Ca2+-bound CaBP1 indicated a tendency toward aggregation. The SEC elution volumes, calibrated against spherical protein standards, corresponded to molecular masses of 32, 28, and 27 kDa for apo-, Mg2+-bound, and Ca2+-bound CaBP1, respectively. Similar protein masses were also derived from glycerol gradient diffusion experiments (data not shown). The disparity in protein masses derived from SEC and SLS studies might be explained in part by calibration differences. The SEC standard curve was calibrated using highly spherical protein standards with similar charge densities. CaBP1, however, may have an elongated or otherwise nonspherical shape with internal flexibility like that of calmodulin (48). Therefore, the SLS analysis, employing a cylindrical shape model, may determine a more accurate protein mass in this case. Translational diffusion properties of CaBP1 measured by DLS provided an additional and independent measure of protein mass. The hydrodynamic radius (RH) of CaBP1 measured by DLS was somewhat variable with a broad size distribution (Fig. 6). The DLS size histograms showed polydispersities of 40, 20, and 25% for apo-, Mg2+-bound, and Ca2+-bound CaBP1, respectively, suggesting a heterogeneous population of protein species. The polydispersity suggests that CaBP1 may exhibit conformational heterogeneity or exist as an equilibrium mixture of monomer and dimer species. The SLS and DSC analyses stated above argue in favor of protein dimerization for the Mg2+-bound and Ca2+-bound forms of CaBP1. Consistent with this view, the hydrodynamic radii of both Mg2+- and Ca2+-bound forms of CaBP1 increase as a function of protein concentration measured below by pulsed-field gradient diffusion NMR studies. In summary, the hydrodynamic properties measured independently by SEC, DLS, and NMR suggest that CaBP1 forms a dynamic and relatively low affinity protein dimer in solution.
FIGURE 6.
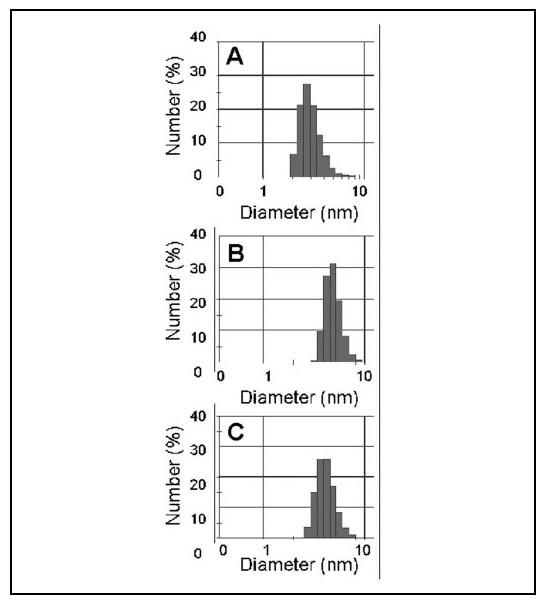
Dynamic light scattering size distribution histogram for apo- (A), Mg2+-bound (B), and Ca2+-bound (C) CaBP1. The median hydrodynamic diameter (and polydispersity) is 2.7 nm (40%), 4.8 nm (20%), and 4.2 nm (25%) for apo-, Mg2+-bound, and Ca2+-bound CaBP1, respectively.
Mg2+ and Ca2+ Stabilize Tertiary Structure of CaBP1—NMR spectroscopy was used to probe protein conformational changes in CaBP1 induced by Mg2+ and/or Ca2+ binding (Fig. 7). The peaks in the 1H-15N HSQC NMR spectra represent main chain and side chain amide groups and provide a residue-specific fingerprint of the overall protein conformation. The two-dimensional 1H-15H HSQC spectrum of apoCaBP1 exhibited poorly resolved and overlapping peaks with narrow chemical shift dispersion in the amide proton dimension (Fig. 7, left panel). The number of observed peaks was less than the expected number of amide groups (132 peaks versus 167 residues), and the intensities of many peaks were quite weak, perhaps due to exchange broadening caused by dimerization or conformational heterogeneity. The poor chemical shift dispersion suggests that apoCaBP1 adopts an unstructured molten-globule state similar to that described for the apo states of many other Ca2+-binding proteins such as GCAP-2 (21), Frq1 (22), CIB (30), calexcitin (49), protein S (50), and DREAM (29). However, circular dichroism analysis (data not shown) suggests that apoCaBP1 adopts a high degree of helical content, consistent with the formation of the four EF-hands, and that the helical content does not change much upon binding Mg2+ and/or Ca2+. Together, our structural studies suggest that apoCaBP1 adopts a native secondary structure but is in a flexible molten-globule state.
The HSQC spectrum of CaBP1 changed dramatically upon the addition of saturating Mg2+ (Fig. 7, middle panel). Mg2+ caused a greater number of peaks to appear (155 peaks versus 167 residues), and the NMR intensities were in general much more uniform than those of apoCaBP1. Mg2+ binding to CaBP1 substantially improved the NMR chemical shift dispersion and markedly increased the number of observable long range nuclear Overhauser effects, demonstrating that Mg2+-bound CaBP1 adopts a stable tertiary structure. Two downfield-shifted peaks appeared (assigned as Gly-40 and Gly-117) that are characteristic of conserved glycine residues at the 6-position of divalent metal occupied EF-hands and suggest that Mg2+ is bound at EF-1 and EF-3. The average peak width in the spectrum appears broader than expected for a monomeric protein, consistent with protein dimerization described above. Pulsed-field gradient diffusion NMR studies (51) determined a hydrodynamic radius of 2.7 nm (corresponding to a spherical molecular mass of 34 kDa) for Mg2+-bound CaBP1 at 500 μm protein concentration, consistent with mostly dimer species present under conditions for NMR.
The HSQC spectrum of CaBP1 changed even further upon the addition of saturating Ca2+ (Fig. 7, right panel). Significant spectral changes induced by the addition of saturating Ca2+ to the Mg2+-bound protein sample indicated that Ca2+-induced conformational changes are distinct and separate from the Mg2+-induced changes (Fig. 7, middle and right panels). Three downfield-shifted peaks near 10.5 ppm are characteristic of conserved glycine residues at the 6-position of Ca2+-occupied EF-hands (Gly-40, Gly-117, and Gly-154), consistent with Ca2+ bound at EF-1, EF-3, and EF-4. Additional unique peaks of Ca2+-bound CaBP1 (observed between 9 and 10 ppm) represent amino acid in residues EF-1, EF-3, and EF-4 altered structurally Ca2+ binding. The spectrum of Ca2+ by HSQC-saturated CaBP1 exhibited somewhat broadened peaks (like that of Mg2+-bound protein) with variable NMR intensities, consistent with protein dimerization. Pulsed-field gradient diffusion NMR studies determined a hydrodynamic radius of 2.8 nm, corresponding to a Ca2+-bound protein dimer.
Kinetic Structural Changes Probed by NMR—NMR spectra of CaBP1 were analyzed to probe kinetic structural changes at specific amino acid locations within the protein as a function of Mg2+ and/or Ca2+ (Figs. 8-10). The Mg2+- and Ca2+-induced spectral changes reflect mostly slow exchange processes on the chemical shift time scale, consistent with high affinity metal binding. The NMR intensities of representative amide resonances assigned to Gly-40 (EF-1), Val-78 (EF-2), Gly-117 (EF-3), and Gly137 (EF-4) are plotted as a function of Mg2+ concentration (Fig. 8A). These resonances (as well as many others assigned to Mg2+-bound CaBP1) increase monotonically in intensity as a function of adding up to 2 eq of Mg2+ per protein. After adding 2 or more eq of Mg2+, no further intensity change occurred, suggesting that two Mg2+ bind to CaBP1 at saturation. The Mg2+-induced spectral changes from residues in all four EF-hands suggest that Mg2+ binding induces a global and concerted conformational change throughout the protein.
FIGURE 8.
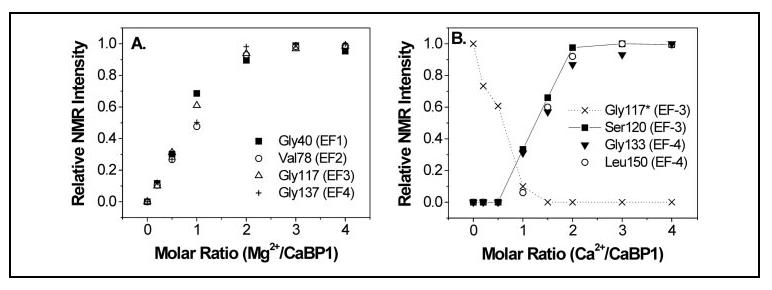
Relative NMR intensities of selected amide resonances from Fig. 7 plotted as a function of Mg2+ (A) and Ca2+ concentration (B).
FIGURE 10.
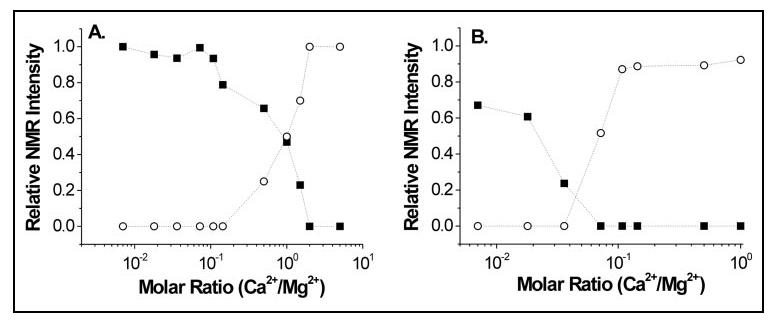
Relative NMR intensities of amide resonances assigned to Gly-40 (A) and Gly-117 (B) plotted as a function of increasing Ca2+ concentration in the presence of physiological Mg2+. The intensities of amide resonances at 10.35 ppm (Gly-40) and 10.52 ppm (Gly-117) of Mg2+-bound CaBP1 (black squares) represent concentration profiles that monitor Mg2+ dissociation from EF-1 and EF-3, respectively, in A and B. Intensities of resonances at 10.18 ppm (Gly-40) and 10.38 ppm (Gly-117) of Ca2+-bound CaBP1 (open circles) represent concentration profiles that monitor Ca2+ association to EF-1 and EF-3, respectively.
Amide NMR intensities of residues Ser-120 (EF-3) and Leu-150 (EF-4) are plotted as a function of Ca2+ concentration (Fig. 8B). These resonances (as well as others assigned to residues of EF-3 and EF-4 of Ca2+-bound CaBP1) increase monotonically in intensity as a function of Ca2+ up to 2 eq. After adding 2 or more eq of Ca2+, no further intensity change was detected, suggesting that two Ca2+ bind to CaBP1 in the presence of physiological levels of excess Mg2+ (5 mm). The Ca2+-induced spectral changes exhibited by residues in both EF-3 (Ser-120) and EF-4 (Leu-150) suggested that Ca2+ induces a protein conformational change in EF-3 and EF-4. By contrast, amide resonances assigned to residues of EF-1 and EF-2 did not exhibit significant Ca2+-induced spectral changes in the presence of physiological Mg2+ (data not shown), suggesting that EF-1 and EF-2 do not bind Ca2+ in the presence of excess Mg2+ and that the N-terminal domain does not change structure upon Ca2+ binding to EF-3 and EF-4.
Downfield-shifted amide proton chemical shifts (∼10-11 ppm) of conserved glycine residues at the 6-position of EF-hands generally are characteristic of divalent metal binding at these sites (Fig. 9). Amide proton chemical shifts observed for Gly-40 (10.38 ppm) and Gly-117 (10.58 ppm) of Mg2+-bound CaBP1 (Fig. 7, middle panel, and Fig. 9A) indicate that Mg2+ is bound at EF-1 and EF-3. The addition of 1 eq of Ca2+ to the protein causes severe broadening of the downfield peak at 10.58 ppm (Gly-117), whereas the peak at 10.38 ppm (Gly-40) remains relatively unchanged (Fig. 9B). Further addition of Ca2+ causes a new downfield peak to appear at 10.41 ppm (assigned to Gly-117), indicative of Ca2+ binding at EF-3 (Fig. 9C). A shoulder peak at 10.45 ppm (assigned to Gly-154) is indicative of Ca2+ binding at EF-4 (Fig. 9, C-F). The downfield peak at 10.38 ppm (Gly-40) persists although the Ca2+/Mg2+ molar ratio is less than 1 (Fig. 9E). At Ca2+/Mg2+ ratios greater than or equal to 1, a new downfield peak appears at 10.18 ppm assigned to Gly-40 that represents Ca2+ binding at EF-1 (Fig. 9, E-F). The lack of a downfield-shifted amide proton resonance for Gly-76 (6-position of EF-2) suggests that neither Ca2+ nor Mg2+ binds to EF-2, consistent with our Ca2+ binding analyses above (Figs. 2 and 3). In summary, EF-3 and EF-4 bind Ca2+, EF-1 binds Mg2+, and EF-2 binds neither Mg2+ nor Ca2+ under physiological conditions (5 mm Mg2+ and 0.1-10 μm Ca2+).
FIGURE 9.
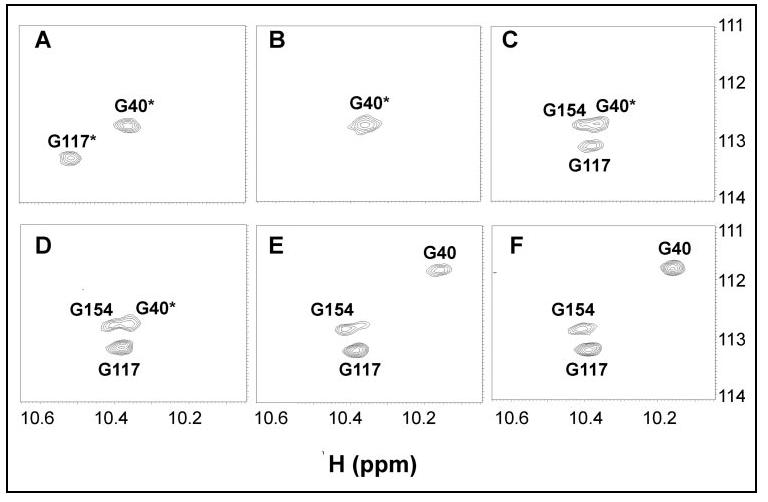
Downfield spectral region of 15N-1H HSQC NMR spectra of CaBP1 (200 μm) recorded as a function of increasing Ca2+ concentration in the presence of physiological Mg2+ (5 mm). The molar ratio of Ca2+/Mg2+ and {Ca2+/protein} in each case was 0.0 {0.0} (A), 0.04 {1.0} (B), 0.08 {2.0} (C), 0.16 {4.0} (D), 1.0 {25} (E), and 2.0 {50} (F). Asterisk indicates amide resonances assigned to Mg2+-bound CaBP1.
The amide NMR resonances of Gly-40 (EF-1) and Gly-117 were analyzed as a function (EF-3) of the Ca2+/Mg2+ ratio to determine the relative binding selectivity of Ca2+ versus Mg2+ (Fig. 10). The intensity profile of the amide resonance representing Gly-40 of Mg2+-bound CaBP1 monitors Mg2+ dissociation from EF-1 (black squares in Fig. 10A), and the intensity profile of the peak at (representing Gly40 of Ca2+-bound CaBP1) monitors Ca2+ 10.18 ppm binding to EF-1 (circles in Fig. 10A). The Mg2+ dissociation and Ca2+ open association curves for EF-1 in Fig. 10A intersect at a Ca2+/Mg2+ ratio of 1:1, suggesting that EF-1 binds Ca2+ and Mg2+ with equal selectivity. By contrast, the corresponding Mg2+ dissociation and Ca2+ association curves for EF-3 in Fig. 10B intersect at a Ca2+/Mg2+ ratio of much less than 1, suggesting that EF-3 binds Ca2+ with more than 10-fold selectivity over Mg2+.
DISCUSSION
In this study, we characterized the structural properties of Mg2+ and Ca2+ binding to the individual EF-hands of recombinant human CaBP1. Mg2+ binds constitutively to EF-1 under physiological conditions, Ca2+ binds functionally to EF-3 and EF-4, and neither Ca2+ nor Mg2+ binds to EF-2. The lack of Ca2+ binding to EF-2 is most likely the result of having Gly-75 at the 5-position of the EF-hand loop (Fig. 1), which lacks an oxygen-containing side chain needed for chelating Ca2+. Glycine at this position is conserved in the other CaBP members, implying that EF-2 must be disabled in the other family members as well. Our NMR analysis reveals that Mg2+ binding to CaBP1 induces a global conformational change throughout the protein, whereas Ca2+ induces localized conformational changes in EF-3 and EF-4. Mg2+ and Ca2+ cause distinct conformational changes that dramatically increase folding stability and promote protein dimerization. We propose that CaBP1 switches between structurally distinct Mg2+-bound and Ca2+-bound states under physiological conditions. These conformational states may play a role in the regulation of Ca2+ channels and other target proteins.
Constitutive Mg2+ Binding—The first EF-hand (EF-1) of CaBP1 binds Ca2+ with relatively low affinity (Fig. 2) and without selectivity over Mg2+ (Fig. 10A). As a consequence, EF-1 must be bound to Mg2+ and not Ca2+ under physiological conditions (0.1-10 μm Ca2+ and 5 mm Mg2+). The low Ca2+ affinity and loss of Ca2+ selectivity is likely due to Asp-46 instead of Glu at the 12-position of the binding loop in EF-1 (Fig. 1). Other EF-hand proteins like DREAM (29), myosin light chain (28), sarcoplasmic calcium-binding protein (52), and CIB (30) contain Asp at the 12-position of particular EF-hands and also exhibit a similar loss of Ca2+ selectivity. CaBP5 also contains Asp at the 12-position of EF-1, but curiously other CaBP members (e.g. CaBP2 and CaBP4) contain Glu (Fig. 1).
Glutamate at the 12-position of the EF-hand binding loop promotes high affinity and selective Ca2+ binding (28). The long side chain of glutamate places the carboxylate group close to the bound metal, enabling it to serve as a bidentate ligand that forms two coordinate covalent bonds with Ca2+, as seen in crystal structures of many EF-hand proteins (18, 19, 53, 54). The bidentate interaction is critical for forming a pentagonal bipyramidal ligand geometry around the bound Ca2+, in contrast to an octahedral ligand geometry favored by Mg2+. Hence, the bidentate interaction within the EF-hand has been postulated to be important for conferring Ca2+-binding specificity with high affinity (28, 55).
Replacing glutamate with aspartate at the 12-position lowers the Ca2+ binding affinity and selectivity as evidenced by EF-1 (Figs. 2 and 10). The low Ca2+ affinity may be the result of the shorter Asp side chain that places the carboxylate group further away from the bound metal. The shorter Asp side chain at the 12-position may also allow space for the binding of hydrated Mg2+ species, which is sterically forbidden by Glu at the 12-position. The dehydration energy of Mg2+ is much higher than that of Ca2+ (56-58). Normally, Ca2+ binds favorably to an EF-hand by shedding its bound water molecules, whereas Mg2+ remains hydrated and binds less favorably. Replacing Glu with Asp at the 12-position may increase the relative affinity for Mg2+ by permitting the binding of partially hydrated species. To summarize, an important structural determinant for metal binding selectivity of the EF-hand is the type of acidic side chain at the 12-position (Glu versus Asp) that can discriminate the different coordination number for Ca2+ versus Mg2+ (7 versus 6) and/or their different hydration energetics.
Differential Regulation of Ca2+ Channels by CaBP1 and Calmodulin—CaBP1 and calmodulin (CaM) both bind to L-type (CaV1.2) Ca2+ channels and differentially regulate channel activity (14). CaM binds constitutively to CaV1.2 and causes Ca2+-induced channel closure (59), whereas CaBP1 promotes channel opening (15). This antagonism may be explained in part by structural differences between CaBP1 and CaM. In this study we demonstrate that CaBP1 forms a dimer in solution in contrast with the monomeric structure of calmodulin. The dimeric structure of CaBP1 unfolds in one cooperative step (Fig. 5), suggesting that the two domains of CaBP1 may be structurally associated with each other, unlike the two noninteracting domains of CaM (45, 60). Another structural difference is that CaM binds four Ca2+, whereas CaBP1 binds functionally to only two Ca2+ at EF-3 and EF-4. CaM mutants that lack Ca2+ binding to EF-1 and EF-2 have very different functional properties compared with wild type (61, 62). Hence, the lack of Ca2+ binding to EF-1 and EF-2 of CaBP1 may be responsible for conferring its functional differences with CaM. Finally, CaPB1 binds constitutively to Mg2+ at EF-1 as described above, whereas CaM does not. Taken together, these structural differences may help to understand how CaBP1 and CaM differentially regulate CaV1.2 channels.
Implications for Target Recognition—Both Mg2+-bound and Ca2+-bound forms of CaBP1 were shown in this study to have stable tertiary structures, and both forms bind to Ca2+ channels (11-14). We propose that constitutive Mg2+ binding may be necessary for stabilizing the interaction of CaBP1 with protein targets in the absence of Ca2+. Mg2+ also stabilizes the tertiary structure of other EF-hand proteins such as GCAP-2 (32), myosin light chain (28), CIB (30), and DREAM (29) that similarly interact with protein or DNA targets in the absence of Ca2+. Ca2+-induced conformational changes in CaBP1 are localized to residues in the C-terminal domain (EF-3 and EF-4), implicating the C-terminal residues in making Ca2+-dependent contacts with the Ca2+ channel. By contrast, the N-terminal domain of CaBP1 does not change structure in response to Ca2+ binding, suggesting that N-terminal residues constitutively interact with the Ca2+ channel. Such an interaction may help explain the observation that CaBP1 binds to InsP3R even in the absence of Ca2+ (11, 12).
CaBP1 forms a protein dimer in solution that may be functionally important for channel regulation. We propose that a pair of CaBP1 dimers might come together at the cytosolic surface of the tetrameric InsP3R Ca2+ channel to form a 4-fold symmetric complex. Such a cytosolic interaction would allow CaBP1 to function like an iris in front of the channel pore and thereby modulate the passage of Ca2+ through the channel. Ca2+-induced conformational changes to CaBP1 might serve to constrict the “iris” and block the pore, which could explain the reduced Ca2+ permeability of InsP3R at high cytosolic Ca2+ levels (12). In addition, CaBP1 may induce allosteric changes within the channel protein that would indirectly control channel activity. Indeed, CaBP1 has been shown recently to interact with the regulatory N-terminal domain of both InsP3R (12, 63) and L-type Ca2+ channels (14). In the future, we plan to determine at atomic resolution the Ca2+-induced structural changes of CaBP1 and its interaction with target proteins in order to describe more thoroughly how CaBP1 modulates the activity of Ca2+ channels.
Acknowledgments
Acknowledgments—We thank Fred Schwarz and Nese Sari for help with calorimetry and NMR experiments.
Footnotes
This work was supported in part by Grants EY012347 and NS045909 (to J. B. A.) and EY08061 (to K. P.) from the National Institutes of Health. The costs of publication of this article were defrayed in part by the payment of page charges. This article must therefore be hereby marked “advertisement” in accordance with 18 U.S.C. Section 1734 solely to indicate this fact.
- CaBP
- calcium-binding protein
- DTT
- dithiothreitol
- InsP3Rs
- inositol 1,4,5-trisphosphate receptors
- DLS
- dynamic light scattering
- DSC
- differential scanning calorimetry
- HSQC
- heteronuclear single quantum coherence
- ITC
- isothermal titration calorimetry
- SEC
- size exclusion chromatography
- SLS
- static light scattering
- CaM
- calmodulin
REFERENCES
- Haeseleer F, Sokal I, Verlinde CL, Erdjument H, Tempst P, Pronin AN, Benovic JL, Fariss RN, Palczewski K. J. Biol. Chem. 2000;275:1247–1260. doi: 10.1074/jbc.275.2.1247. [DOI] [PMC free article] [PubMed] [Google Scholar]
- Haeseleer F, Imanishi Y, Sokal I, Filipek S, Palczewski K. Biochem. Biophys. Res. Commun. 2002;290:615–623. doi: 10.1006/bbrc.2001.6228. [DOI] [PubMed] [Google Scholar]
- Ikura M. Trends Biochem. Sci. 1996;21:14–17. [PubMed] [Google Scholar]
- Moncrief ND, Kretsinger RH, Goodman M. J. Mol. Evol. 1990;30:522–562. doi: 10.1007/BF02101108. [DOI] [PubMed] [Google Scholar]
- Palczewski K, Polans AS, Baehr W, Ames JB. BioEssays. 2000;22:337–350. doi: 10.1002/(SICI)1521-1878(200004)22:4<337::AID-BIES4>3.0.CO;2-Z. [DOI] [PubMed] [Google Scholar]
- Haynes LP, Tepikin AV, Burgoyne RD. J. Biol. Chem. 2004;279:547–555. doi: 10.1074/jbc.M309617200. [DOI] [PubMed] [Google Scholar]
- Menger N, Seidenbecher CI, Gundelfinger ED, Kreutz MR. Cell Tissue Res. 1999;298:21–32. doi: 10.1007/s004419900060. [DOI] [PubMed] [Google Scholar]
- Seidenbecher CI, Langnaese K, Sanmarti L, Boeckers TM, Smalla KH, Sabel BA, Garner CC, Gundelfinger ED, Kreutz MR. J. Biol. Chem. 1998;273:21324–21331. doi: 10.1074/jbc.273.33.21324. [DOI] [PubMed] [Google Scholar]
- Seidenbecher CI, Reissner C, Kreutz MR. Adv. Exp. Med. Biol. 2002;514:451–463. doi: 10.1007/978-1-4615-0121-3_27. [DOI] [PubMed] [Google Scholar]
- Laube G, Seidenbecher CI, Richter K, Dieterich DC, Hoffmann B, Landwehr M, Smalla KH, Winter C, Bockers TM, Wolf G, Gundelfinger ED, Kreutz MR. Mol. Cell. Neurosci. 2002;19:459–475. doi: 10.1006/mcne.2001.1078. [DOI] [PubMed] [Google Scholar]
- Yang J, McBride S, Mak DO, Vardi N, Palczewski K, Haeseleer F, Foskett JK. Proc. Natl. Acad. Sci.; U. S. A.. 2002. pp. 7711–7716. [DOI] [PMC free article] [PubMed] [Google Scholar]
- Kasri NN, Holmes AM, Bultynck G, Parys JB, Bootman MD, Rietdorf K, Missiaen L, McDonald F, De Smedt H, Conway SJ, Holmes AB, Berridge MJ, Roderick HL. EMBO J. 2004;23:312–321. doi: 10.1038/sj.emboj.7600037. [DOI] [PMC free article] [PubMed] [Google Scholar]
- Lee A, Westenbroek RE, Haeseleer F, Palczewski K, Scheuer T, Catterall WA. Nat. Neurosci. 2002;5:210–217. doi: 10.1038/nn805. [DOI] [PMC free article] [PubMed] [Google Scholar]
- Zhou H, Yu K, McCoy KL, Lee A. J. Biol. Chem. 2005;280:29612–29619. doi: 10.1074/jbc.M504167200. [DOI] [PubMed] [Google Scholar]
- Zhou H, Kim SA, Kirk EA, Tippens AL, Sun H, Haeseleer F, Lee A. J. Neurosci. 2004;24:4698–4708. doi: 10.1523/JNEUROSCI.5523-03.2004. [DOI] [PMC free article] [PubMed] [Google Scholar]
- Kinoshita-Kawada M, Tang J, Xiao R, Kaneko S, Foskett JK, Zhu MX. Pfluegers Arch. 2005;450:345–354. doi: 10.1007/s00424-005-1419-1. [DOI] [PubMed] [Google Scholar]
- Haeseleer F, Imanishi Y, Maeda T, Possin DE, Maeda A, Lee A, Reike F, Palczewski K. Nat. Neurosci. 2004;7:1079–1087. doi: 10.1038/nn1320. [DOI] [PMC free article] [PubMed] [Google Scholar]
- Babu YS, Bugg CE, Cook WJ. J. Mol. Biol. 1988;204:191–204. doi: 10.1016/0022-2836(88)90608-0. [DOI] [PubMed] [Google Scholar]
- Flaherty KM, Zozulya S, Stryer L, McKay DB. Cell. 1993;75:709–716. doi: 10.1016/0092-8674(93)90491-8. [DOI] [PubMed] [Google Scholar]
- Ames JB, Ishima R, Tanaka T, Gordon JI, Stryer L, Ikura M. Nature. 1997;389:198–202. doi: 10.1038/38310. [DOI] [PubMed] [Google Scholar]
- Ames JB, Dizhoor AM, Ikura M, Palczewski K, Stryer L. J. Biol. Chem. 1999;274:19329–19337. doi: 10.1074/jbc.274.27.19329. [DOI] [PubMed] [Google Scholar]
- Ames JB, Hendricks KB, Strahl T, Huttner IG, Hamasaki N, Thorner J. Biochemistry. 2000;39:12149–12161. doi: 10.1021/bi0012890. [DOI] [PubMed] [Google Scholar]
- Burgoyne RD, Weiss JL. Biochem. J. 2001;353:1–12. [PMC free article] [PubMed] [Google Scholar]
- Bourne Y, Dannenberg J, Pollmann VV, Marchot P, Pongs O. J. Biol. Chem. 2001;276:11949–11955. doi: 10.1074/jbc.M009373200. [DOI] [PubMed] [Google Scholar]
- Vijay-Kumar S, Kumar VD. Nat. Struct. Biol. 1999;6:80–88. doi: 10.1038/4956. [DOI] [PubMed] [Google Scholar]
- Zhou W, Qian Y, Kunjilwar K, Pfaffinger PJ, Choe S. Neuron. 2004;41:573–586. doi: 10.1016/s0896-6273(04)00045-5. [DOI] [PubMed] [Google Scholar]
- Linse S, Helmersson A, Forsen S. J. Biol. Chem. 1991;266:8050–8054. [PubMed] [Google Scholar]
- da Silva AC, Kendrick-Jones J, Reinach FC. J. Biol. Chem. 1995;270:6773–6778. doi: 10.1074/jbc.270.12.6773. [DOI] [PubMed] [Google Scholar]
- Osawa M, Dace A, Tong KI, Valiveti A, Ikura M, Ames JB. J. Biol. Chem. 2005;280:18008–18014. doi: 10.1074/jbc.M500338200. [DOI] [PubMed] [Google Scholar]
- Yamniuk AP, Nguyen LT, Hoang TT, Vogel HJ. Biochemistry. 2004;43:2558–2568. doi: 10.1021/bi035432b. [DOI] [PubMed] [Google Scholar]
- Brocard JB, Rajdev S, Reynolds IJ. Neuron. 1993;11:751–757. doi: 10.1016/0896-6273(93)90084-5. [DOI] [PubMed] [Google Scholar]
- Peshenko IV, Dizhoor AM. J. Biol. Chem. 2004;279:16903–16906. doi: 10.1074/jbc.C400065200. [DOI] [PubMed] [Google Scholar]
- Cox JA, Durussel I, Comte M, Nef S, Nef P, Lenz SE, Gundelfinger ED. J. Biol. Chem. 1994;269:32807–32813. [PubMed] [Google Scholar]
- Ames JB, Hamasaki N, Molchanova T. Biochemistry. 2002;41:5776–5787. doi: 10.1021/bi012153k. [DOI] [PubMed] [Google Scholar]
- Paulus H. Anal. Biochem. 1969;32:91–100. doi: 10.1016/0003-2697(69)90107-9. [DOI] [PubMed] [Google Scholar]
- Hendricks KB, Wang BQ, Schnieders EA, Thorner J. Nat. Cell Biol. 1999;1:234–241. doi: 10.1038/12058. [DOI] [PubMed] [Google Scholar]
- Chakrabarti MC, Schwarz FP. Nucleic Acids Res. 1999;27:4801–4806. doi: 10.1093/nar/27.24.4801. [DOI] [PMC free article] [PubMed] [Google Scholar]
- Schwarz FP, Puri KD, Bhat RG, Surolia A. J. Biol. Chem. 1993;268:7668–7677. [PubMed] [Google Scholar]
- Wiseman T, Williston S, Brandts JF, Lin LN. Anal. Biochem. 1989;179:131–137. doi: 10.1016/0003-2697(89)90213-3. [DOI] [PubMed] [Google Scholar]
- Papish AL, Tari LW, Vogel HJ. Biophys. J. 2002;83:1455–1464. doi: 10.1016/S0006-3495(02)73916-7. [DOI] [PMC free article] [PubMed] [Google Scholar]
- Clore GM, Gronenborn AM. Nat. Struct. Biol. 1997;4:849–853. [PubMed] [Google Scholar]
- Henzl MT, Larson JD, Agah S. Anal. Biochem. 2003;19:216–233. doi: 10.1016/s0003-2697(03)00288-4. [DOI] [PubMed] [Google Scholar]
- Gilli R, Lafitte D, Lopez C, Kilhoffer M, Makarov A, Briand C, Haiech J. Biochemistry. 1998;37:5450–5456. doi: 10.1021/bi972083a. [DOI] [PubMed] [Google Scholar]
- Biekofsky RR, Martin SR, McCormick JE, Masino L, Fefeu S, Bayley PM, Feeney J. Biochemistry. 2002;41:6850–6859. doi: 10.1021/bi012187s. [DOI] [PubMed] [Google Scholar]
- Masino L, Martin SR, Bayley PM. Protein Sci. 2000;9:1519–1529. doi: 10.1110/ps.9.8.1519. [DOI] [PMC free article] [PubMed] [Google Scholar]
- Tsalkova TN, Privalov PL. J. Mol. Biol. 1985;181:533–544. doi: 10.1016/0022-2836(85)90425-5. [DOI] [PubMed] [Google Scholar]
- McCubbin WD, Hincke MT, Kay CM. Can. J. Biochem. 1980;58:683–691. doi: 10.1139/o80-096. [DOI] [PubMed] [Google Scholar]
- Yang C, Jas GS, Kuczera K. J. Biomol. Struct. Dyn. 2001;19:247–271. doi: 10.1080/07391102.2001.10506736. [DOI] [PubMed] [Google Scholar]
- Gombos Z, Durussel I, Ikura M, Rose DR, Cox JA, Chakrabarti A. Biochemistry. 2003;42:5531–5539. doi: 10.1021/bi034047j. [DOI] [PubMed] [Google Scholar]
- Qi XF, Bagby S, Gombos Z, Ikura M, Chakrabarti A. Eur. J. Biochem. 2001;268:4653–4663. doi: 10.1046/j.1432-1327.2001.02388.x. [DOI] [PubMed] [Google Scholar]
- Altieri AS, Hinton DP, Byrd RA. J. Am. Chem. Soc. 1995;117:7566–7567. [Google Scholar]
- Wnuk W, Cox JA, Kohler LG, Stein EA. J. Biol. Chem. 1979;254:5284–5289. [PubMed] [Google Scholar]
- Herzberg O, James MN. J. Mol. Biol. 1988;203:761–779. doi: 10.1016/0022-2836(88)90208-2. [DOI] [PubMed] [Google Scholar]
- Vijay-Kumar S, Cook WJ. J. Mol. Biol. 1992;224:413–426. doi: 10.1016/0022-2836(92)91004-9. [DOI] [PubMed] [Google Scholar]
- Snyder EE, Buoscio BW, Falke JJ. Biochemistry. 1990;29:3937–3943. doi: 10.1021/bi00468a021. [DOI] [PMC free article] [PubMed] [Google Scholar]
- Eigen M, Hammes GG. Adv. Enzymol. Relat. Areas Mol. Biol. 1963;25:1–38. doi: 10.1002/9780470122709.ch1. [DOI] [PubMed] [Google Scholar]
- Sussman F, Weinstein H. Proc. Natl. Acad. Sci. U. S. A. 1989;86:7880–7884. doi: 10.1073/pnas.86.20.7880. [DOI] [PMC free article] [PubMed] [Google Scholar]
- Rashin AA, Honig B. J. Phys. Chem. 1985;89:5588–5593. [Google Scholar]
- Zuhlke RD, Pitt GS, Deisseroth K, Tsien RW, Reuter H. Nature. 1999;399:159–162. doi: 10.1038/20200. [DOI] [PubMed] [Google Scholar]
- Strynadka NC, James MN. Proteins. 1988;3:1–17. doi: 10.1002/prot.340030102. [DOI] [PubMed] [Google Scholar]
- Gao ZH, Krebs J, VanBerkum MF, Tang WJ, Maune JF, Means AR, Stull JT, Beckingham K. J. Biol. Chem. 1993;268:20096–20104. [PubMed] [Google Scholar]
- Stevens-Truss R, Beckingham K, Marletta MA. Biochemistry. 1997;36:12337–12345. doi: 10.1021/bi970973k. [DOI] [PubMed] [Google Scholar]
- Bosanac I, Yamazaki H, Matsu-Ura T, Michikawa T, Mikoshiba K, Ikura M. Mol. Cell. 2005;17:193–203. doi: 10.1016/j.molcel.2004.11.047. [DOI] [PubMed] [Google Scholar]


