

Abstract
When dissimilar images are presented to the two eyes, they compete for perceptual dominance, so that only one image is visible at a time while the other one is suppressed. Neural correlates of such binocular rivalry have been found at multiple stages of visual processing including striate and extrastriate visual cortex. However, little is known about the role of subcortical stages in binocular rivalry. Here, we used fMRI to measure neural activity in the human LGN while subjects viewed contrast-modulated gratings presented dichoptically. Neural activity in the LGN correlated strongly with the subjects' reported percepts such that activity increased when a high-contrast grating was perceived, and decreased when a low-contrast grating was perceived. Our results provide evidence for a functional role of the LGN in binocular rivalry and suggest that the LGN, traditionally viewed as the gateway to the visual cortex, may be an early gatekeeper of visual awareness.
Binocular rivalry occurs when the input from the two eyes cannot be fused to a single, coherent percept. Rivalry can be induced experimentally by simultaneously presenting dissimilar stimuli to the two eyes, such as a vertical and a horizontal grating. Rather than being perceived as a merged plaid, the two stimuli compete for perceptual dominance such that subjects perceive only one stimulus at a time while the other is suppressed from visual awareness1. Predominance of one stimulus usually lasts for several seconds, and the extent to which any pair of stimuli competes depends on stimulus properties such as their relative contrast or spatial frequency2,3. Since the subjects' perceptual experiences change over time while the retinal stimulus remains constant, binocular rivalry provides an intriguing paradigm to study the neural basis of visual awareness4.
The neural mechanisms underlying binocular rivalry have been much debated. Single-cell physiology studies in monkeys trained to report their perceptual experiences during rivalry have identified neural correlates of binocular rivalry mainly in higher-order visual areas5. Responses of about 90% of neurons in inferior temporal cortex increase when the neuron's preferred stimulus is perceived during rivalry, whereas only about 40% of neurons in areas V4 and MT show such response enhancement, and even fewer in early visual areas V1 and V26,7. From these findings, it has been concluded that binocular rivalry is mediated by competitive interactions between binocular neural populations representing the two stimuli at multiple stages of visual processing subsequent to the convergence of the input from the two eyes in V1 (pattern competition account). Alternatively, it has been suggested that binocular rivalry reflects competition between monocular channels either at the level of V1, or the lateral geniculate nucleus (LGN) and is mediated by mutual inhibition and reciprocal feedback suppressing the input from one eye1,8. This interocular competition account has recently been supported by fMRI studies showing signal fluctuations correlated with subjects' perceptual experiences in area V19 and more importantly in the monocular V1 neurons representing the blind spot10. Neural activity of monocular V1 neurons varies according to subjects' perceptual reports, and the signal amplitudes measured during rivalry and during presentations of identical monocular stimuli are similar in magnitude, suggesting that rivalry is completely resolved in monocular V1 neurons. However, little is known about the role of subcortical processing stages such as the LGN in binocular rivalry.
The LGN is the thalamic station in the projection of the visual pathway from retina to V111. It is typically organized into six layers, each of which receives input from either the contralateral or ipsilateral eye and contains a retinotopic map of the contralateral hemifield registered to those of other layers. In addition to retinal afferents, the LGN receives input from multiple sources including V1 and the thalamic reticular nucleus (TRN). Given its anatomical organization and afferent projections the LGN has often been considered as a possible site of suppression in accounts of interocular competition8,12. However, single-cell recording studies in the LGN of awake monkeys viewing rivalrous stimuli have not found evidence to support this hypothesis13. We investigated the functional role of the human LGN in binocular rivalry using fMRI in subjects viewing dichoptically presented contrast-modulated grating stimuli9.
We found that fMRI signals in the LGN and in V1 were strongly correlated with the perceptual experiences reported by the subjects during binocular rivalry. FMRI signals increased when subjects perceived a high-contrast stimulus and decreased when they perceived a low-contrast stimulus. A similar response pattern was obtained when subjects viewed sequences of non-rivalrous physical alternations of the same stimuli that mimicked their perceptions during rivalry. Our results provide the first evidence that neural correlates of binocular rivalry can be found as early as in the human LGN. These findings support interocular competition accounts of binocular rivalry, including models of selective suppression of eye-specific LGN layers. They further indicate that neural correlates of conscious perception are not confined to cortical processing.
Results
Five subjects participated in consecutive scanning sessions for the rivalry experiment and the physical alternation experiment. In the rivalry experiment, superimposed sinusoidal gratings were viewed through red/green filter glasses; a high-contrast, green, horizontal grating was presented to one eye and a low-contrast, red, vertical grating was presented to the other eye (Fig. 1a). The gratings filled an annular aperture centered on a fixation point and reversed contrast to minimize adaptation. Their orthogonal orientations prevented the two gratings from being fused and induced rivalrous perceptual oscillations between them. The luminance contrasts and reversal rates of the gratings were individually optimized in each subject to maximize the perceptual duration of the weaker, low-contrast stimulus (Table 1). Subjects maintained fixation and reported which grating was perceived by pressing a button; periods of mixed ‘piecemeal’ percepts of the two stimuli were indicated with a third button. In the physical alternation experiment, sequential monocular presentations of the same grating stimuli were used to produce similar perceptual, but different physical stimulation than during rivalry. The low- or high-contrast gratings were presented to one eye while a uniform field was presented to the other eye (Fig. 1b) using the identical temporal sequence of stimulus alternations reported by the same subject in the rivalry experiment. During these physical alternations, subjects maintained fixation and pressed buttons to indicate which grating they viewed.
Figure 1.
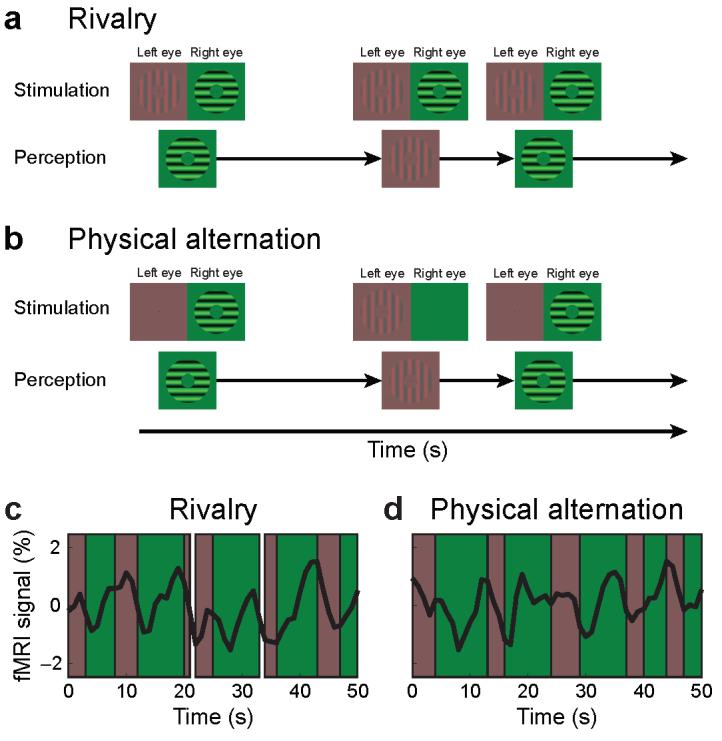
Experimental Design and Stimuli. (a) Subjects viewed red/green orthogonal sinusoidal gratings through matching filter glasses, with the higher-contrast horizontal grating visible to only one eye and the lower-contrast vertical grating to the other eye. Despite the invariant physical stimulation, subjects experienced binocular rivalry and reported switches in perception between horizontal and vertical gratings every few seconds. (b) The perceptual experience during rivalry was simulated in a physical stimulus alternation condition by presenting the green or the red grating to one eye, and a uniform field to the other eye. The presentation times of alternating stimuli were identical to perceptual durations of the corresponding grating that the same subject reported during rivalry. All stimulus parameters were identical to the rivalry condition. In both experiments, subjects maintained fixation and indicated by button presses which grating was perceived. (c) Fluctuations of fMRI signals related to the perception of the high- and low-contrast gratings during binocular rivalry are evident in the raw time series of fMRI signals in the LGN from a single subject (S1). Phases during which the subject perceived high-contrast horizontal, or low-contrast vertical gratings are shaded in green and red, respectively. Periods of intermittent piecemeal perception are not colored. (d) Raw time series of fMRI signals in the LGN from the same subject viewing physical stimulus alternations.
Table 1.
Stimulus conditions and perceptual dominance
| Subject | Eye | Contrast | Grating | High contrast | Low contrast | ||||
|---|---|---|---|---|---|---|---|---|---|
| dominance | L/H (%) | Cyc/deg | M | % | Σ | M | % | Σ | |
| S1 | Left | 17/70 | 0.4 | 9.3 | 68 | 116 | 4.0 | 29 | 112 |
| S2 | Right | 17/70 | 0.4 | 4.2 | 55 | 201 | 3.0 | 39 | 201 |
| S3 | Right | 14/70 | 0.5 | 6.1 | 31 | 77 | 4.9 | 35 | 108 |
| S4 | Right | 20/70 | 0.4 | 5.1 | 49 | 306 | 3.5 | 34 | 309 |
| S5 | Right | 20/70 | 0.4 | 4.0 | 59 | 346 | 2.0 | 28 | 332 |
The high-contrast grating was presented to the dominant eye. The contrast and spatial frequency of the gratings were adjusted individually to maximize the contrast difference while maintaining an adequate predominance duration. Psychophysical data for average perceptual duration (M), predominance—the percentage of time that the subject reported perceiving each of the two stimuli (%) –- and number of occurrences (Σ) are reported for perceptions of high-contrast and low-contrast gratings. Predominance times do not total 100%; subjects perceived a piecemeal mixture of the stimuli during the remaining time.
In the LGN and V1, fMRI signals increase monotonically with stimulus contrast. Reliable fMRI signals are typically evoked by stimuli of more than 10% contrast, and signal saturation occurs with stimuli of more than 35% contrast14-16. Therefore, the different fMRI signal amplitudes evoked by low- and high-contrast stimuli can be used as a ‘neural signature’ of the LGN and V1 populations representing these stimuli, as previously shown for physical and rivalrous alternations of contrast-modulated gratings in V19. In the physical alternation experiment, we expected fMRI signals to increase when the high-contrast gratings were shown monocularly and to decrease when the low-contrast gratings were presented. Further, we reasoned that, if the subjects' perceptual experiences during rivalry were reflected in fMRI signals, signal fluctuations similar to those obtained during physical alternations should occur in relation to the reported percepts despite the unchanging retinal stimulation. We used the contrast-modulated grating paradigm in rivalry and physical alternation conditions to first, replicate previous findings showing signal fluctuations related to perceptual experience during rivalry in V19,10; second, to investigate whether such signal fluctuations were present already in the LGN; and third, to compare signals obtained during rivalry and physical alternation conditions in the two areas.
To identify regions of interest in the thalamus and visual cortex, in each scanning session, flickering checkerboard stimuli were presented in alternation to the right and left visual hemifield while the subjects maintained fixation. The checkerboards activated the right and left LGN and V1 (Supplemental Figure 1). The locations of the functional LGN activations were consistent across subjects and experiments and in close correspondence to the anatomical locations of the LGN. The mean activated LGN volume was 190 mm3 averaged across subjects and experiments, similar to previous studies15,17,18. Activations in area V1 were identified based on anatomical or retinotopic mapping criteria.
Behavioral Results
In the rivalry experiment, subjects experienced vigorous perceptual alternations between the horizontal high-contrast, and the vertical low-contrast gratings. The perceptual durations were random and distributed according to a gamma-shaped function for both stimuli, as typically found in rivalry studies2 (Supplemental Figure 2). In accordance with classical findings2, the perceptually more salient high-contrast grating was perceived significantly longer than the low-contrast grating with some variability among subjects (Table 1). In the group of subjects, the high-contrast stimulus was perceived on average for 5.1 ± 0.09 s (mean ± s.e.m.) compared to 3.1 ± 0.09 s for the low-contrast stimulus (P≤ .001; Supplemental Figure 2). On average, subjects reported about 160 perceptual switches between the gratings; piecemeal perception occurred during 3–34% of the time (Table 1).
FMRI results: Binocular rivalry
FMRI signals in the LGN and V1 fluctuated while subjects perceived the rivalrous grating stimuli. The signals increased when subjects reported perceiving the high-contrast grating and decreased when they reported perceiving the low-contrast stimulus. These signal modulations can be seen in the raw time series of fMRI signals from single subjects. For example, subject S1 reported a perceptual switch from the low-contrast to the high-contrast grating, which was followed by a sharp increase in the fMRI signal of the LGN (periods shaded in green, Fig. 1c). When the subject's perceptual experience changed to the low-contrast grating, shown shaded in red, the fMRI signals tended to decrease. Periods of piecemeal perception are not colored and were rare in this subject.
To analyze the fMRI time series obtained in the rivalry experiment in relation to subjects' behavioral responses, an event-related analysis was performed for the LGN and V1 of each subject. Mean fMRI signals were derived by averaging the fMRI time series across all events of a reported switch to the high-contrast grating and, separately, across all events of a reported switch to the low-contrast grating. The events were time-locked to the subjects' manual responses and spanned a period of 4 s before and 9 s after each response. The mean fMRI signals were then averaged across subjects and are presented as group data (n = 5) for the LGN and V1 (Fig. 2). Although both gratings were constantly present during rivalry, the fMRI signals in both LGN and V1 increased shortly after switches to the percept of the high-contrast grating (black lines) and decreased when the percept changed to the low-contrast grating (gray lines). The peak or trough of the hemodynamic signals occurred 3–6 s after the perceptual switches. Activity related to the percept of the high contrast grating was significantly different from that related to the percept of the low contrast grating for 5 data points in the LGN panel (Fig. 2a) and for 4 data points in the V1 panel (Fig. 2b) (one-tailed t-test, *P ≤ .05; **P ≤ .01; *** P ≤ .001 in Fig. 2). Despite individual differences, the basic response pattern associated with the perceptual reports of high- and low-contrast gratings was present in each individual subject and was significantly different for at least the peak response (one-tailed t-test, P ≤ .05, Fig. 3).
Figure 2.
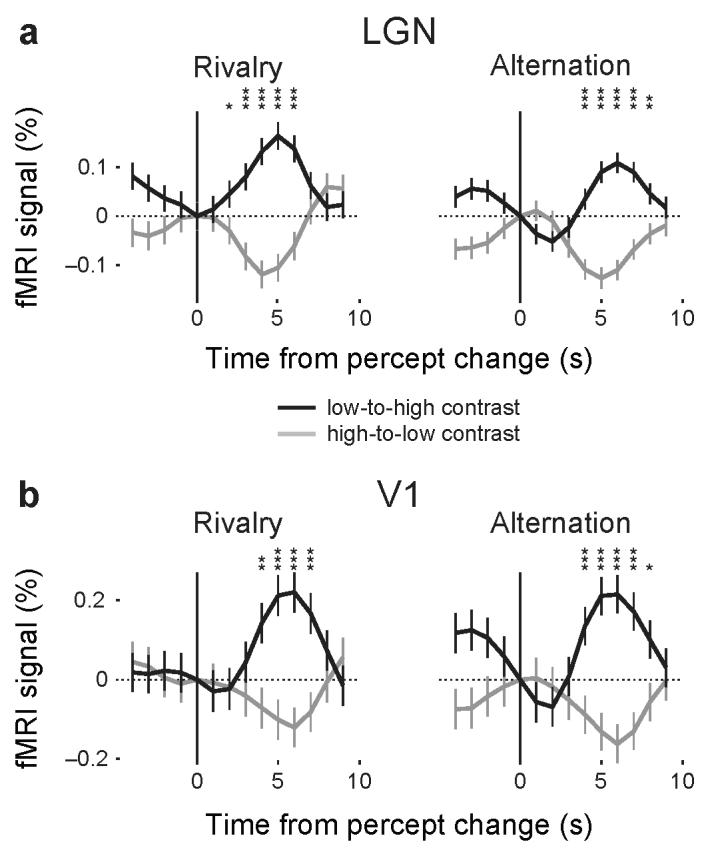
FMRI signals during binocular rivalry and physical stimulus alternations in the LGN and V1 (group analysis). Data from the LGN (a) and V1 (b) of five subjects were combined across left and right hemispheres. Neural activity was averaged across all occurrences of perceptual switches from the low-contrast to the high-contrast grating (black curve) and across those from the high-contrast to the low-contrast grating (gray curve). The responses were time-locked to each subject's manual response, as indicated by the black vertical line at time point 0, and are shown within a relative time window of −4 to +9 s. All events were normalized, so that responses at time point 0 started at a value of 0% signal change. The vertical bar on each curve indicates one standard error of the mean. Asterisks indicate significant differences between data points of the two curves (one-tailed t-test, *P < .05; **P < .01; ***P < .001). Left: results from rivalry scans. Right: results from physical stimulus alternation scans. Neural activity increased when subjects perceived the high-contrast stimulus and decreased when they perceived the low-contrast stimulus during rivalry conditions. A similar response pattern was found when subjects viewed physical alternations of the same gratings.
Figure 3.
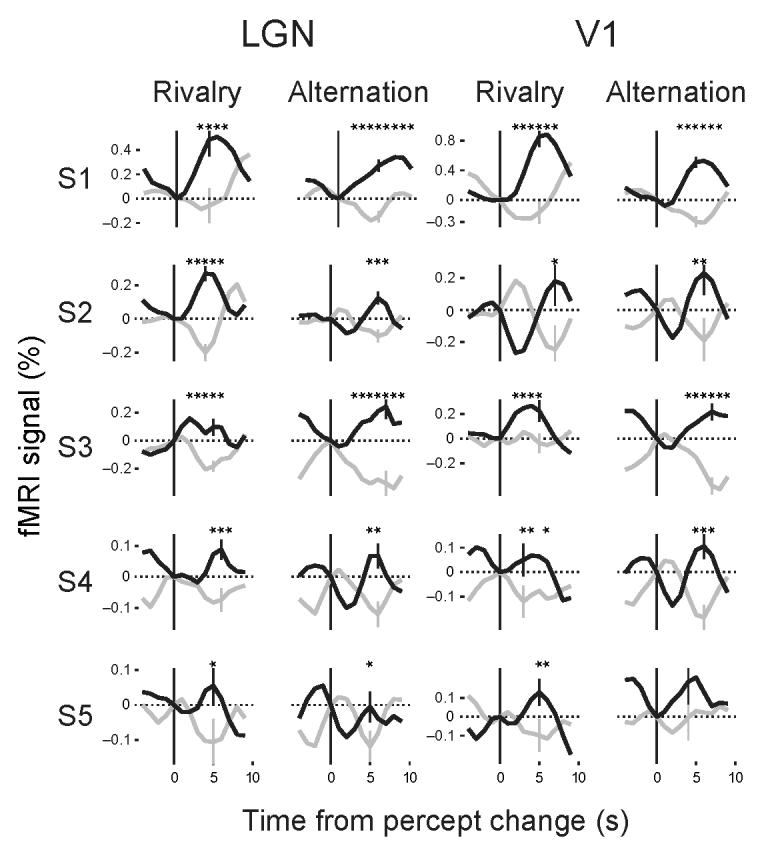
FMRI signals during binocular rivalry and physical stimulus alternations in the LGN and V1 (single subjects). Mean fMRI time series obtained while subjects (S1–S5) perceived the high-contrast grating (black) or low-contrast grating (gray) during binocular rivalry or physical stimulus alternations in the LGN and V1. In each subject, the fMRI signal increased in the LGN, and similarly in V1, after transitions to the high-contrast stimulus and decreased after transitions to the low-contrast stimulus. Differences in fMRI time series for high- and low-contrast in the rivalry scan were statistically significant in each individual subject in both LGN and V1 for at least the data point at the peak value of the curves (one-tailed t-test, P < .05). Within subjects, the shape of the curves is remarkably similar in the LGN and V1. Time series for physical alternations scans show a similar pattern as compared to those from the rivalry scans. The error bars indicate the standard error of the mean at the data point with the most significant response difference between the green and red curve in each panel. Other conventions are as in Fig. 2.
Notably, the averaged fMRI activity associated with perceptual switches between high- and low-contrast stimuli showed a very similar pattern in the LGN and V1, as is apparent from both the group and the single subject analyses (Figs. 2 and 3). The fMRI signal amplitudes in LGN and V1 were strongly correlated in individual subjects (r = .92, P≤ .03, Supplementary Fig. 3). In agreement with previous studies15,17,18, the amplitudes of fMRI signals were smaller in the LGN than in V1 in both rivalry and physical alternation conditions. Importantly, the signal fluctuations related to perceptual experiences of contrast-modulated gratings during rivalry found in V1 confirm previous findings9,10. The findings of similar signal fluctuations in the LGN extend these studies by demonstrating that the LGN is the first visual processing stage at which neural correlates of binocular rivalry can be observed.
To further examine the correlation between perception and the fMRI signal, we investigated whether the perceptual durations of each stimulus predominance period, which varied in the group from 2–15 s, were reflected in the single trial fMRI signals. The perceptual events were sorted into four time categories (2–3 s, 3–5 s, 5–7 s, > 7s), and the fMRI signals were averaged selectively for each category. The mean fMRI time series of the group of subjects was plotted as a function of the perceptual duration for the LGN (Fig. 4a). Because subjects rarely experienced the low-contrast stimulus for longer than 7 s, the fMRI signal for this time category is only shown for the high-contrast stimulus. It is evident that with increasing duration of the percept the amplitude and the dispersion of the fMRI signal increased. The area under a Gaussian fit to the averaged time series of fMRI signals was linearly correlated with the perceptual duration in both the LGN and V1 (r = .98, P < .0001, Fig. 4b). The tight coupling of perceptual durations and the magnitude of the fMRI signals suggests that both structures form a neural circuit that is closely linked to visual awareness during binocular rivalry.
Figure 4.
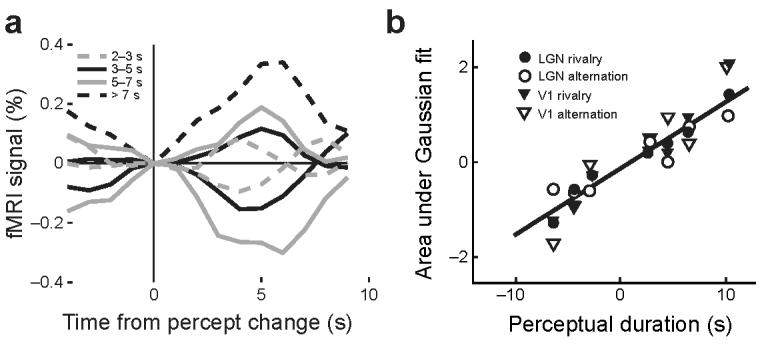
Effect of perceptual duration on fMRI signals. (a) FMRI time series averaged across subjects and time-locked to the subjects' manual responses are shown for the LGN as a function of perceptual duration. Dashed gray lines: 2–3 s, solid black lines: 3–5 s, solid gray lines: 5–7 s, dotted black line: >7 s (only shown for transitions to the high-contrast grating). The amplitude and duration of fMRI signals increased with increasing duration of the percept. (b) The time series data shown in (a) were fit to a Gaussian function. The area under these fitted curves was linearly correlated with the perceptual duration in the LGN (r = .98, P ≤ .02). A similar correlation was observed with fMRI responses measured during stimulus alternations in the LGN and during both conditions in area V1. The abscissa of each dot corresponds to the average duration of trials in the corresponding perceptual duration category. Positive values indicate perceptual durations of the high-contrast grating; negative values indicate those of the low-contrast grating.
FMRI results: Physical stimulus alternations
If the fluctuations in the fMRI signal measured during the binocular rivalry experiment indeed reflected a neural signature of the perception of the high- and low-contrast stimuli, then mimicking the rivalrous perceptions using physical alternations of the identical stimuli should yield similar results. As expected from the contrast response functions of the LGN and V1, fMRI signals increased with presentations of the high-contrast grating and decreased with presentations of the low-contrast grating. This pattern of responses, strikingly similar to that obtained during rivalry, was observed in the raw time series (as shown for the LGN in Fig. 1d), the group data (Figs. 2a and b), and the single subject data (Fig. 3).
Previous studies have quantitatively compared the magnitude of modulations in fMRI signals obtained during rivalry and physical stimulus alternations9,10,19. It has been reasoned that if the difference in signal amplitudes evoked by the two physical stimuli is similar to that evoked by the rivalrous stimuli, the invisible stimulus must be completely suppressed during rivalry. We computed a suppression index by first determining the difference between the signal amplitudes evoked by the rivalrous or physically alternated stimuli in each subject and then calculating the ratio of this difference in the rivalry condition to that in the physical alternation condition (Fig. 5). An index value of 1 indicates equal differences in signal magnitudes found in the two conditions and can be interpreted as complete suppression of the invisible stimulus during rivalry. Index values between 0 and 1 indicate a smaller amplitude difference during rivalry than during physical alternations and may be interpreted as partial suppression. In the LGN, the level of suppression varied among our subjects from index values of 0.5 to 1.3, and in each subject the level of suppression was similar between LGN and V1 (Supplementary Table 1). Three of the five subjects (S1, S2, S5) had index values, within the error, of 1 indicating a complete suppression of the competing input during rivalry at the level of the LGN. The two other subjects (S3, S4) had smaller index values suggesting only partial suppression. Interestingly, subjects S1, S2, S5 reported piecemeal perception rarely for only 3, 6, and 13% of the time, whereas subjects S3 and S4 reported piecemeal more frequently, for 34 and 17% of the time, respectively. Less complete suppression might yield more frequent piecemeal perception, and it is possible that suboptimal viewing conditions and less stable percepts during rivalry contributed to the weaker signal amplitudes in these subjects. However, given the small number of subjects that were tested in this study, more evidence in support of such an idea will be needed. Overall, the amount of piecemeal perception was loosely correlated with the suppression index (r = −.78, P= .11).
Figure 5.
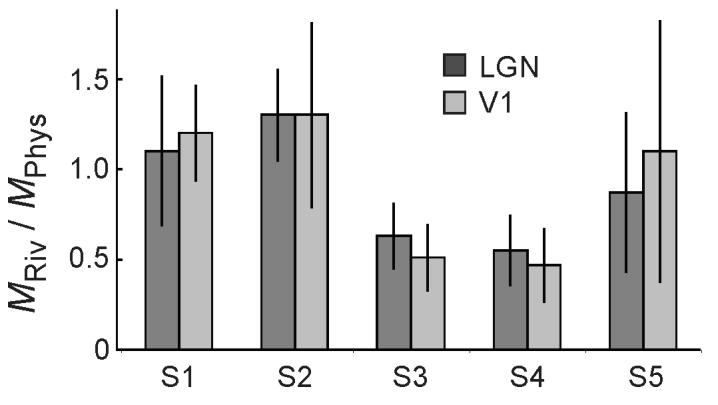
Comparison of fMRI signals during binocular rivalry and physical stimulus alternations in the LGN and V1. For each subject, the difference in signal amplitudes evoked by the high- and low-contrast gratings during rivalry or physical alternations was computed in both LGN and V1. The ratio of the signal differences obtained during rivalry to those obtained during physical alternations is plotted for each subject and area. The fractions of fMRI signals evoked during rivalry and physical alternations were similar in the LGN (dark bar) and in V1 (light bar). Vertical bars indicate s.e.m.
Discussion
Here, we showed that neural activity correlates with visual awareness as early as in the human LGN by demonstrating systematic fluctuations of fMRI signals associated with the subjects' perceptual experiences during binocular rivalry. When superimposed orthogonal, contrast-modulated gratings were viewed dichoptically, fMRI signals increased in the LGN and V1 when subjects reported perceiving the high-contrast grating and decreased when subjects reported perceiving the low-contrast grating. The signal fluctuations observed during rivalry were similar to those evoked by physical alternations of the same monocular stimuli. The signal amplitudes evoked during rivalry ranged among subjects from 50–130% relative to those evoked by the physical alternations and were similar in the LGN and V1 for each subject. Since the input to the monocular LGN layers was unchanged during the perceptual oscillations, the modulation in LGN activity must be attributed to interactions within the nucleus or to modulatory inputs from other brain regions, such as feedback from V1. Importantly, in both the LGN and V1, the magnitude and dispersion of fMRI signals evoked during rivalry were correlated with the duration of the subjects' perceptual experience suggesting that neural activity at the earliest stages of visual processing reflect both the content and duration of the percept and is therefore closely linked to visual awareness during binocular rivalry.
Previous neuroimaging studies of binocular rivalry have measured correlations between the subjects' perceptual experiences and neural activity in V19,20,21, including the monocular representation of the blind spot10. Our results confirm these findings by demonstrating similar correlations of fMRI signals in relation to perceptual states in area V1 and extend them by demonstrating that neural correlates related to perceptual experiences during binocular rivalry exist already at a subcortical processing stage, the LGN of the thalamus. Importantly, the latter finding provides physiological evidence in support of interocular competition accounts that assume inhibitory interactions of monocular channels prior to binocular convergence1,8,12.
Advocates of interocular competition accounts have considered the LGN as a possible site at which the invisible stimulus is suppressed during binocular rivalry. Neurons in the LGN are exclusively monocular, with inputs from each eye segregated into separate layers. These adjacent laminae form an ideal substrate for inhibitory interactions between the two eyes, which would allow the signal from one eye to be selectively suppressed. Binocular interactions, predominantly inhibitory, have been widely reported in both monkey22-24 and cat LGN25-30 and might provide a neural substrate in producing rivalry. These inhibitory interactions may be mediated by several anatomical pathways including interneurons extending between LGN layers, corticogeniculate feedback from striate cortex, which comprises about 30% of the input to the LGN, or modulatory input from the TRN, which provides another 30% of the modulatory LGN input11. One possibility is that feedback from binocular neurons in layer 6 of V131,32 to monocular LGN layers could provide a descending control signal indicating whether stimuli are binocularly fused and regulating the strength of the inhibitory network8. The importance of feedback from V1 in controlling the observed LGN activity cannot be overstressed. With our current temporal resolution it is not possible to determine whether the LGN is controlling V1 activity or merely inherits the binocular resolution that might take place in a higher cortical area. Another possibility is that the TRN, which receives inputs from V1, several extrastriate areas and the pulvinar, may serve as a node where several cortical areas and thalamic nuclei of the visual system can interact to exert additional control in modulating thalamocortical transmission through inhibitory connections to LGN neurons33. It should be noted that these possibilities are not mutually exclusive. Taken together, based on its anatomy and the organization of its retinal and cortical feedback input the LGN appears to be in an ideal position to play an important functional role in binocular rivalry, as suggested by our present findings.
The present and previous findings of neural correlates of binocular rivalry at the earliest stages of visual processing9,10,20,21 contradict results from single-cell physiology studies. The percentage of neurons whose firing rates correlates with the perceptual experiences of monkeys trained to report perceptual switches during binocular rivalry progressively increases across a hierarchy of cortical visual areas5-7. The vast majority of neurons in higher-order visual areas, but only a small percentage of almost exclusively binocular neurons in early visual cortex exhibits increased activity when their preferred stimulus is perceived during rivalry. Most strikingly, although an early study reported a neural correlate of rivalry in the LGN of anesthetized cats30, an involvement of the LGN in binocular rivalry has not been confirmed in further single cell recording studies from cat LGN using a similar approach25 and has also not been established in single-cell recordings from the LGN of awake monkeys13. The apparent discrepancies between single-cell recording and functional brain imaging studies have been discussed in terms of interspecies differences, eye movement confounds, or differences between the BOLD signal and single unit activity elsewhere9 and will not be repeated here. In our view, it is possible that measures of neural activity at a population level such as fMRI may be better suited to uncover large-scale modulatory activity. Small modulatory effects that cannot be reliably found by measuring neural activity at the single- or multi-unit level may be revealed when summed across large populations of neurons. Such a notion is supported by the finding that the BOLD signal correlates better with local field potentials, which reflect the synaptic input to an area, rather than single- or multi-unit activity34. For example, modulatory inputs may have little effects on the spiking rate of single units but will still evoke strong responses in the BOLD signal. Thus, the discrepancies between previous electrophysiological and fMRI studies of binocular rivalry may be explained by sub-threshold modulations that are not reflected in the spiking output of neurons.
Although we were not able to image the individual layers of the LGN due to spatial resolution limits of our fMRI technique, comparing the fMRI signals in the LGN during rivalry and during physical alternations of the same monocular stimuli may provide a measure of the degree of suppression among the layers. It has been reasoned in previous studies that, if binocular rivalry were fully resolved, one would predict similar magnitudes in signal fluctuations for perceived changes during rivalry as compared to physical stimulus changes, indicating that the input from the invisible stimulus was completely suppressed9,10,19. In the LGN, this would be instantiated as a suppression of activity in the eye-specific layers. Previous studies have reported 50–85% of signal amplitudes during rivalry as compared to physical alternations in V19, suggesting partial suppression of the competing input, or equal responses during rivalry and physical alternations in monocular V1 neurons10, suggesting complete suppression. Our results confirm both of these findings by demonstrating individual differences: in three subjects, essentially complete suppression was obtained with equal signal amplitudes during rivalry and physical alternations, while in two subjects, only partial suppression was found with smaller signal amplitudes during rivalry as compared to physical alternations. Notably, both of these latter subjects perceived a high proportion of piecemeal blends, which may indicate suboptimal viewing conditions and overall less stable percepts during rivalry. It is also possible that individual differences in response criteria contributed to this variability. Such factors may lead to weaker signals during rivalry as compared to non-ambiguous physical alternations and may account for the individual differences found here and in previous studies9.
Alternative possibilities need to be considered in interpreting our findings of signal fluctuations related to subjects' perceptual experiences in the LGN and V1. Since neural activity in the LGN is considerably modulated by visual attention17, one possibility is that subjects paid more attention to the high- than to the low-contrast stimulus, and that the observed signal fluctuations were caused by attentional switches. This interpretation is not satisfying, however, since the attentional demands of the task did not differ between the stimuli. If anything, the lower-contrast grating demanded more volitional attention since its predominance time tended to be shorter. Switches to the high-contrast stimulus might initially capture attention, but the activity that we observed was sustained over several seconds and was closely linked to the perceptual duration reported by the subjects. Another possibility is that systematic differences in eye movement patterns related to viewing the vertical and horizontal gratings confounded the neural activity patterns obtained with these stimuli. We were not able to measure eye movements in the MR scanner because the filter glasses that the subjects were wearing during the experiments obscured their eyes. However, our control studies outside the scanner indicate that there were no differences in eye movement patterns related to the two grating stimuli. Taken together, it seems unlikely that our findings could be sufficiently explained in terms of attentional modulation of neural activity or eye movement confounds.
Our studies showed that neural activity closely linked to the duration and content of conscious perception was not confined to cortical processing as previously thought35,36, but occured already at the thalamic level. Much remains to be learned about the complex thalamic circuitry that subserves conscious perception in the LGN. We conclude from our studies that the LGN appears to be the first stage in the processing of visual information at which neural correlates of visual awareness during binocular rivalry can be found. Our findings further suggest the need to revise the traditional view of the LGN as a mere gateway to the visual cortex. The LGN may, in fact, serve among a network of widely distributed cortical and subcortical brain systems as an early gatekeeper of visual awareness.
Methods
Subjects, visual stimuli and tasks
Five healthy subjects (3 male; 22–36 years old; normal or corrected-to-normal visual acuity) gave written informed consent for participation in the study, which was approved by the Institutional Review Panel of Princeton University. All subjects received training prior to the scanning sessions to assure that subjects were able to report their perceptual experiences during binocular rivalry.
The rivalrous stimulus consisted of a pair of superimposed horizontal and vertical sinusoidal gratings (0.4–0.5 cpd) that were presented within an annulus (1.8–5.4°) centered at the fixation point. When viewed through red and green filter glasses, only the horizontal grating was visible to the dominant eye, and the vertical grating to the other eye (Fig. 1a). The two gratings also differed in color and luminance contrast. The vertical red grating was presented at 14–20% contrast and at a mean luminance of 0.5 cd/m2 when viewed through the matching filter. The horizontal green grating was presented at 70% contrast with a mean luminance of 0.6 cd/m2. Each grating reversed contrast at a frequency of 1.1–1.4 Hz to avoid adaptation. Stimulus contrasts and reversal rates were individually adjusted for each subject to maximize the perceptual duration of the weaker stimulus (Table 1). Subjects were instructed to maintain fixation and to report their perceptual experience by pressing one of three buttons corresponding to the vertical red or horizontal green grating, or phases of an unstable piecemeal blend of the two.
The perceptual experience during rivalry was simulated in a physical stimulus alternation condition through the presentation of the green or the red grating to one eye, and a uniform field to the other eye (Fig. 1b). The presentation times of alternating stimuli were identical to perceptual durations of the corresponding grating that the same subject reported during rivalry. In order to mimic the smooth transitions that were perceived during rivalry, stimuli were sinusoidally faded into each other over a 1 s period. Contrasts, colors and mean luminances were identical to the rivalry condition. As in the rivalry condition, subjects indicated by button presses which grating was viewed while maintaining fixation.
Neural representations of the peripheral annulus in the LGN and area V1 were localized by presenting a flickering checkerboard stimulus (contrast reversing at 8 Hz) in blocks of 16 s alternating between the right and left hemifield (Supplemental Figure 1)17. Subjects were instructed to maintain fixation during these presentations.
Data acquisition and analysis
Subjects participated in one or two scanning sessions for the rivalry experiment and an additional session for the physical alternation experiment. Data were acquired with a 3 T head scanner (Allegra, Siemens, Erlangen, Germany) using a standard head coil. Functional images were taken with a gradient echo, echo planar sequence (TR = 1 s for rivalry/physical alternation scans and 2 s for localizer scans, flip angle = 64° for rivalry/physical alternation scans and 90° for localizer scans, TE = 30 ms, 64 × 64 matrix). Sixteen axial slices (3 mm thickness, in-plane resolution 3 × 3 mm2) covering the thalamus and visual cortex were acquired in 6 series of 272 volumes each for rivalry and physical alternation scans and 6 series of 128 volumes for localizer scans. A high-resolution anatomical scan of the whole brain (MPRAGE sequence, TR = 2.5 s, TE = 4.3 ms, flip angle = 8°, 256 × 256 matrix, 1 mm3 resolution) was acquired in the same session to align the functional images.
Data were analyzed using AFNI (http://afni.nimh.nih.gov/afni). The functional images were motion-corrected to the image acquired nearest in time to the anatomical scan, and normalized to percent signal change by dividing the time series by its mean intensity. Regions of interest (ROIs) in the LGN and V1 were defined based on activations obtained in the localizer scans. A square-wave function reflecting the contrast of left versus right visual hemifield stimulation was convolved with a gamma-variate function37 to generate an idealized response function, which was used as a regressor of interest in a multiple regression in the framework of the general linear model38. Additional regressors were included to account for variance due to baseline shifts between time series, linear drifts within time series, and head motion. Statistical maps were thresholded at P < .01 and overlaid on anatomical scans. LGN activations were identified based on contiguous voxels in its anatomical location15,17,18. V1 activations were identified based on their location in the calcarine sulcus and on retinotopic mapping using standard procedures in three subjects18,39. Data from the LGN and V1 were combined across hemispheres. Subjects who did not exhibit bilateral LGN activation were excluded from the study.
Event-related fMRI time series analyses were performed on all activated voxels within a given ROI. Linear and quadratic signal trends were removed and time series were low-pass filtered through a convolution with a three-point width Hamming window. Mean time series of fMRI signals were calculated separately for switches from the high-to the low-contrast grating and vice versa by averaging across all events during which subjects reported a perceptual switch within a restricted window of −4 to +9 s relative to the manual response. All events were normalized, so that responses at time point 0 started at a value of 0% signal change. Perceptual durations less than 2 s were excluded from this analysis because they elicited fMRI signals too weak to be distinguished from noise. Differences in mean fMRI signals during switches from low-to-high contrast and high-to-low contrast were tested for significance at each of the nine data points following the behavioral response with a two-sample, one-tailed t-test. The lengths of the subjects' perceptual experiences and the resulting fMRI activity were analyzed by grouping all single trials into one of four categories of perceptual duration (2–3 s; 3–5 s; 5–7 s; > 7 s). The mean fMRI signals were fit via nonlinear least squares to a Gaussian and parameterized as the area under the curve, . A suppression index was defined by first determining the difference between the response amplitudes obtained for the two rivalrous stimuli and then calculating the ratio of this difference for the rivalry scan to the difference obtained for the physical alternation scan. An index value of 1 indicates fluctuations of equal magnitude during rivalry and physical alternation conditions and could be interpreted as complete suppression of the invisible stimulus. Index values between 0 and 1 indicate smaller amplitudes during rivalry than during physical alternations and could be interpreted as partial suppression.
Eye movement control
Given that the two rivalrous stimuli were gratings perpendicular to each other, we considered the possibility that the two stimuli elicited different patterns of eye movements, thereby confounding the results obtained in the LGN and V1. Because the filter glasses obscured the subjects' eyes during the scanning experiments, it was not possible to monitor eye movements directly during these experiments. Instead, we performed a behavioral control experiment outside the scanner by monitoring eye movements in all five subjects using an infrared eye-tracking device (ASL Model 5000 control unit and standard Model 504 remote optics, Applied Science Laboratories, Bedford, MA) while they viewed 20 alternating 8 s blocks of the vertical and horizontal grating stimuli without wearing filter glasses. No significant differences in mean eye position, standard deviation of eye position, or mean eye velocity were observed in either the vertical or horizontal direction (paired two-tailed t-test, P > .05), indicating that there were no obvious differences in fixation or eye movements when subjects viewed the two gratings.
Supplementary Material
Acknowledgements
We thank K. Weiner for help with manuscript preparation. This study was supported by NIH grants R01MH-64043, P50MH-62196, and T32 MH065214. K.W. was also supported by the German National Academic Foundation and the German Academic Exchange Service.
References
- 1.Blake R. A neural theory of binocular rivalry. Psychol. Rev. 1989;96:145–167. doi: 10.1037/0033-295x.96.1.145. [DOI] [PubMed] [Google Scholar]
- 2.Levelt WJ. Binocular Brightness Averaging And Contour Information. Br. J. Psychol. 1965;56:1–13. doi: 10.1111/j.2044-8295.1965.tb00939.x. [DOI] [PubMed] [Google Scholar]
- 3.Mueller TJ, Blake R. A fresh look at the temporal dynamics of binocular rivalry. Biol. Cybern. 1989;61:223–232. doi: 10.1007/BF00198769. [DOI] [PubMed] [Google Scholar]
- 4.Crick F, Koch C. Consciousness and neuroscience. Cereb. Cortex. 1998;8:97–107. doi: 10.1093/cercor/8.2.97. [DOI] [PubMed] [Google Scholar]
- 5.Sheinberg DL, Logothetis NK. The role of temporal cortical areas in perceptual organization. Proc. Natl. Acad. Sci. U. S. A. 1997;94:3408–3413. doi: 10.1073/pnas.94.7.3408. [DOI] [PMC free article] [PubMed] [Google Scholar]
- 6.Logothetis NK, Schall JD. Neuronal correlates of subjective visual perception. Science. 1989;245:761–763. doi: 10.1126/science.2772635. [DOI] [PubMed] [Google Scholar]
- 7.Leopold DA, Logothetis NK. Activity changes in early visual cortex reflect monkeys' percepts during binocular rivalry. Nature. 1996;379:549–553. doi: 10.1038/379549a0. [DOI] [PubMed] [Google Scholar]
- 8.Lehky SR, Blake R. Organization of binocular pathways: Modeling and data related to rivalry. Neural Comput. 1991;3:44–53. doi: 10.1162/neco.1991.3.1.44. [DOI] [PubMed] [Google Scholar]
- 9.Polonsky A, Blake R, Braun J, Heeger DJ. Neuronal activity in human primary visual cortex correlates with perception during binocular rivalry. Nat. Neurosci. 2000;3:1153–1159. doi: 10.1038/80676. [DOI] [PubMed] [Google Scholar]
- 10.Tong F, Engel SA. Interocular rivalry revealed in the human cortical blind-spot representation. Nature. 2001;411:195–199. doi: 10.1038/35075583. [DOI] [PubMed] [Google Scholar]
- 11.Sherman SM, Guillery RW. Exploring the Thalamus. Academic Press; San Diego: 2001. [Google Scholar]
- 12.Lehky SR. An astable multivibrator model of binocular rivalry. Perception. 1988;17:215–228. doi: 10.1068/p170215. [DOI] [PubMed] [Google Scholar]
- 13.Lehky SR, Maunsell JH. No binocular rivalry in the LGN of alert macaque monkeys. Vision Res. 1996;36:1225–1234. doi: 10.1016/0042-6989(95)00232-4. [DOI] [PubMed] [Google Scholar]
- 14.Boynton GM, Engel SA, Glover GH, Heeger DJ. Linear systems analysis of functional magnetic resonance imaging in human V1. J. Neurosci. 1996;16:4207–4221. doi: 10.1523/JNEUROSCI.16-13-04207.1996. [DOI] [PMC free article] [PubMed] [Google Scholar]
- 15.Kastner S, et al. Functional imaging of the human lateral geniculate nucleus and pulvinar. J. Neurophysiol. 2004;91:438–448. doi: 10.1152/jn.00553.2003. [DOI] [PubMed] [Google Scholar]
- 16.Schneider KA, Kastner S. Visual responses of the human superior colliculus: A high-resolution fMRI study. J. Neurophysiol. 2005 doi: 10.1152/jn.00288.2005. [DOI] [PubMed] [Google Scholar]
- 17.O'Connor DH, Fukui MM, Pinsk MA, Kastner S. Attention modulates responses in the human lateral geniculate nucleus. Nat. Neurosci. 2002;5:1203–1209. doi: 10.1038/nn957. [DOI] [PubMed] [Google Scholar]
- 18.Schneider KA, Richter MC, Kastner S. Retinotopic organization and functional subdivisions of the human lateral geniculate nucleus: a high-resolution functional magnetic resonance imaging study. J. Neurosci. 2004;24:8975–8985. doi: 10.1523/JNEUROSCI.2413-04.2004. [DOI] [PMC free article] [PubMed] [Google Scholar]
- 19.Tong F, Nakayama K, Vaughan JT, Kanwisher N. Binocular rivalry and visual awareness in human extrastriate cortex. Neuron. 1998;21:753–759. doi: 10.1016/s0896-6273(00)80592-9. [DOI] [PubMed] [Google Scholar]
- 20.Lee SH, Blake R. V1 activity is reduced during binocular rivalry. J Vis. 2002;2:618–626. doi: 10.1167/2.9.4. [DOI] [PubMed] [Google Scholar]
- 21.Lee SH, Blake R, Heeger DJ. Traveling waves of activity in primary visual cortex during binocular rivalry. Nat. Neurosci. 2005;8:22–23. doi: 10.1038/nn1365. [DOI] [PMC free article] [PubMed] [Google Scholar]
- 22.Rodieck RW, Dreher B. Visual suppression from nondominant eye in the lateral geniculate nucleus: a comparison of cat and monkey. Exp. Brain Res. 1979;35:465–477. doi: 10.1007/BF00236765. [DOI] [PubMed] [Google Scholar]
- 23.Marrocco RT, McClurkin JW. Binocular interaction in the lateral geniculate nucleus of the monkey. Brain Res. 1979;168:633–637. doi: 10.1016/0006-8993(79)90319-6. [DOI] [PubMed] [Google Scholar]
- 24.Schroeder CE, Tenke CE, Arezzo JC, Vaughan HG., Jr. Binocularity in the lateral geniculate nucleus of the alert macaque. Brain Res. 1990;521:303–310. doi: 10.1016/0006-8993(90)91556-v. [DOI] [PubMed] [Google Scholar]
- 25.Sengpiel F, Blakemore C, Harrad R. Interocular suppression in the primary visual cortex: a possible neural basis of binocular rivalry. Vision Res. 1995;35:179–195. doi: 10.1016/0042-6989(94)00125-6. [DOI] [PubMed] [Google Scholar]
- 26.Pape HC, Eysel UT. Binocular interactions in the lateral geniculate nucleus of the cat: GABAergic inhibition reduced by dominant afferent activity. Exp. Brain Res. 1986;61:265–271. doi: 10.1007/BF00239516. [DOI] [PubMed] [Google Scholar]
- 27.Sanderson KJ, Bishop PO, Darian-Smith I. The properties of the binocular receptive fields of lateral geniculate neurons. Exp. Brain Res. 1971;13:178–207. doi: 10.1007/BF00234085. [DOI] [PubMed] [Google Scholar]
- 28.Schmielau F, Singer W. The role of visual cortex for binocular interactions in the cat lateral geniculate nucleus. Brain Res. 1977;120:354–361. doi: 10.1016/0006-8993(77)90914-3. [DOI] [PubMed] [Google Scholar]
- 29.Singer W. Inhibitory binocular interaction in the lateral geniculate body of the cat. Brain Res. 1970;18:165–170. doi: 10.1016/0006-8993(70)90463-4. [DOI] [PubMed] [Google Scholar]
- 30.Varela FJ, Singer W. Neuronal dynamics in the visual corticothalamic pathway revealed through binocular rivalry. Exp. Brain Res. 1987;66:10–20. doi: 10.1007/BF00236196. [DOI] [PubMed] [Google Scholar]
- 31.Livingstone MS, Hubel DH. Psychophysical evidence for separate channels for the perception of form, color, movement, and depth. J. Neurosci. 1987;7:3416–3468. doi: 10.1523/JNEUROSCI.07-11-03416.1987. [DOI] [PMC free article] [PubMed] [Google Scholar]
- 32.Lund JS, Boothe RG. Interlaminar connections and pyramidal neuron organisation in the visual cortex, area 17, of the Macaque monkey. J. Comp. Neurol. 1975;159:305–334. [Google Scholar]
- 33.Guillery RW, Feig SL, Lozsadi DA. Paying attention to the thalamic reticular nucleus. Trends Neurosci. 1998;21:28–32. doi: 10.1016/s0166-2236(97)01157-0. [DOI] [PubMed] [Google Scholar]
- 34.Logothetis NK, Guggenberger H, Peled S, Pauls J. Functional imaging of the monkey brain. Nat. Neurosci. 1999;2:555–562. doi: 10.1038/9210. [DOI] [PubMed] [Google Scholar]
- 35.Crick F, Koch C. Are we aware of neural activity in primary visual cortex? Nature. 1995;375:121–123. doi: 10.1038/375121a0. [DOI] [PubMed] [Google Scholar]
- 36.Lumer ED, Friston KJ, Rees G. Neural correlates of perceptual rivalry in the human brain. Science. 1998;280:1930–1934. doi: 10.1126/science.280.5371.1930. [DOI] [PubMed] [Google Scholar]
- 37.Cohen MS. Parametric analysis of fMRI data using linear systems methods. Neuroimage. 1997;6:93–103. doi: 10.1006/nimg.1997.0278. [DOI] [PubMed] [Google Scholar]
- 38.Friston KJ, et al. Statistical parametric maps in functional imaging: a general linear approach. Hum. Brain Mapp. 1995;1:189–210. [Google Scholar]
- 39.Sereno MI, et al. Borders of multiple visual areas in humans revealed by functional magnetic resonance imaging. Science. 1995;268:889–893. doi: 10.1126/science.7754376. [DOI] [PubMed] [Google Scholar]
Associated Data
This section collects any data citations, data availability statements, or supplementary materials included in this article.