Abstract
The epithelial Na+ channel (ENaC) has three subunits; the expression of each can be regulated. Liddle's syndrome is caused by an activating mutation in the C-terminus of either the beta or gamma subunit. We used a doxycycline-regulated adenovirus system to express varying levels of human γENaC in renal collecting duct (M1 cell) monolayers. Increasing levels of wild type γhENaC produced a 2.5 fold enhancement of Na+ transport. Expression of a truncated C-terminus produced less protein than wild type or a γY627A missense mutation. However, either of these mutations produced a ~4-fold increase in Na+ transport despite the different levels of protein expression. Unexpectedly, overexpression of a marginally detectable amount of γhENaC was sufficient to produce a full increase in Na+ transport; further increase in protein expression produced no further increase in Na+ transport. Steroid treatment increased Na+ transport to a similar absolute magnitude in control monolayers and in monolayers expressing all types of γhENaC. Withdrawal of steroids after 24 hours produced a decline in Na+ transport over 8 hours in monolayers expressing wild type but not the Liddle's mutation. Using treatment with brefeldin A to estimate the disappearance rate constants, we found progressively slower disappearance rates in monolayers overexpressing γhENaC and the Liddle's mutant. Calculated insertion rates were slower for the Liddle's mutant than for wild type despite increasing rates of Na+ transport. These results raise questions regarding previously held assumptions about the behavior of ENaC.
The epithelial Na+ channel (ENaC) i is comprised of three homologous subunits, each of which is a separate gene product. The long-term regulation of this channel is critical for Na+ homeostasis and blood pressure regulation. This fact is clearly demonstrated by gain-of-function defects that produce inappropriately large Na+ absorption by the collecting duct and cause hypertension. In addition, loss-of-function mutations produce salt wasting and low blood pressure (1-3). Of the mechanisms responsible for long-term regulation of ENaC, adrenocorticosteroid hormones are the most intensely studied and are of central importance in effecting the regulation necessary to match Na+ excretion with intake.
Most genetic mutations in ENaC that increase function in the absence of steroid stimulation are localized to the carboxy termini of the beta and gamma subunits (1;3). The domain of central importance is the PY motif, PPPXYXXL. This PY motif interacts with the ubiquitin ligase Nedd4-2 via its WW domains which ultimately results in retrieval of ENaC complexes from the surface and reduction of Na+ transport (4-7). Missense mutations of the PY motif or truncations of the C-termini of either β- or γENaC that include this motif produce activation of ENaC (1).
These Liddle's mutations have provided a possible link to understanding steroid activation of ENaC. There is now convincing evidence that steroids increase expression of sgk1, which can in turn phosphorylate Nedd4-2 and by so doing reduce the strength of its interaction with the PY motif of ENaC (4;5;7;8). This evidence supports the idea that steroid hormones and Liddle's mutations share a common mechanism of activating ENaC.
The present experiments were designed to address the following questions: a) Does increasing γENaC protein in a collecting duct cell line (M1 cells) increase ENaC activity? b) Does expression of a Liddle's mutation in the gamma subunit increase Na+ transport in these cells? c) Do steroids further increase transport in either setting? We selected M1 cells as a model because they have a functioning ENaC (9;10), display a robust response to steroids (11;12), and represent a mammalian (mouse) genetic background which might serve as a convenient model for further investigations into the mechanisms regulating ENaC function. Furthermore, our preliminary data showed that M1 cells have very little γENaC protein. The results provide evidence that a doxycycline-regulated adenovirus system can be used to vary the amount of protein expressed in these cells. Expression of the Liddle's mutations produced more Na+ transport than did wild-type γENaC, a result that further supports the role of these mutations in producing hypertension. Unexpectedly, we found that only very small amounts of γENaC protein were sufficient to produce these effects and that further increasing protein expression did not increase ENaC activity.
Experimental Procedures
Cell culture and electrical measurements.. M1 cells, a mouse collecting duct line, were a generous gift from Geza Fejes-Toth (12). Cells were grown in Corning T-75 culture flasks in DMEM:Ham's F12 + 10% fetal bovine serum and gentamicin (50 μg/ml). The medium was changed 3 times per week. To subculture the cells, the flasks were rinsed and incubated with 3 ml 0.25% trypsin/1 mM EDTA in phosphate-buffered saline for 15 minutes. When the cells had detached from the flask, 10 ml of the growth medium was added. The resulting cell suspension was centrifuged for 5 minutes at 100xg, and the pellet resuspended in growth medium. Flasks were subcultured weekly at a 1:10 ratio.
M1 cells were seeded at confluent density (20 μg DNA/cm2) on 12- or 30-mm Millicell PCF filters pretreated with human placental collagen using the previously described protocol (13;14). The cells were grown 3 days on filters in DMEM:Ham's F12 supplemented with insulin (5 μg/ml), transferrin (5 μg/ml), triiodothyronine (5 nM), Na selenite (10 nM), gentamicin (50 μg/ml), bovine serum albumin (10 g/l), and dexamethasone (5 nM) at which time they were confluent monolayers and albumin was removed. After measurement of the electrical parameters, the filters were randomized to treatment groups using a Latin square procedure according to the short-circuit current (Isc) as described (15). Steroid treatment was a combination of 100 nM each of aldosterone and dexamethasone. The medium was changed on day 3 and daily thereafter. Adenovirus was applied after randomization and allowed to incubate in the apical solution for 4 h. When indicated, doxycycline (DOX) was added at the time of exposure to the adenovirus. Monolayers treated with steroids also were treated with 1,000 ng/ml DOX, since extensive preliminary data indicated that such monolayers when infected with adenovirus without DOX had a high incidence of loss of RT and protein, probably because of cell death.
H441 cells, a human airway epithelial cell line, were grown, passaged, and plated at confluent density on Millicell PCF filters as described (16).
Measurements of transepithelial resistance (RT) and Isc were made under sterile conditions by placing the 12 mm Millicell filters into modified Ussing chambers (Jim's Instrument's, Iowa City, IA) with a University of Iowa voltage clamp (15;17). All measurements were made at 37° C in growth medium. Measured in this way, all but about 1 μA/cm2 of the Isc is inhibited by benzamil, indicating that the magnitude of the Isc reflects Na+ transport via ENaC.
Construction of adenovirus. The replication deficient adenoviral expression system used for these experiments is similar to the commercially available Ad5-TRE system (Clontech). Briefly, the process involves cloning the gene product of interest into a shuttle vector for production of Ad5 TRE viral particles in 293 cells. This viral construct consists of a promoter (TRE) that is activated by a transactivator (TA) protein which drives production of the gene product of interest. The TA is unable to bind to the TRE in the presence of tetracycline (or its analog doxycycline, DOX). The TA protein is produced by a second viral construct (tTA) that is coinfected with the Ad5 TRE vector. Coexpression of the tTA and the Ad5 TRE vectors in the absence of DOX produces the gene product of interest. Expression of the Ad5 TRE without the tTA or in the presence of high concentrations of DOX with tTA permits little or no expression of the gene product of interest.
The shuttle vector used to make the Ad5-TRE constructs was manufactured in the University of Iowa Vector Core Facility by replacing the RSV promoter with the TRE promoter. The clone encoding human gamma ENaC (γhENaC or γWT) has been previously described (18;19) and was subcloned into the shuttle vector. All constructs included a myc epitope attached to the C-terminus. The two modifications of γWT were a substitution of an alanine for tyrosine at position 627 (γY627A) using the QuikChange® method (Stratagene), and truncation of the C-terminus at position 576 (γK576X) using the ExSite™ method (Stratagene). All constructs were sequenced to ensure that there were no errors introduced in the process of mutation. We constructed two forms of γK576X since the first construct had a slightly different upstream (noncoding) sequence from the γWT construct. Since both constructs produced identical results, we report only one value for the constructs. Production of viral particles and titration to determine multiplicity of infection (MOI) was conducted in the University of Iowa Vector Core Facility.
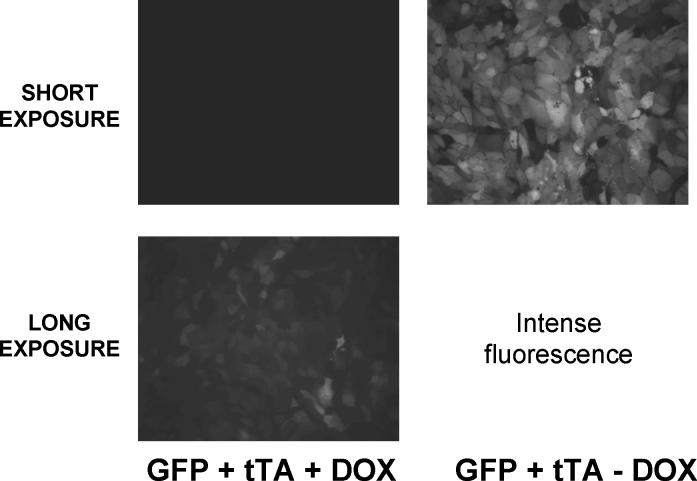
Unless otherwise indicated, cells were infected at an MOI of 10 (both the transactivator and the γhENaC vectors) based on extensive preliminary experimentation to determine optimal conditions. As determined using both Ad5 beta galactosidase and Ad5-TRE green fluorescent protein (GFP) constructs, this concentration produced infection of >90% of M1 cells on filters when applied to confluent monolayers from the apical surface (see figure 1).
Figure 1:
Ad5 TET-OFF Green Fluorescent Protein (GFP) coinfected with transactivator (tTA) into M1 cells with or without 1000 ng/ml doxycycline (DOX) for 2 days. Long exposure shows a small amount of GFP expression even in the presence of DOX.
Immunoblot and immunocytochemistry. For immunoblot analysis, monolayers on filters were washed with ~2 ml PBS, the filters were cut out and placed in a 1.5 ml Eppendorf tube. For each filter in the tube (usually 4), 100 μl of Laemmli buffer (2% SDS, 8 mM TRIS buffer, 40 mM DTT and glycerol) was added. Cells on plastic (35 mm dish) were solubilized in 0.5 ml Laemmli buffer. All samples were incubated for 15 min at 60° C and stored at 4° C until used. Protein analysis was conducted by fluorescence assay (20) with bovine albumin as standard. The indicated amount of total protein was separated by SDS-PAGE using 8% acrylamide, and transferred to ImmobilonNC (Millipore) using a FB-SDB-2020 semi-dry blotting unit (Fisher Biotech). For analysis of myc epitope-tagged proteins, the nitrocellulose membrane was blocked in phosphate-buffered saline with 0.05% Tween 20 (PBST) plus 5% milk for 20 min followed by 1 hour of a 1:5000 dilution of the primary anti-myc (mouse monoclonal) antibody. The membrane was washed twice in PBST and incubated for 1 hour in a 1:5000 dilution of the secondary HRPconjugated anti mouse antibody. After 3 PBST washes and 2 PBS washes, the HRP was detected by exposing the membrane to SuperSignal® West Pico Chemiluminescent Substrate (Pierce), exposing the membrane to x-ray film for 2-30 min and developing in a Kodak developer. For analysis of γ-hENaC using the sheep antibody, the nitrocellulose filter was blocked with 10% normal donkey serum (Jackson ImmunoResearch Laboratories, West Grove, PA) for 1 hr, incubated with 1:2000 dilution of the sheep antiserum for 1 hr, then incubated with 1:10,000 peroxidaseconjugated AffiniPure Donkey anti-sheep IgG for 1 hr. Subsequent procedures were identical to those for myc immunoblot.
Immunocytochemical analysis of γhENaC proteins was conducted by permeabilizing the monolayers grown on filters with 5 min exposure to methanol. Cells were washed extensively with PBS and blocked with PBS + 10% fetal bovine serum for 20 min and then incubated with a 1:500 dilution of FITC-conjugated anti-myc antibody for 1 hour. After 5 PBS washes, the filters were cut out, mounted on a slide and visualized on an Olympus Provis inverted fluorescent microscope. Images were captured with a SPOT digital imaging system (Diagnostic Instruments).
Materials. Tissue culture medium and fetal bovine serum were obtained from the University of Iowa Cancer Center. Adenovirus particles (type 5) expressing green fluorescent protein (GFP) under the control of the TRE promoter, the transactivator (tTA) adenovirus, and each of the γhENaC adenovirus constructs were produced in the University of Iowa Vector Core Facility. The tTA adenovirus construct was a kind gift from Martha C. Bohn (Northwestern University). The anti-myc antibody and the FITC-conjugated anti-myc antibody were purchased from Invitrogen. The secondary antibody was purchased from Chemicon. The sheep anti-γhENaC affinity purified antisera was a kind gift from Dr. Michael Welsh (21). Brefeldin A was from Biomol (Plymouth Meeting, PA). Unless otherwise specified, chemicals were purchased from Sigma.
Statistics. Values are expressed as mean ± SEM. When we compared more than two groups we used one- or two-way ANOVA or by the Kruskal-Wallis non-parametric test as indicated. Subsequent analysis between groups employed a multiple comparison with a Bonferroni correction.
Results
The efficiency of infection of M1 cells using an Ad5 virus encoding GFP under the control of the tTA is shown in figure 1. When coexpressed with tTA over 90% of the M1 cells expressed GFP. Similar results were obtained with an Ad5 virus expressing β galactosidase (data not shown). In addition, 1,000 ng/ml doxycycline greatly inhibited the expression of GFP. However, by increasing the time of exposure we could determine that a small amount of GFP was expressed in some cells even with this high concentration of doxycycline. A similar low expression of GFP was seen with M1 cells infected with the GFP construct without the tTA. This system thus permits doxycycline-inhibited expression, but a small amount of protein can be expressed even in the presence of high concentrations of doxycycline or in the absence of the transactivator.
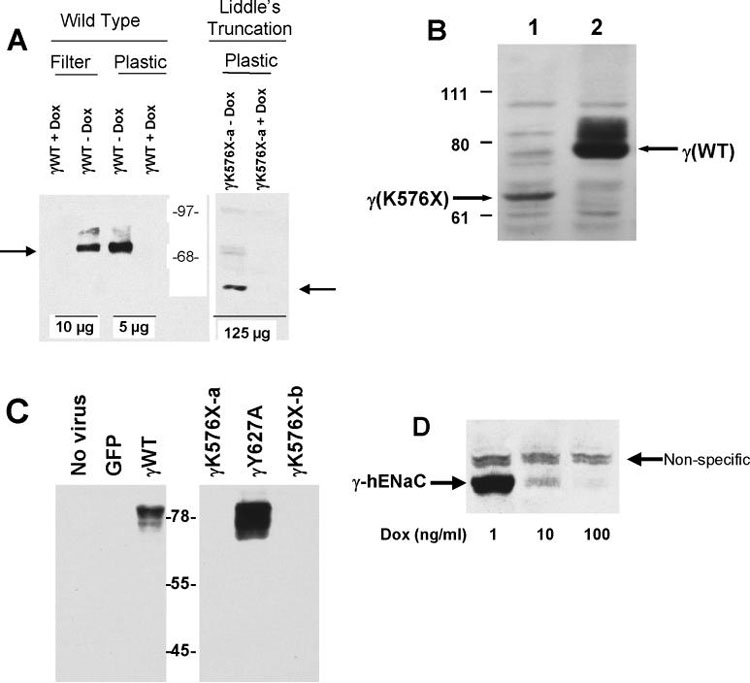
We expressed the wild type γhENaC in confluent M1 cells grown on filters or in cells grown on plastic at ~75% confluence. The immunoblot in the left panel of figure 2A shows two features of this expression. First, 1,000 ng/ml of doxycycline reduced protein expression to levels undetectable by immunoblot. Second, expression was consistently greater when cells were grown on plastic, probably because receptors for adenovirus are more abundant on the basolateral membrane than the apical membrane (22;23) and for cells grown on plastic, there is probably greater access to the basolateral membrane.
Figure 2:
A. Immunoblot of γ-hENaC wild type (WT) and C-terminal (Liddle's) truncations. All constructs infected at 10 MOI in M1 cells with 10 MOI tTA with or without 1,000 ng/ml doxycycline (DOX) as indicated. Amount of protein loaded per lane indicated at bottom. Arrows indicate location of full-length γhENaC (left) and the Liddle's truncation (γK576X, right). Molecular standards in center. B. Immunoblot of wild type (lane 2) or Liddle's truncated (lane 1) γhENaC constructs infected into M1 cells grown on plastic as in 2A without doxycycline. This immunoblot used a sheep antibody directed at the N-terminus of γhENaC (21). 100 μg protein loaded in each lane. C. Immunoblot of γhENaC constructs infected into M1 cells (10 MOI) grown on filters without doxycycline. Left panel shows no evidence of immunoreactive material in negative controls while showing abundant material in cells infected with 10 MOI wild type γhENaC construct. Right panel shows no detectable γhENaC for the Liddle's truncation (γK576X). In contrast, the γY627A mutant shows abundant protein. 70 μg protein loaded in each lane. All cells grown on filters. D. Immunoreactive γhENaC protein decreases with increasing concentration of doxycycline (DOX) in the medium. 100 μg total protein loaded per lane. Non-specific band seen with heavy protein loading.
The right panel of figure 2A shows the protein expression of the Liddle's truncation construct (γK576X) infected with the same MOI. Surprisingly, there was substantially less protein produced than the wild type protein, and could be consistently detected by immunoblot only when cells were grown on plastic. To be certain that the amount of protein was actually lower in the Liddle's truncation construct and not just owing to a less recognizable C-terminal myc epitope, we conducted an immunoblot using a sheep antibody directed against a portion of the N-terminus of γhENaC (21). This antibody, although less specific than the one used against the myc epitope, also revealed a reduced abundance of truncated γhENaC protein (figure 2B). Thus, this Liddle's C-terminal truncation mutant makes substantially less protein than the wild type construct.
In contrast to the Liddle's truncation construct (γK576X) the γY627A construct, a mutation that disrupts the PY motif and causes a more active ENaC complex in oocytes (18;24;25), produced protein in similar or greater quantities than the wild type γhENaC (figure 2C). We confirmed that increasing concentrations of doxycycline reduced the abundance of γhENaC protein in M1 cells grown on filters in a graded fashion (figure 2D).
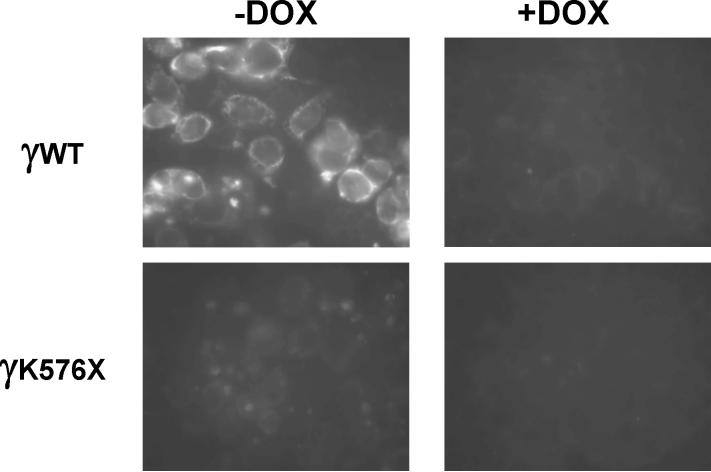
We asked whether the reduced abundance of the Liddle's truncation was due to a reduced number of cells expressing the protein, or a decrease in the amount of protein per cell. Immunocytochemical analysis showed detectable infected wild-type protein in the cytoplasm (but not the nucleus), and doxycycline reduced expression per cell, as expected (figure 3). M1 cells infected with the Liddle's truncation (γK576X) mutant showed faint signal in most cells but few if any cells expressed protein as abundant as wild type (figure 3). Doxycycline reduced expression to nearly undetectable levels. Infection of the γY627A mutant showed a pattern similar to wild type γ-hENaC (data not shown). Thus, the Liddle's truncation mutant produced less protein per cell compared to the wild type or γY627A mutation.
Figure 3.
Immunocytochemistry of M1 cells infected with either wild type γ-hENaC (γWT) or the Liddle's truncation (γK576X). Treatment with 1,000 ng/ml doxycycline (DOX) greatly reduced expression. γWT protein is expressed predominantly in the cytoplasm and is excluded from the nucleus. γK576X expression is decreased in all cells.
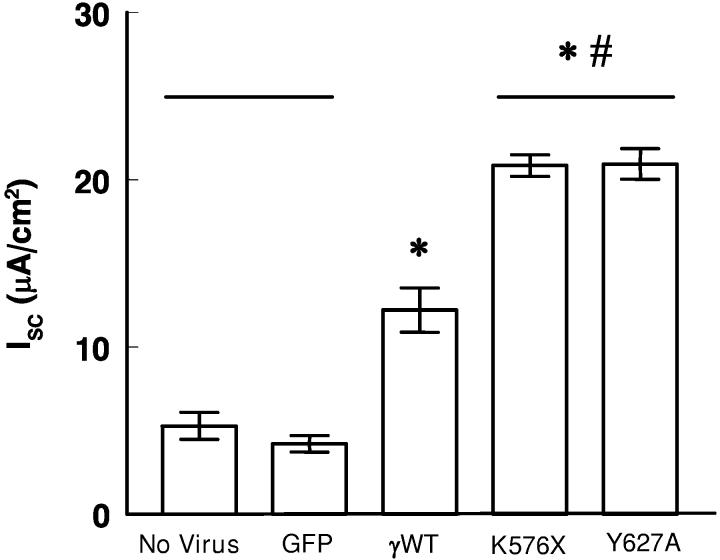
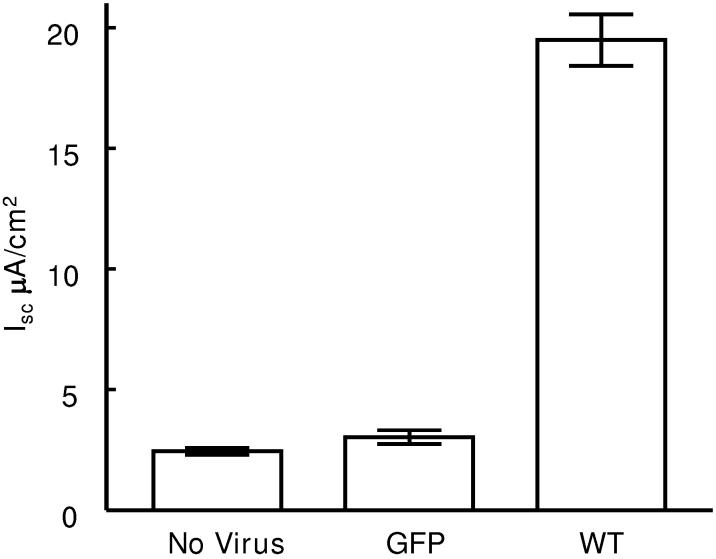
Functional effects of expressingγ -hENaC constructs. Infecting only the tTA construct into M1 monolayers had no effect on Isc (not shown). Similarly, expressing the GFP construct with the tTA also had no effect (figure 4). However, expressing γWT increased Isc significantly (figure 4); all but 1-2 μA/cm2 were inhibited by benzamil (data not shown). Expressing the constructs encoding the Liddle's truncation or the γY627A mutation produced approximately twice the current as monolayers infected with γWT (figure 4). Thus these mutations cause the cells to transport more Na+ than cells infected with the wild type virus, a result that would be predicted from heterologous expression of similar mutants in oocytes (18;25;26) and the clinical presentation of patients with Liddle syndrome (1;27).
Figure 4.
Effect of viral constructs on Isc of M1 cells. All monolayers were infected with 10 MOI of each virus. Measurements made 48 h after virus applied to apical surface. Doxycycline (1,000 ng/ml) was present in all experiments. Lines indicate groups that are not significantly different. *p<0.01 compared to no virus control or GFP. #p<0.01 compared to γWT. Values are mean ±SEM; n= 8 monolayers; 2 experiments for each group.
We considered two possible explanations for the increase in Na+ transport following overexpression of γhENaC. First, it seemed possible that mixing mouse α and β ENaC subunits with a human γ subunit might produce an intrinsically more active channel. However, expression of rat α and β with a human γ subunit in oocytes did not produce a higher current than homogeneous rat or human α, β, and γ subunits (28). Thus these data would not support the idea that such heterogeneous expression could account for a higher rate of Na+ transport. To address this question from a different perspective, we expressed γhENaC in H441 cells, a human lung epithelial cell line that exhibits ENaC mediated Na+ transport (16;29). As shown in figure 5, overexpression of γhENaC in this human cell line also increased Na+ transport, while the GFP control construct had no effect. These results suggest that species differences between the gamma ENaC subunits may not fully explain the higher rates of Na+ transport in M1 cells overexpressing γhENaC.
Figure 5.
Na+ transport in H441 cells, a human airway epithelial cell line that expresses functional ENaC. These monolayers (not treated with steroids) demonstrate higher rates of Na+ transport when γhENaC is overexpressed (at an MOI of 100). Measurements made 48 h after exposure to the adenovirus construct. Monolayers were not treated with doxycycline. n=3-4 monolayers in each group.
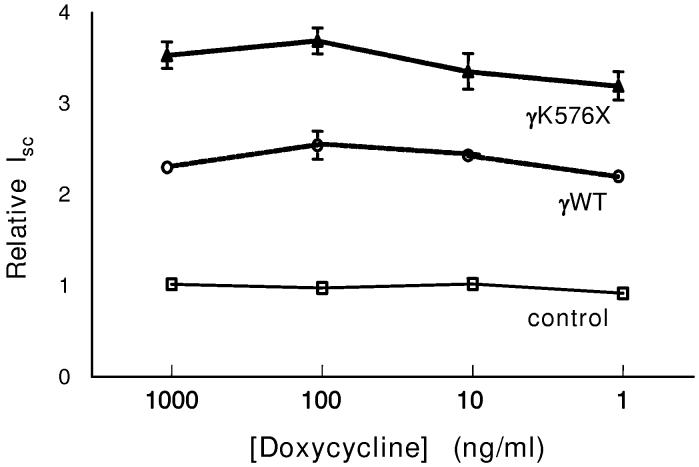
We asked whether further increasing γhENaC protein expression would alter Na+ transport. Figure 6 shows the effects of several concentrations of doxycycline on the relative Isc for controls (no virus or GFP), wild type γhENaC, and γK576X. Doxycycline had no effect on control monolayers not infected with an ENaC-expressing adenovirus. Increasing doxycycline concentration (thereby decreasing γhENaC protein, figure 2D) also had no effect on monolayers infected with the wild type γhENaC or the Liddle's mutant. Similar results were obtained for the γY627A mutant (data not shown). These data suggest that only a small additional amount of γhENaC protein is needed to increase Na+ transport, and that expression of even more protein does not produce greater Na+ transport.
Figure 6.
Effect of doxycycline on Na+ transport of M1 cells expressing γhENaC constructs. Isc was measured 48 hours after infection with respective constructs. Controls were either no virus, GFP, or transactivator alone; there were no differences in the Isc of monolayers infected with these constructs. n=7-17 filters from 2-5 experiments for each condition. Monolayers not treated with steroids.
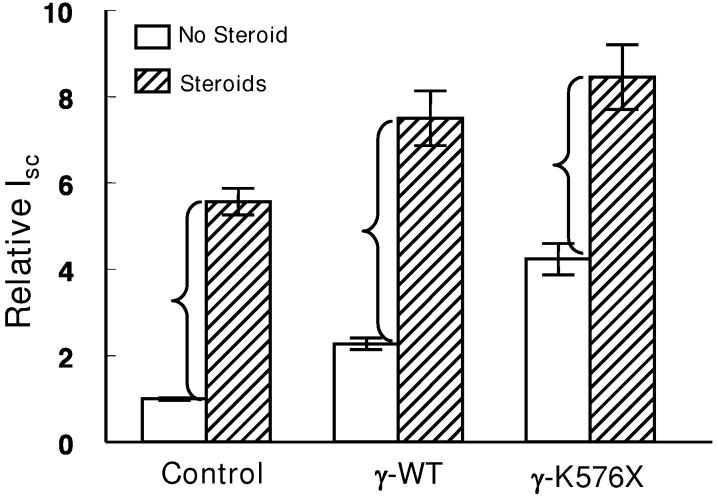
We next conducted experiments to determine the extent to which steroid treatment would increase Isc in monolayers expressing either the wild type γhENaC or the Liddle's truncation (figure 7). Two-way analysis of variance showed significant enhancement of Isc by steroids and significant effects of the two constructs, but no interaction between steroids and the constructs. Stated another way, there was no significant difference in the increment in Isc produced by steroids in monolayers in the three groups (shown by the brackets in figure 7). These results suggest independent effects of steroids and the C-terminal mutations that increase ENaC activity.
Figure 7.
Effect of steroids (24 h) on Isc of M1 monolayers expressing the indicated constructs. n=23 monolayers from 7 experiments in each group. 1,000 ng/ml doxycycline present in all experiments. Open bars, no steroids; hatched bars, steroid treatment. ANOVA showed significant effect of steroid without interaction with the nature of the virus.
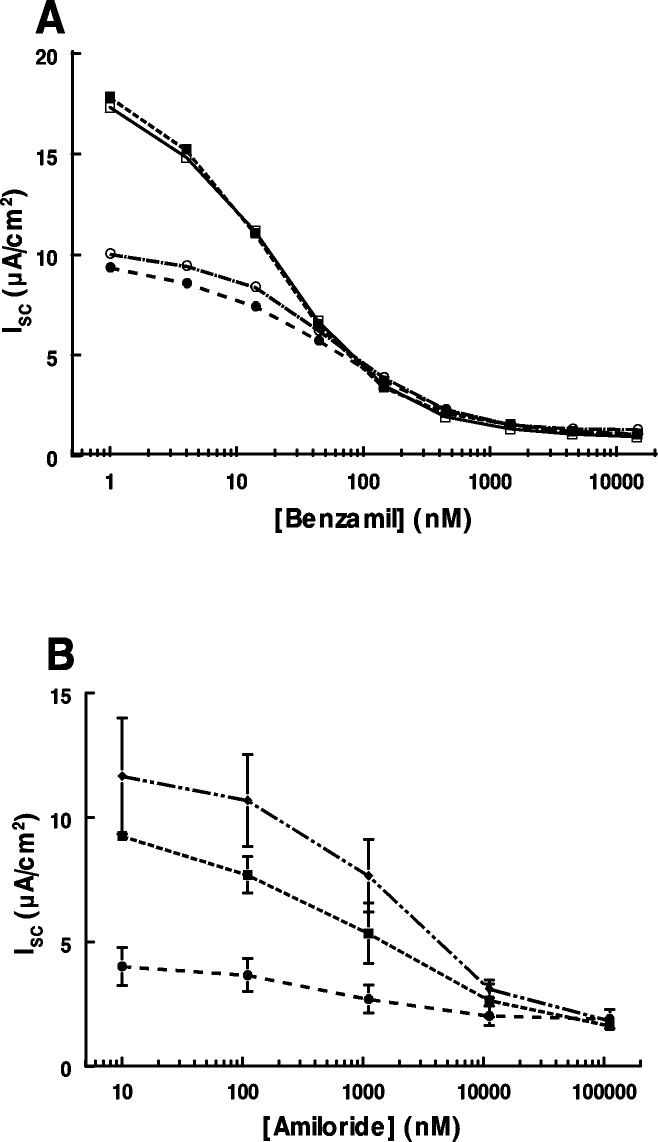
We considered the possibility that the higher Isc in monolayers expressing γhENaC was owing to differences in stoichiometry of the ENaC complex. If overexpression of the γENaC subunit changed ENaC complexes of αβ subunits, to complexes of αβγ subunits we would expect a marked increase in amiloride sensitivity since αβ ENaC is an order of magnitude less sensitive than αβγ ENaC (30). The concentration-response curves for benzamil and amiloride.(figure 8), show that the IC50 for benzamil was ~40 nM and was independent of steroid treatment. The IC50 for amiloride was ~1 μM in monolayers treated with steroids with or without wild type γENaC or in monolayers treated with γENaC without steroids. These results suggest that the difference in Isc is not owing to differences in stoichiometry of ENaC subunits.
Figure 8.
Concentration response of ENaC inhibitors on Isc in M1 cells. A. Effect of benzamil on monolayers treated with steroid for 24 h (squares) or without steroid treatment (circles). The IC50 for each group (n=2 each) was ~40 nM. B. Effect of amiloride on monolayers treated with wild type γENaC without steroids (circles), steroids without any γENaC (squares), or steroids with wild type γENaC (diamonds). IC50 averaged 1.0 μM (range 0.65-1.30 μM). There was no difference in the IC50 between the groups by the Kruskal-Wallis non-parametric test. n=4 monolayers in each group.
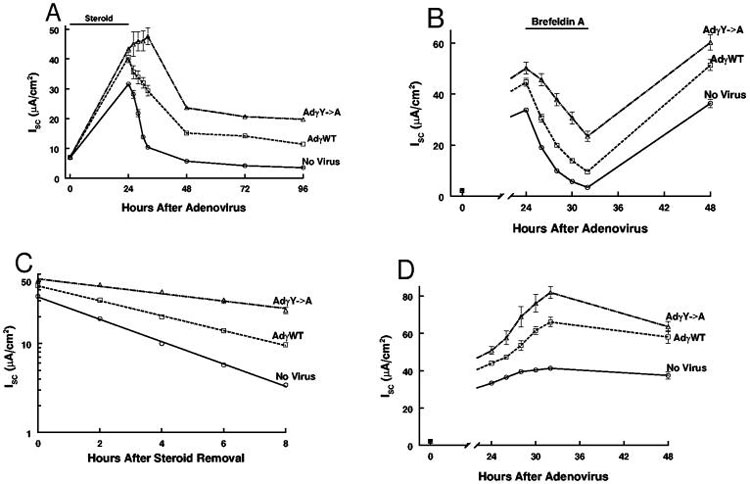
To probe the mechanism of the interactions of steroids and the normal and mutated γhENaC constructs, we conducted maneuvers to decrease Na+ transport. We removed steroids after 24 h, which causes a decrease in Na+ transport (31). While the control monolayers showed the expected decline in current, monolayers expressing the mutated ENaC showed a complex behavior, increasing the current up to 8 h after steroid removal (figure 9A). While these results demonstrated clear differences between the constructs, they did not lend themselves to analysis using a simple model. Therefore we used brefeldin A, an agent that inhibits exit of proteins from the golgi and trafficking to the apical membrane (32-37).
Figure 9.
Effect of maneuvers to decrease Isc of M1 monolayers. All monolayers were treated with steroids from the time of adenovirus infection (t=0). A. Effect of steroid removal after 24 h of exposure. (n=11 monolayers from 3 experiments in each group) B. Brefeldin A (10 μM) produced a steady decline in Isc over the 8 hour exposure in all groups. Recovery was complete at 48 h. C. Over the course of the 8 h of brefeldin A treatment the decline in Isc was log-linear (r>0.96 for all groups) and each treatment was significantly different from the others (p<0.01 by Kruskal-Wallis test). D. Control monolayers, not treated with brefeldin A, showed a consistent increase in Isc over the 8 hours of measurement. Doxycycline (1,000 ng/ml) was present in all experiments. n=8 monolayers from 2 experiments in each group.
Under constant exposure to steroids, brefeldin A added 24 h after steroid and adenovirus treatment, produced a consistent decline in Isc (figure 9B). The brefeldin A effect was log-linear (figure 9C), indicating that an analysis using first-order kinetics would be appropriate. The control monolayers (not treated with brefeldin A) showed an increase in Isc over the 8 h experimental period (figure 9D), indicating that the monolayers were not in a steady-state. The increase in Isc was entirely due to ENaC activity as 10 μM benzamil reduced Isc to ~1 μA/cm2 (data not shown). Assuming that the decline in Isc was owing to removal (or inactivation) of functional channels, we can calculate a removal rate constant (the slope of the lines in figure 9B, krem) and the half-life of the channels (table).
Table: Rate constants (krem) and half-lives of ENaC in control and γ-ENaC expressing monolayers (data derived from figure 9B). All values are different from each other (p<0.001)
| No Virus | Adγ-WT | Adγ-Y->A | |
|---|---|---|---|
| krem (min-1*103) | -2.10 ± 0.10 | -1.41 ± 0.12 | -0.71 ± 0.12 |
| t1/2 (hr) | 2.40 ± 0.04 | 3.58 ± 0.11 | 7.27 ± 0.49 |
Information in figure 9 permits estimation of the absolute rates of insertion and removal (deactivation) of functional channels using the expression
where ΔJt is the change in transport over time (fig 9D) and subscripts i and r represent insertion and removal respectively. Removal rates are calculated using the expression
where Jm is the mean transport rate over time t, and krem is the removal rate constant (table).
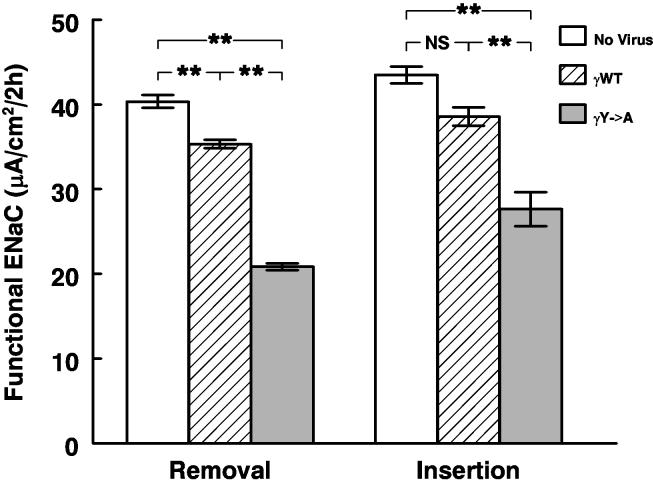
The results of this analysis (figure 10) demonstrate that the absolute rate of removal of functional ENaC follows that predicted from the krem of each kind of channel. The estimated rates of channel insertion showed some unexpected results. While insertion rates were always greater than removal rates (as required by the fact that Isc was increasing over time), the rate of insertion of channels in the monolayers expressing the Liddle's mutation was markedly lower than either of the other two groups. Thus the reason for the consistently greater Isc in the Liddle's group is slower removal and not greater rates of insertion, even in the presence of steroids and rising rates of transport.
Figure 10.
Estimated rates of insertion and removal of functional ENaC from the data in figure 8. Open bars, control monolayers; hatched bars, wild type γhENaC; solid bars, γY627A. ** p<0.01 by ANOVA.
Discussion
We report here some unexpected characteristics of ENaC regulation in a renal collecting duct cell line (M1). Overexpressing the wild-type gamma subunit using a doxycycline-regulated adenoviral system increases ENaC activity, but the amount of protein needed to increase ENaC activity is below the detectable range. Further increases in γhENaC expression do not increase ENaC function further. Expressing an activating mutation in the PY motif of the gamma subunit produces a greater increase in ENaC activity than wild-type γENaC. Steroid treatment of monolayers overexpressing any of these constructs increases ENaC activity to a similar extent as in control monolayers, with no evident interaction between steroids and the expressed ENaC subunit. Finally, as expected, the activating mutation greatly increases the functional half-life of the channel, but unexpectedly, overexpression of wild type γhENaC also increases the half-life, although to a less pronounced degree.
Consequences of producing moreγENaC protein. M1 cells have all the machinery necessary to produce a functioning ENaC complex and to respond to steroids with an increase in activity (9;11;12). M1 cells express mRNA for all three ENaC subunits (10;11) and single channel analysis demonstrates classical ENaC biophysical characteristics (9;10). Steroids increase the abundance of α- and βmENaC subunits without a change in γmENaC. Under our culture conditions, endogenous γmENaC protein is difficult to detect (manuscript submitted). These results demonstrate that a small amount of γENaC added to the endogenous pool in M1 cells can augment ENaC function. We did not expect to see such an effect, because although endogenous γmENaC levels are low, steroid treatment produces a strong increase in ENaC activity without apparent increases in γmENaC mRNA or protein (manuscript submitted). The lack of an increase in γmENaC in response to steroids suggests that endogenous γmENaC is not rate limiting, at least under these conditions. However, the present results demonstrating that a small additional amount of γENaC can increase ENaC activity in either M1 cells or H441 cells (figures 5 and 6) raises the possibility that under some conditions γENaC may be rate limiting.
There are circumstances where overexpression of γENaC will increase ENaC activity, but they occur when the alpha and beta subunits are already expressed and γENaC expression is not detectable. An example is the Xenopus oocyte where expression of only the alpha and beta subunits produces a very small current with atypical biophysical characteristics. Expression of the gamma subunit produces substantially higher currents with the classical biophysical characteristics (38;39). Ma et al. (40) have demonstrated similar characteristics in human B lymphocytes which normally express only alpha and beta subunits. However, we are unaware of a physiologic example where ENaC activity is increased solely by increasing the expression of γENaC. There are reports that posttranscriptional processing of γENaC may be important in ENaC function (41;42). The extent to which this processing may play a role in the present results is unclear.
We assume that the M1 cells in these experiments express the classic heterotrimeric channel as described by single channel analysis (9;10). An alternative interpretation is that the channels that are expressed in these M1 cells are predominantly αβ ENaC and that addition of the gamma subunit converts the predominant heterodimeric channel to a heterotrimeric channel. The evidence against this interpretation is that all three subunits are expressed in M1 cells in the basal state, the single channel characteristics of M1 cells are those of the heterotrimeric channel, and the magnitude of the ENaC activity is substantially higher than one would expect of dimeric or monomeric channels. Furthermore, the amiloride sensitivity is the same in monolayers overexpressing wild type γENaC compared to steroid treated or normal controls (figure 8). If this interpretation is correct, it raises the possibility that nearly undetectable amounts of ENaC protein can combine with other subunits to form fully active ENaC channels. Such an interpretation is consistent with the increased ENaC activity these experiments demonstrate (figure 6) where the overexpressed γhENaC is barely detectable.
This interpretation prompts a reassessment of recently reported experiments where expression of alpha and gamma ENaC subunits in MDCK cells produced a measurable amiloride sensitive current (43). Because these monolayers had no detectable βENaC protein, even though there was readily detectable βENaC mRNA, the authors concluded that expression of alpha and gamma ENaC subunits produced a αγ channel. However, if the amount of ENaC protein needed to form a functional channel is below the presently available limits of detection, one could postulate that such conditions actually produced a heterotrimeric channel. The idea that only a small number of functional ENaC channels is needed to account for the observed currents is supported by a simple calculation. A current of 30 μA/cm2 in M1 cells represents about 8.5 pA/cell. At an average open probability of 0.5 and a unitary current at -60 mV of 1 pA (18;44), one needs only 15-20 channels per cell to account for all Na+ transport. The resolution of this question will require substantially more sensitive techniques to measure the number and structure of functional ENaC channels.
Other investigators have reported overexpressing a single ENaC subunit in cultured epithelial cells. Overexpression of βENaC in a mammalian collecting duct cell line did not increase basal Na+ transport (31), while overexpressing α or βENaC in amphibian A6 cells produced an increase in Na+ transport (45). Interestingly, overexpression of βENaC, but not α- or γENaC caused higher rates of Na+ transport in mouse airway epithelial cells (46). The simplest interpretation of these diverse observations is that different cells expressing a functional ENaC may express variable amounts of specific subunits and depending on the expression patterns, one of the subunits is rate limiting for optimal function.
Effect of Liddle's mutations on ENaC function. It is not surprising that overexpression of the γENaC subunit with a mutation in the γY627 position or truncation of the entire C-terminus increases ENaC activity. Although the Liddle's mouse model provides evidence that this system is more complex than we previously appreciated (47;48), expression of these or similar constructs in Xenopus oocytes and more recently in mammalian epithelial cells (31) generally confirm that disruption of the PY motif in either the beta or gamma subunit will produce overactivity of ENaC (1;18;25).
One of the objectives of the present experiments was to test the idea that expression of a Liddle's mutation would blunt the response to steroid hormone stimulation of ENaC function. Analysis of data in figure 7 indicates that steroid stimulation was as effective in monolayers overexpressing a mutated gamma subunit as it was in control monolayers. The apparent lack of interaction between the mutations and steroid stimulation raises questions regarding the mechanism of steroid stimulation. Current observations implicate the retardation of ENaC retrieval from the apical membrane via the PY motif as a major mechanism for steroid stimulation of ENaC (5-7). The present results suggest that there are other mechanisms operating to increase ENaC activity. This analysis uses absolute values for differences in Isc rather than fold changes. The “proper” type of analysis – fold differences or absolute differences in Isc – cannot be firmly ascertained since each type of analysis makes certain implicit assumptions that at the present time can not be subjected to thorough experimental verification.
One of the unexpected results was the substantial difference in protein expression between the γY627A mutation and the γK576X mutation (figures 2 and 3). Even suppression of the γK576X expression with high concentrations of DOX did not reduce ENaC function (figure 6). We do not yet have a clear explanation of the mechanism responsible for this difference, but the results underscore the idea that only a very small amount of γENaC protein is necessary to enhance ENaC function.
Under constant steroid exposure, we estimated the rate of insertion and retrieval/inactivation of ENaC. The substantially prolonged functional half-life of ENaC in monolayers expressing Liddle's mutation (table) is consistent with current notions of the importance of the PY motif in ENaC retrieval from the apical membrane (5). However, the prolonged half-life of ENaC in monolayers overexpressing small amounts of γhENaC (table) was unsuspected. We are not certain of the mechanism for this prolonged half-life. One possibility is that overexpression of γENaC in some fashion permits a more stable ENaC complex.
The kinetic analysis (figure 10) demonstrated that delayed removal/inactivation of ENaC was the predominant reason for the higher transport rates of the monolayers expressing the Liddle's mutant. However, we were somewhat surprised to see that the insertion rate of the Liddle's mutant was substantially lower than that of the control monolayers even when the rate of increase of the current in the monolayers expressing the Liddle's mutant was greater than that of control monolayers. This tendency was also seen in the monolayers overexpressing wild type γhENaC. The reason for this phenomenon is not clear, but we can conceive of two general explanations. First, the higher rates of Na+ entry (and thus possibly higher intracellular [Na+] may induce secondary events to limit activation/insertion of channels. A second possibility is that the pool of ENaC channels is constant and that more channels resident (and active) in the apical membrane reduce the pool available for insertion/activation. The distinction between these possibilities will require further experimentation.
Acknowledgments
This work was supported in part by USPHS grant HL-55006, The O'Brien Kidney Research Center at the University of Iowa (DK-52617), and by a grant from the Department of Veterans Affairs. University of Iowa Cancer Center also provided services. The University of Iowa Center for Gene Therapy (supported by USPHS P30 DK 54759) provided assistance with vector production.
Footnote
1 Abbreviations used in this manuscript:
- ENaC
epithelial Na+ channel
- GFP
green fluorescent protein
- Isc
short-circuit current
- DOX
doxycycline
- MOI
multiplicity of infection
Reference List
- 1.Stokes JB. Kidney Int. 1999;56:2318–2333. doi: 10.1046/j.1523-1755.1999.00803.x. [DOI] [PubMed] [Google Scholar]
- 2.Rossier BC, Pradervand S, Schild L, Hummler E.Annu.Rev.Physiol 200264877–97.877-897 [DOI] [PubMed] [Google Scholar]
- 3.Lifton RP. Sci. 1996;272:676–680. doi: 10.1126/science.272.5262.676. [DOI] [PubMed] [Google Scholar]
- 4.Kamynina E, Staub O. Am J Physiol Renal Physiol. 2002;283:F377–F387. doi: 10.1152/ajprenal.00143.2002. [DOI] [PubMed] [Google Scholar]
- 5.Snyder PM. Endocr.Rev. 2002;23:258–275. doi: 10.1210/edrv.23.2.0458. [DOI] [PubMed] [Google Scholar]
- 6.Staub O, Abriel H, Plant P, Ishikawa T, Kanelis V, Saleki R, Horisberger JD, Schild L, Rotin D. Kidney Int. 2000;57:809–815. doi: 10.1046/j.1523-1755.2000.00919.x. [DOI] [PubMed] [Google Scholar]
- 7.Snyder PM, Olson DR, Thomas BC. Journal of Biological Chemistry. 2001;277:5–8. doi: 10.1074/jbc.C100623200. [DOI] [PubMed] [Google Scholar]
- 8.Debonneville C, Flores SY, Kamynina E, Plant PJ, Tauxe C, Thomas MA, Munster C, Chraibi A, Pratt JH, Horisberger JD, Pearce D, Loffing J, Staub O. EMBO J. 2001;20:7052–7059. doi: 10.1093/emboj/20.24.7052. [DOI] [PMC free article] [PubMed] [Google Scholar]
- 9.Chalfant ML, O'Brien TG, Civan MM. Am.J.Physiol.(Cell Physiol.) 1996;270:C998–C1010. [Google Scholar]
- 10.Letz B, Ackermann A, Canessa CM, Rossier BC, Korbmacher C. J.Membr.Biol. 1995;148:127–141. doi: 10.1007/BF00207269. [DOI] [PubMed] [Google Scholar]
- 11.Nakhoul NL, Hering-Smith KS, Gambala CT, Hamm LL. Am.J.Physiol.(Renal Physiol.) 1998;275:F998–F1007. doi: 10.1152/ajprenal.1998.275.6.F998. [DOI] [PubMed] [Google Scholar]
- 12.Stoos BA, Náray-Fejes-Tóth A, Carretero OA, Ito S, Fejes-Tóth G. Kidney Int. 1991;39:1168–1175. doi: 10.1038/ki.1991.148. [DOI] [PubMed] [Google Scholar]
- 13.Husted RF, Hayashi M, Stokes JB. Am.J.Physiol.Renal,Fluid Electrolyte Physiol. 1988;255:F1160–F1169. doi: 10.1152/ajprenal.1988.255.6.F1160. [DOI] [PubMed] [Google Scholar]
- 14.Husted RF, Laplace JR, Stokes JB. J.Clin.Invest. 1990;86:498–506. doi: 10.1172/JCI114736. [DOI] [PMC free article] [PubMed] [Google Scholar]
- 15.Husted RF, Sigmund RD, Stokes JB. Am.J.Physiol.Renal Physiol. 2000;278:F425–F433. doi: 10.1152/ajprenal.2000.278.3.F425. [DOI] [PubMed] [Google Scholar]
- 16.Sayegh R, Auerbach SD, Li X, Loftus RW, Husted RF, Stokes JB, Thomas CP. J.Biol.Chem. 1999;274:12431–12437. doi: 10.1074/jbc.274.18.12431. [DOI] [PubMed] [Google Scholar]
- 17.Husted RF, Matsushita K, Stokes JB. Am.J.Physiol.Renal,Fluid Electrolyte Physiol. 1994;267:F767–F775. doi: 10.1152/ajprenal.1994.267.5.F767. [DOI] [PubMed] [Google Scholar]
- 18.Snyder PM, Price MP, McDonald FJ, Adams CM, Volk KA, Zeiher BG, Stokes JB, Welsh MJ. Cell. 1995;83:969–978. doi: 10.1016/0092-8674(95)90212-0. [DOI] [PubMed] [Google Scholar]
- 19.Volk KA, Husted RF, Snyder PM, Stokes JB. Am.J.Physiol.Cell Physiol. 2000;278:C1047–C1054. doi: 10.1152/ajpcell.2000.278.5.C1047. [DOI] [PubMed] [Google Scholar]
- 20.Avruch J, Wallach DFH. Biochim.Biophys.Acta. 1971;233:334–347. doi: 10.1016/0005-2736(71)90331-2. [DOI] [PubMed] [Google Scholar]
- 21.Drummond HA, Abboud FM, Welsh MJ. BR. 2000;884:1–12. doi: 10.1016/s0006-8993(00)02831-6. [DOI] [PubMed] [Google Scholar]
- 22.Wang G, Zabner J, Deering C, Launspach J, Shao J, Bodner M, Jolly DJ, Davidson BL, McCray PB., Jr. Am.J.Respir.Cell Mol.Biol. 2000;22:129–138. doi: 10.1165/ajrcmb.22.2.3938. [DOI] [PubMed] [Google Scholar]
- 23.Zabner J, Freimuth P, Puga A, Fabrega A, Welsh MJ. J.Clin.Invest. 1997;100:1144–1149. doi: 10.1172/JCI119625. [DOI] [PMC free article] [PubMed] [Google Scholar]
- 24.Tamura H, Schild L, Enomoto N, Matsui N, Marumo F, Rossier BC, Sasaki S. J.Clin.Invest. 1996;97:1780–1784. doi: 10.1172/JCI118606. [DOI] [PMC free article] [PubMed] [Google Scholar]
- 25.Schild L, Lu Y, Gautschi I, Schneeberger E, Lifton RP, Rossier BC. EMBO J. 1996;15:2381–2387. [PMC free article] [PubMed] [Google Scholar]
- 26.Schild L, Canessa CM, Shimkets RA, Gautschi I, Lifton RP, Rossier BC. Proc.Natl.Acad.Sci. 1995;92:5699–5703. doi: 10.1073/pnas.92.12.5699. [DOI] [PMC free article] [PubMed] [Google Scholar]
- 27.Hansson JH, Nelson-Williams C, Suzuki H, Schild L, Shimkets R, Lu Y, Canessa C, Iwasaki T, Rossier B, Lifton RP. Nature Genetics. 1995;11:76–82. doi: 10.1038/ng0995-76. [DOI] [PubMed] [Google Scholar]
- 28.McDonald FJ, Price MP, Snyder PM, Welsh MJ. Am.J.Physiol.(Cell Physiol.) 1995;268:C1157–C1163. doi: 10.1152/ajpcell.1995.268.5.C1157. [DOI] [PubMed] [Google Scholar]
- 29.Itani OA, Auerbach SD, Husted RF, Volk KA, Ageloff S, Knepper MA, Stokes JB, Thomas CP. Am J Physiol Lung Cell Mol Physiol. 2002;282:L631–L641. doi: 10.1152/ajplung.00085.2001. [DOI] [PubMed] [Google Scholar]
- 30.McNicholas CM, Canessa CM. J.Gen.Physiol. 1997;109:681–692. doi: 10.1085/jgp.109.6.681. [DOI] [PMC free article] [PubMed] [Google Scholar]
- 31.Auberson M, Hoffmann-Pochon N, Vandewalle A, Kellenberger S, Schild L. Am J Physiol Renal Physiol. 2003;285:F459–F471. doi: 10.1152/ajprenal.00071.2003. [DOI] [PubMed] [Google Scholar]
- 32.Fisher RS, Grillo FG, Sariban-Sohraby S. Am.J.Physiol.(Cell Physiol.) 1996;270:C138–C147. doi: 10.1152/ajpcell.1996.270.1.C138. [DOI] [PubMed] [Google Scholar]
- 33.Miller SG, Carnell L, Moore H-PH. J.Cell Biol. 1992;118:267–283. doi: 10.1083/jcb.118.2.267. [DOI] [PMC free article] [PubMed] [Google Scholar]
- 34.Staub O, Gautschi I, Ishikawa T, Breitschopf K, Ciechanover A, Schild L, Rotin D. EMBO J. 1997;16:6325–6336. doi: 10.1093/emboj/16.21.6325. [DOI] [PMC free article] [PubMed] [Google Scholar]
- 35.Alvarez de la Rosa D, Zhang P, Naray-Fejes-Toth A, Fejes-Toth G, Canessa CM. J.Biol.Chem. 1999;274:37834–37839. doi: 10.1074/jbc.274.53.37834. [DOI] [PubMed] [Google Scholar]
- 36.Weisz OA, Wang J-M, Edinger RS, Johnson JP. J.Biol.Chem. 2000;275:39886–39893. doi: 10.1074/jbc.M003822200. [DOI] [PubMed] [Google Scholar]
- 37.Carattino MD, Hill WG, Kleyman TR. Journal of Biological Chemistry. 2003;278:36202–36213. doi: 10.1074/jbc.M300312200. [DOI] [PubMed] [Google Scholar]
- 38.McDonald FJ, Snyder PM, McCray PB, Welsh MJ. Am.J.Physiol.Lung Cell.Mol.Physiol. 1994;266:L728–L734. doi: 10.1152/ajplung.1994.266.6.L728. [DOI] [PubMed] [Google Scholar]
- 39.Canessa CM, Schild L, Buell G, Thorens B, Gautschi I, Horisberger J-D, Rossier BC. N. 1994;367:463–467. doi: 10.1038/367463a0. [DOI] [PubMed] [Google Scholar]
- 40.Ma HP, Al Khalili O, Ramosevac S, Saxena S, Liang YY, Warnock DG, Eaton DC. Journal of Biological Chemistry. 2004;279:33206–33212. doi: 10.1074/jbc.M405455200. [DOI] [PubMed] [Google Scholar]
- 41.Masilamani S, Kim G, Mitchell C, Wade JB, Knepper MA. J.Clin.Invest. 1999;104:R19–R23. doi: 10.1172/JCI7840. [DOI] [PMC free article] [PubMed] [Google Scholar]
- 42.Hughey RP, Mueller GM, Bruns JB, Kinlough CL, Poland PA, Harkleroad KL, Carattino MD, Kleyman TR. Journal of Biological Chemistry. 2003;278:37073–37082. doi: 10.1074/jbc.M307003200. [DOI] [PubMed] [Google Scholar]
- 43.Mohan S, Bruns JR, Weixel KM, Edinger RS, Bruns JB, Kleyman TR, Johnson JP, Weisz OA. Journal of Biological Chemistry. 2004;279:32071–32078. doi: 10.1074/jbc.M405091200. [DOI] [PubMed] [Google Scholar]
- 44.Volk KA, Sigmund RD, Snyder PM, McDonald FJ, Welsh MJ, Stokes JB. J.Clin.Invest. 1995;96:2748–2757. doi: 10.1172/JCI118344. [DOI] [PMC free article] [PubMed] [Google Scholar]
- 45.Blazer-Yost BL, Butterworth M, Hartman AD, Parker GE, Faletti CJ, Els WJ, Rhodes SJ. Am J Physiol Cell Physiol. 2001;281:C624–C632. doi: 10.1152/ajpcell.2001.281.2.C624. [DOI] [PubMed] [Google Scholar]
- 46.Mall M, Grubb BR, Harkema JR, O'Neal WK, Boucher RC. Nat.Med. 2004;10:487–493. doi: 10.1038/nm1028. [DOI] [PubMed] [Google Scholar]
- 47.Pradervand S, Vandewalle A, Bens M, Gautschi I, Loffing J, Hummler E, Schild L, Rossier BC. J.Am.Soc.Nephrol. 2003;14:2219–2228. doi: 10.1097/01.asn.0000080204.65527.e6. [DOI] [PubMed] [Google Scholar]
- 48.Pradervand S, Wang Q, Burnier M, Beermann F, Horisberger JD, Hummler E, Rossier BC. J.Am.Soc.Nephrol. 1999;10:2527–2533. doi: 10.1681/ASN.V10122527. [DOI] [PubMed] [Google Scholar]


