Abstract
The sphingolipid ceramides are known to influence lipid lateral organization in biological membranes. In particular, ceramide-induced alterations of microdomains can be involved in several cell functions, ranging from apoptosis to immune response. We used a combined approach of atomic force microscopy, fluorescence correlation spectroscopy, and confocal fluorescence imaging to investigate the effects of ceramides in model membranes of biological relevance. Our results show that physiological quantities of ceramide in sphingomyelin/dioleoylphosphatidylcholine/cholesterol supported bilayers lead to a significant rearrangement of lipid lateral organization. Our experimental setup allowed a simultaneous characterization of both structural and dynamic modification of membrane microdomains, induced by the presence of ceramide. Formation of similar ceramide-enriched domains and, more general, alterations of lipid-lipid interactions can be of crucial importance for the biological function of cell membranes.
INTRODUCTION
Since the early 1970s, it has been commonly accepted that the cell membrane can be approximated by a two-dimensional homogeneous fluid. This so-called “fluid mosaic model” was based on the observation that most of the lipids in natural membranes have a low phase transition temperature (Tm) thus probably existing in a liquid-disordered (ld) state (1). However, this model cannot be entirely accurate because cell membranes contain a considerable amount of lipids, such as long-chain saturated sphingolipids, which exhibit high Tm. In recent years, experimental evidence has led to the hypothesis that these lipids are organized in small domains, known as “rafts”. Their physical state might be close to a liquid-ordered (lo) phase, structurally and dynamically distinct from the rest of liquid crystalline membrane, also referred to as liquid-disordered phase (2,3).
The presence of lipid domains is thought to be involved in several biological processes, like cell-cell signaling, endo- and exocytosis, and protein sorting, which could not be easily rationalized, using the assumption of a completely homogeneous and spatially symmetric fluid membrane (4,5).
Rafts are most often defined as lateral assemblies enriched in sphingolipids and cholesterol, and they are possibly stabilized both by hydrogen bonds among the polar heads and by hydrophobic interactions among the long saturated aliphatic chains of the sphingolipids. According to the early model proposed by Simons and Ikonen (5), the defects in the sphingolipid packing are successfully filled by cholesterol, which also interacts with their hydrophobic moieties. The resulting tight interactions lead to the separation of cholesterol- and sphingolipid-enriched microdomains from the rest of the lipids in the membrane (6). The most common sphingolipid found in eukaryotic membranes is sphingomyelin (SM), which is composed of a hydrophilic phosphorylcholine headgroup and a hydrophobic ceramide backbone. Ceramide (Cer) is a sphingolipid itself, with a sphingosine base linked via its amino group to a fatty acid chain, and it is considered an important signaling molecule in biological processes like senescence, apoptosis, immune response, bacterial and viral pathogenesis, and cell-cycle arrest (7–9). This molecule can be produced in cells either via de novo synthesis or through hydrolysis of SM phosphocholine group, mediated by sphingomyelinase (SMase) (10). In response to specific stimuli, ceramide concentration in physiological contexts can reach 10–20% of the total lipid content (8,11).
Interestingly, the biophysical properties of ceramide strongly influence both the structural organization and the dynamical properties of the cell membrane. First, ceramides are able to form large networks of hydrogen bonds, as their polar head can act both as an acceptor and as a donor. Moreover, they are among the most hydrophobic lipids in nature and their phase behavior, which exhibits a melting event at ∼90°C, is rather peculiar if compared to the other lipids commonly found in biological membranes. These two properties together explain the tendency of ceramides to segregate from other lipids, thereby generating highly ordered ceramide-enriched microdomains (7,9,12). Furthermore, given the small size of its polar headgroup, ceramide is classified as a lipid with negative curvature. It can thus significantly affect the overall membrane curvature and stability, for example by promoting the lamellar-hexagonal phase transition, pore formation, membrane fusion, and vesicle budding (13–15). Another intriguing property of ceramides concerns their interaction with cholesterol and SM, and the possible consequences on raft assembly. Within this context, a clear relationship has been established between ceramide generation and the decreased level of cholesterol in the plasma membrane (16). Ito et al. (17) reported that the amount of cholesterol in detergent-resistant membrane fractions of rat astrocytes decreases as a consequence of treatment with SMase. It was then proposed that the displacement of cholesterol from the plasma membrane is the result of ceramide-induced displacement of cholesterol from rafts (18). The concept of cholesterol displacement was supported by differential scanning calorimetry and fluorescence spectroscopy studies on lipid vesicles containing coexisting raft and liquid-disordered domains (18–20). It was shown that both natural and synthetic ceramides displace raft-associated cholesterol. The reason could be the competition of ceramide and sterols for inclusion in lo domains. As an alternative scenario, the presence of distinct ceramide-enriched domains that cannot accommodate sterol molecules might force the latter to dissolve into the disordered phase (18). So far, it is not clear yet whether, in the presence of ceramides, lo domains exhibit a homogenous lipid composition or whether different domains of chemically distinct composition segregate.
In this work, we used a combined approach of atomic force microscopy (AFM), fluorescence imaging, and fluorescence correlation spectroscopy (FCS) to shed light on the effects of ceramides on the bilayer structure and dynamic organization in domain-exhibiting model membranes with lipid compositions which are relevant to the raft problem. On one hand, AFM provides structural details with nanoscopic resolution on the basis of topographical variations between different lipid phases in supported bilayers (21). On the other hand, the structural information is complemented by data on lipid dynamics, which can be acquired, on a much faster timescale, by using suitable fluorescence techniques, such as FCS (22).
Our results show that physiological concentrations of ceramide strongly influence the lateral organization of the membrane. More specifically, ceramide-enriched areas are formed in correspondence with raft-like domains, which thus experience major structural rearrangements. Furthermore, dynamic data support the hypothesis by which raft reorganization is accompanied by the release of cholesterol into the disordered phase. Similar results are finally obtained by adding SMase to supported bilayers composed of SM/DOPC/cholesterol 1:1:1 (molar ratio).
MATERIALS AND METHODS
Chemicals
1,2-dioleoyl-sn-glycero-3-phosphocholine (dioleoylphosphatidylcholine; DOPC), N-stearoyl-D-erythrosphingosylphosphorylcholine (stearoyl sphingomyelin (SM)), N-stearoyl-D-erythro-sphingosine (C18 ceramide (Cer)), and cholesterol were purchased from Avanti Polar Lipids (Alabaster, AL) and used without further purification. 1,1′-Dioctadecyl-3,3,3′,3′-tetramethylindodicarbocyanine perchlorate (DiD-C18), Lissamine rhodamine B 1,2-dihexadecanoyl-sn-glycero-3-phosphoethanolamine triethylammonium salt (rhodamine DHPE, RhoPE), N-4,4-difluoro-5,7-dimethil-4-bora-3a,4a-diaza-s-indacene-3-propionyl-1,2-dihexadecanoyl-sn-glycero-3-phosphoethanolamine triethylammonium salt (Bodipy FL DHPE), N-4,4-difluoro-5,7-dimethil-4-bora-3a,4a-diaza-s-indacene-3-pentanoyl-sphingosine (Bodipy FL C5-ceramide), and sphingomyelinase (SMase) from Staphylococcus aureus sp were purchased from Molecular Probes (Eugene, OR). Optical Adhesive 71, used to glue the mica on coverslips, was purchased from Norland Products (Cranbury, NJ). Three different buffers were used for sample preparation and imaging: buffer A (3 mM KCl, 1.5 mM KH2PO4, 8 mM Na2HPO4, 150 mM NaCl, pH 7.2); buffer B (3 mM CaCl2, 150 mM NaCl, 10 mM Hepes, 3 mM NaN3, pH 7.4); and buffer C (150 mM NaCl, 10 mM Hepes, 3 mM NaN3, pH 7.4). All buffers were filtered through a 200-nm filter (Nalgene, Rochester, NY) before use.
Supported lipid bilayers
Planar bilayers were prepared as already described in Chiantia et al. (23). Briefly, lipids and fluorescent dyes were mixed in organic solutions in different proportions. The lipid composition was DOPC/cholesterol:(SM+Cer) 1:1:1 (molar ratio), whereas the concentration of the dyes was either 0.1% or 0.005% molar, depending on the technique used. The total molar fraction of sphingolipids was kept constant (33%), but the SM/Cer stoichiometry was varied. After solvent evaporation, the lipid film thus obtained was rehydrated using buffer A at 10 mg/mL lipid concentration and resuspended through vigorous vortexing. After sonicating the suspension at 60°C, a small aliquot was diluted in buffer B and deposited on a ∼20-μm thick, freshly cleaved piece of mica, glued to a glass cover slip. The sample was then left at room temperature for 30 min and at 70°C for 10–15 additional minutes. After that, the supported lipid bilayers (SLB) was rinsed at least 10 times with buffer C and then allowed to cool down to room temperature, before being transferred to the microscope. Samples containing more than 12 mol% ceramide were unstable after ∼3 h. For this reason, all the measurements were performed ∼90 min after the cooling phase.
AFM, confocal fluorescence microscopy, and FCS
AFM, fluorescence imaging, and FCS were all performed at room temperature (∼23°C) on the same experimental apparatus. It consisted of a NanoWizard AFM (JPK Instruments, Berlin, Germany) mounted on an LSM 510 Meta (Zeiss, Jena, Germany). The fiber output was coupled to a homebuilt FCS detection unit, consisting of an emission filter and an achromatic doublet (Linos Photonics, Goettingen, Germany) to image the internal pinhole onto the optical fiber connected to an avalanche photodiode (APD) (PerkinElmer, Boston, MA). Correlation curves were obtained with a hardware correlator (Correlator.com, Bridgewater, NJ). Unless otherwise specified, a typical measurement consisted of the following steps: i), check sample integrity and homogeneity through fluorescence imaging of a large area (∼200 × 200 μm); ii), choose a suitable area and positioning the cantilever tip; iii), acquire both the AFM topographic image and the fluorescence image; and, finally, iv), choose a spot on the sample and perform FCS.
For AFM imaging, uncoated silicon cantilevers (MikroMasch, Madrid, Spain) with typical spring constant of 0.03 N/m (manufacturer specified) were used. During measurements the SLB was always covered with 0.5 mL of buffer 3. Contact mode topographic images were collected in the constant-deflection mode, the scan rate being set between 0.9 and 1.5 Hz, and the force was maintained at the lowest possible value, by continuously adjusting the set point during the measurement. Images were collected at 512 × 512 or 256 × 256 pixel resolution and were line-fitted as required with first- or second-order polynomial.
For confocal fluorescence microscopy, the excitation light of a HeNe laser at 543 nm was reflected by a dichroic mirror (HFT KP 700/543) and focused onto the sample by a Zeiss C-Apochromat 40×, NA = 1.2 UV-VIS-IR water immersion objective. Fluorescence signal was then recollected by the same objective and, after passing through a 580/40 bandpass filter, measured by a photomultiplier (PMT). The confocal geometry was ensured by a 78-μm pinhole in front of the PMT.
FCS measurements were performed using the same optical path described for the fluorescence imaging, the signal from the sample being collected in this case by the APD in the FCS unit. The optimal laser power, which produced a good signal/noise ratio without any bleaching or saturation effect, resulted to be ∼10 μW. The laser focus was initially positioned a few hundreds of nm below the z-position which gave the maximum signal intensity and, subsequently, the fluorescence temporal signal was recorded at different z-positions, moving the objective upwards step by step. The z-scan always covered a range of ∼1.5 μm around the membrane, with steps of 0.2 μm. At each step, the signal was collected in 3 runs of 10 s each, and the correlation function G(τ) was calculated, as elsewhere described (24). Data analysis was performed with a software written in Matlab (Mathworks, Natick, MA) obtaining, for each z-position, the average number of particles in the focal volume NP(z) and the corresponding diffusion time τD(z). The final τD was chosen in correspondence to the minimum of NP(z). All the FCS data reported are the result of at least six measurements for each sample and two independent sample preparations.
Due to the presence of the mica glued onto the coverslip, the absolute calibration of the apparatus can be challenging, since the focal volume may be distorted and/or enlarged. We used two methods to estimate the radius of the detection area w0 on the focal plane. First, we measured the three-dimensional diffusion coefficient of Alexa-546 freely diffusing in the buffer. Assuming a Gaussian detection volume, w0 was found to be between 0.24 and 0.32 μm. Secondly, fitting the values of NP(z) and τD(z) to a simple parabolic model, which takes into account the shape and the dimensions of the focal volume, yielded an alternative estimate of the parameter w0 (25). This method resulted in an average value of w0 = 0.29 ± 0.03 μm, in good agreement with the previous estimate.
RESULTS
The structure of the bilayer is strongly influenced by ceramide
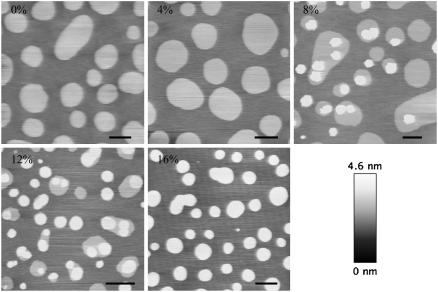
Supported lipid bilayers were prepared with different ceramide contents and their topographical features were examined using AFM. The samples were stable for at least 3–4 h. Over longer times, the presence of ceramide affected the overall stability of the bilayer, resulting in the formation of holes, especially at concentrations higher than 12 mol%. Fig. 1 shows typical images obtained for samples containing 0, 4, 8, 12, 16 mol% of Cer.
FIGURE 1.
AFM topographical images of SLB at different Cer concentrations, at room temperature. The lipid composition was DOPC:cholesterol:(SM+Cer) 1:1:1 molar and SM was gradually substituted for ceramide. In the 0% and 4% samples, two different phases with a height step of ∼0.8 nm can be readily distinguished. In all of the remaining images, a third topographical level can be identified at ∼1.2 nm above the surrounding lowest phase. Scale bar = 2 μm.
Samples containing 0% or 4% of Cer appeared very similar and consistent with previous results obtained for SM/cholesterol/DOPC 1:1:1 SLB, in the absence of Cer (23). For this lipid composition, coexistence of ld phase and lo, raft-like phase is expected. The domain structural features and lipid composition have been already characterized in previous studies (21,23,26). The light-colored round domains in the first two images in Fig. 1, which presented very regular shapes and were ∼0.8 nm higher than the surrounding matrix, thus corresponded to the SM-rich ordered phase. Conversely, the darker areas in these images corresponded to the DOPC-rich disordered phase. At 8% Cer, a third topographical level could be clearly identified, being almost 0.4 nm higher than the liquid-ordered phase. These new domains had a diameter of ∼1 μm and were always localized in the SM-rich domains, either in the interior or at the domain boundaries.
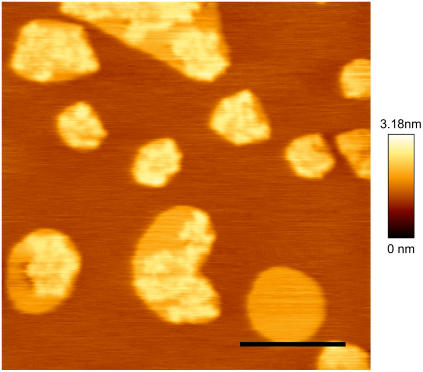
As evident from Fig. 2, higher resolution imaging of the sample revealed a complex structure of these subdomains. Their shape was not as regular as that of the liquid-ordered domains and their height was not constant. An increase in the ceramide content resulted in an enlargement of the surface occupied by the new high domains, up to 16% Cer, where the lower round domains could not be observed anymore and again only two different topographic levels were distinguished. Samples containing 24 mol% Cer, though highly unstable, showed no further relevant modification of the microdomain internal structure (data not shown).
FIGURE 2.
AFM topographical image of a SLB made of DOPC/cholesterol/SM/Cer 1:1:0.76:0.24 molar (8% Cer) at room temperature. Three different phases can be readily distinguished at a relative height of 0, 0.6, and 1 nm. The first two most likely correspond to the liquid-disordered and liquid-ordered domains, respectively. The lightest phase presents irregular features and contours. Scale bar = 2 μm.
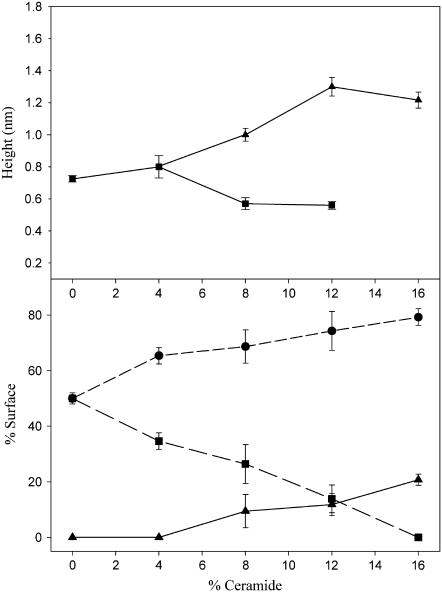
Finally, Fig. 3 summarizes the topographical features of all the examined samples. In the upper panel, the height differences between the different types of domains and the lowest topographic level are represented. At 0% and 4% only one height step was observed, at ∼0.8 nm. At 8% and 12% Cer, as already mentioned, two different steps were observed: the lower one at ∼0.6 nm and the higher one at ∼1.0 and ∼1.2 nm. Finally, at 16% ceramide, again only two phases were present, with constant step of ∼1.2 nm. The lower panel represents the surface percentage occupied by each phase, as a function of the ceramide content. The examined samples showed a clear monotonic trend connected to increasing quantities of ceramide: the intermediate-height phase occupied a portion of the surface which steadily decreased, down to complete disappearance. On the other hand, both the lowest and highest phase steadily enlarged, up to 16% Cer, where the former occupied ∼80% of the sample surface.
FIGURE 3.
Topographical features of ceramide-containing SLBs. In the upper panel, height differences between the domains at the intermediate height and the surrounding lipid matrix (squares), and between the highest domains and the surrounding lipid matrix (triangles), as a function of ceramide content. In the lower panel, surface fraction occupied by the lowest phase (circles), intermediate phase (squares), or highest phase (triangles), as a function of ceramide content. Error bars represent the standard deviations of the measurements.
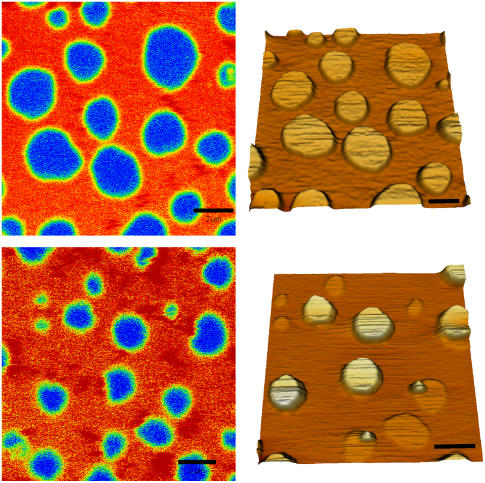
Note that fluorescence imaging did not provide complete information about the lateral organization of the bilayer. This is evident in Fig. 4, which shows, on the left panel, confocal fluorescence images for typical 12% and 4% Cer samples, containing 0.1% RhoPE. Comparison with AFM data, shown on the right panel of Fig. 4, revealed that the dark patches correspond to two distinct lipid phases. This implies that the lipid analog RhoPE partitions almost exclusively into the lowest phase, leaving the intermediate-height domains and the highest ones completely dark. Consequently, fluorescence imaging only allows for a partial characterization of the lateral organization of the membrane. The same results were obtained using Bodipy FL C5-ceramide, Bodipy FL DHPE and DiD-C18 (data not shown).
FIGURE 4.
Fluorescence image (left) and AFM topographical data (right) acquired on the same spot of the membrane at room temperature. The upper panel refers to a DOPC/cholesterol/SM/Cer 1:1:0.88:0.12 sample (4% Cer), the lower panel to a DOPC/cholesterol/SM/Cer 1:1:0.64:0.36 sample (12% Cer). The fluorescent lipid RhoPE was added at 0.1% molar concentration in the lipid mixture.
Dynamic properties of supported lipid bilayers in presence of ceramide
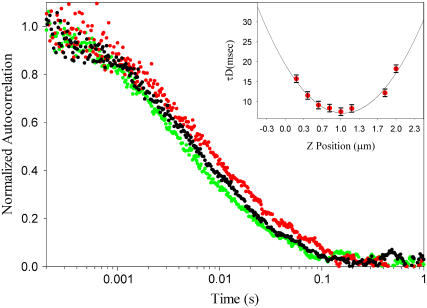
To obtain information about the local dynamics in the different lipid phases, we performed FCS measurements and AFM micromanipulation on ceramide-containing SLBs. More specifically, the AFM tip was used to deform the ordered domains and monitor the process of relaxation back to the original shape. FCS was applied to probe the Brownian diffusion of fluorescent lipids analogs in the ld phase, as a function of the ceramide content. The laser was always focused in a submicroscopic spot onto the lowest lipid phase of the bilayer, at least 3 μm away from the other domains. The accurate x-y positioning was previously determined by both fluorescence and AFM imaging. Fig. 5 shows typical autocorrelation curves, measured in three different samples. It is worth noting that the presence of bright, slow diffusing nonfused liposomes or aggregates can cause severe distortion of the autocorrelation curves. Scanning the AFM tip on the sample, with appropriate force and speed, can sweep away the undesired fluorescent particles, thus allowing a reproducible fluorescence data acquisition.
FIGURE 5.
Typical averaged autocorrelation curves, measured in the DOPC-rich phase for three different samples containing 0% (green), 8% (black), and 16% (red) ceramide. The fluorescent lipid RhoPE was included in 0.005% molar concentration. All measurements were performed at room temperature. For each ceramide content, the final diffusion times τD were computed from the analysis of ∼140 curves: three autocorrelation curves, at approximately eight different z-positions in six independent measurement spots. (Inset) Diffusion times τD for different heights z of the detection volume (16% ceramide). Diffusion times were obtained by fitting the autocorrelation curves to a one-component two-dimensional Brownian diffusion model. (Solid line) Fit to second-order polynomial to determine the minimum diffusion time.
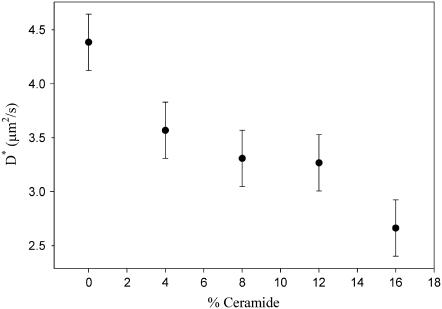
The diffusion times τD of RhoPE in the DOPC-rich phase were determined by fitting the FCS curves to a one-component two-dimensional Brownian diffusion model. The results are shown in Fig. 6, where the relative diffusion coefficients  are plotted as a function of the ceramide content. An absolute estimate of the diffusion coefficient would require precise measurements of the focal spot radius w0, but that is not needed in this case, as we are only interested in the relative changes of the diffusion coefficient as a function of Cer content in the membrane. D* is thus computed by using a reasonable estimate of w0 (see Materials and Methods), which is therefore considered a simple scaling factor.
FIGURE 6.
Relative diffusion coefficient D* for the DOPC-rich phase as function of the ceramide content. D* is computed assuming a mean value w0 = 0.29 μm for all of the samples. To convey a general estimate of the uncertainty associated with these measurements, the error bars represent the average of the standard deviations of all the experimental points.
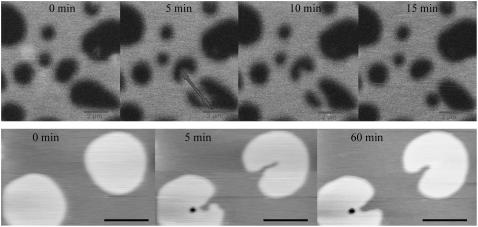
We observed a well-defined dependence of the lipid diffusion coefficient in the bilayer as a function of the ceramide content. In particular, the presence of the Cer molecule, up to 16%, slows down the diffusion of RhoPE in the ld phase. The estimated diffusion coefficients for this phase were consistent with those previously measured in analogous samples (26). Unfortunately, FCS could not be performed on the other lipid phases due to irreproducibility. This may be due to a low signal/noise ratio when RhoPE was used (no suitable probe was found to partition preferably in these domains), and/or a much longer timescale for lipid diffusion, causing photo-bleaching of the fluorescent dyes. For these reasons, the membrane viscosity of those domains was probed by using the AFM tip. Fig. 7 shows the time course of such a measurement, in which the domains were deformed by scanning the tip at high force and speed. The upper series of panels in Fig. 7 shows the micromanipulation experiment on two domains at intermediate height (∼0.8 nm), for a sample without ceramide. In this case, the timescales involved in the process of deformation and relaxation of the domains were not long enough to be efficiently monitored by AFM imaging. Fluorescence images show how, after the manipulation process (third panel, first row), only a few minutes were needed for the irregular-shaped domains to assume a regular and round shape again. A comparable timescale for the same process was observed in samples with a ceramide content of 4 mol%. The second row shows the same experiment on the highest microscopic lipid domains (∼1.1 nm height), for a 16 mol% Cer sample. In this case, the whole process was slower than in the previous case and could, therefore, be effectively monitored by AFM imaging. One hour after the manipulation, the domains still featured the irregular contours which were initially caused by the AFM tip. Compared to the domains of intermediate height, this lipid phase thus exhibited at least tenfold slower dynamics.
FIGURE 7.
Time course of a micromanipulation experiment, in which ordered domains are deformed by the AFM tip. The upper series of panels shows the deformation and relaxation of two domains at intermediate height in a DOPC/cholesterol/SM 1:1:1 sample (0% Cer), followed using fluorescence imaging. The circular shape of the domains is fully recovered in a few minutes. The lower series of panels shows AFM images of the same procedure on the highest domains, in a DOPC/cholesterol/SM/Cer 1:1:0.52:0.48 sample (16% Cer). In this case, after ∼1 h after the deformation, the contour of the domains was still irregular. Measurements were performed at room temperature. Scale bars = 2 μm.
Effects of sphingomyelinase on supported lipid bilayers
In living organisms, ceramide can be produced from sphingomyelin in a reaction catalyzed by the enzyme sphingomyelinase. The action of this protein was observed here in vitro, on a SLB composed of SM/DOPC/cholesterol 1:1:1. A small tube was positioned between the mica and the glass block, which holds the AFM cantilevers, and 60 mU of the enzyme were introduced into the solution after starting the imaging scan.
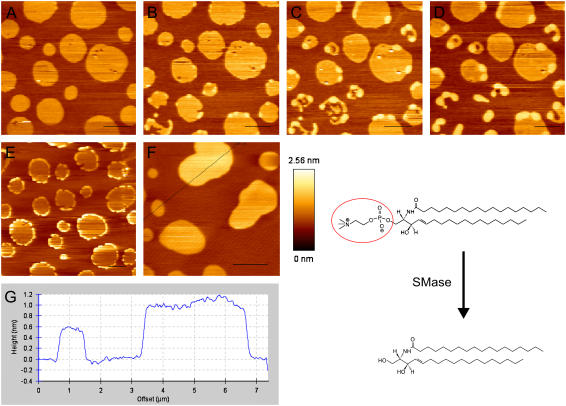
Fig. 8 shows time-course AFM imaging performed on two analogous samples (sample 1: A–D; sample 2: E and F), obtained with an imaging speed of 4 min. Due to the action of the SMase, the lipid domains experienced changes in both height and shape. In particular, the enzyme acted on the liquid-ordered domains, starting from their borders and eventually destabilizing them, thereby inducing changes in their shape and formation of smaller domains or even creating holes in the bilayer. The differences between the two observed samples are due to the difficulties in controlling both the local concentration of the enzyme and the reaction speed. In both cases, several minutes after addition of the enzyme, domains with different heights are present in the SLB and their topology was comparable to that observed in the other previously examined samples with higher ceramide content (see Figs. 1 and 3).
FIGURE 8.
Panels A–F show a time-course measurement on two DOPC/cholesterol/SM/:1:1:1 samples, after addition of SMase at room temperature. The enzyme was injected at the beginning of the scans represented in panels A, for the first experiment, and E for the second. Imaging time was set to 4 min. Panels F and G, in particular, show typical topographical features of the membrane that could be observed after the action of SMase. In the right lower corner, the structures of SM C18:0 and ceramide C18:0 are shown. The red circle indicates the SM phosphocholine group, which is removed by the action of SMase. Scale bars = 2 μm.
DISCUSSION
We have investigated both the morphology and the dynamical properties of lipid microdomains in supported bilayer, composed of DOPC, SM, cholesterol, and ceramide, by using a combined approach of atomic force microscopy and fluorescence correlation spectroscopy. Ternary mixtures of DOPC, SM, and cholesterol 1:1:1 (molar ratio) are known to exhibit liquid-liquid immiscibility, leading to phase-separated microdomains in model membranes (4). For our measurements, we started from this lipid composition, gradually substituting SM with ceramide. The molar concentration of ceramide in our samples was between 0% and 16%. The resulting domain morphology of samples with more than 4% ceramide was found to be qualitatively consistent with that obtained by the action of SMase, which converts SM into ceramide, on bilayers composed of SM, DOPC and cholesterol 1:1:1 molar. Most interestingly, all the significant rearrangements of the bilayer occurred at a Cer concentration between 8 and 16%, which is comparable to the physiological concentrations (11). Our results showed that the addition of ceramide is correlated to the presence of a third lipid phase. AFM images of bilayers with more than 4% ceramide exhibited indeed three different topographical levels. An increase of ceramide concentration results in rather continuous and gradual morphological changes of the domains (see Figs. 1 and 3). For this reason, it is quite safe to assume that, in all our measurements, only three well-defined lipid phases were present.
For all the lipid mixtures used here, the lowest topographical level can be assigned to a liquid-disordered, DOPC-enriched phase, according to the initial lipid composition and the measured diffusion coefficients shown in Fig. 6, which are comparable to that of a liquid crystalline lipid environment. It is worth noting that the diffusion of lipids in such a phase is ∼20% slower for a supported bilayer, if compared to free-standing membranes in water (26). Such difference could be ascribed to the effect of the mica support and/or to the presence of salt in our samples (S. Chiantia, J. Ries, N. Kahya, and P. Schwille, unpublished data).
The lipid phase at intermediate topographical level is ∼0.8 nm higher than the surrounding lipid matrix and is organized in microscopic round domains, which appear dark in fluorescence. They can be observed in samples containing 0–12% Cer, and can be assumed to consist of a liquid-ordered phase, enriched in cholesterol and SM. This statement is substantiated both by the height difference with the DOPC matrix, consistent with previous AFM data (21,23), and by the liquid-like properties, which were probed by the micromanipulation experiment (see Fig. 7). Fluorescence imaging shows that these liquid-ordered domains rapidly assumed a regular round shape to minimize the interaction surface between different phases.
Interestingly, distinct properties were observed for the highest topographical level. The height step between these lipid microdomains and the low DOPC-enriched phase is around 1.2 nm, which is comparable to what is observed for liquid-gel phase separation in POPC/DPPC (27) and DOPC/DPPC (28). Furthermore, the surface fraction occupied by the highest phase grows in parallel with ceramide content. Taken together, the data lead to the conclusion that the highest domains observed in our samples most likely correspond to a ceramide-enriched gel phase. This finding is supported by the fact that, after the AFM tip-induced deformation, the relaxation time back to a round shape was on the timescale of hours, i.e., much longer than the one observed for the liquid-ordered domains.
Although our data do not allow for a precise characterization of the composition of distinct lipid phases, some considerations can be formulated. It is well known that ceramide molecules interact strongly, forming a stable hydrogen-bond network among their polar heads. As a consequence, poor mixing with other lipids and formation of ceramide-enriched gel-like domains is then expected for our sample compositions (8,29). Additionally, both ceramide and cholesterol are known to reduce the steric repulsion among the bulky SM headgroups and to interact via hydrogen-bonds with their polar moieties (29). In this case, SM molecules can come closer together, maximizing the interactions between their aliphatic chains. This molecular mechanism explains the stabilizing effect of cholesterol in SM-enriched liquid-ordered domains. In previous x-ray diffraction studies on C18:0-SM bilayers, it was found that the thickness of the membrane, which is an indication of the vertical extension of the lipid aliphatic chains and of their packing density, is reduced from 5.2 to 4.7 nm by the presence of cholesterol (30). Conversely, cholesterol makes the lower DOPC-rich phase thicker and thus reduces the height step between this phase and the SM-rich domains (21). Previous AFM measurements show that, in case of liquid-gel phase separation in PC/Cer (27) and PC/SM (31) bilayers, the relative height of the gel domains was between 0.8 and 1 nm. According to the previous considerations, these values must represent an upper limit, if cholesterol is introduced in the lipid mixture. Consequently, we speculate that the height step of ∼1.2 nm that we observed for the highest domains is an indication of the existence of a highly ordered and tightly packed gel-like phase, most likely composed of both ceramide and SM molecules. This possibility is supported also by the data in Fig. 3, which show a gradual decrease of the surface occupied by the ordered domains (liquid-ordered and gel). As ceramide increases the stability and the configurational order in the ordered domains, the distance between the lipids and, consequently, the surface occupied by the ordered phase may decrease. On the other side, such decrease of the surface fraction could also be partially due to the lower quantities of SM present in the bilayer. As SM is supposed to be present both in gel and liquid ordered domains, interacting respectively with ceramide and cholesterol, the surface occupied by these domains should indeed scale down with the decreasing quantity of SM included in the lipid mixture. Small or no condensing effect of cholesterol in the DOPC-rich phase can be observed in our samples, in agreement with previous experiments (32). Note that the presence of SM in these ceramide-enriched domains, though compatible with the specific interactions between these two sphingolipids, cannot be unquestionably proven in this study.
As a direct consequence of the strong interactions with SM, it was also proposed that ceramide molecules could efficiently displace cholesterol from raft domains in model membranes (18). A possible explanation for this phenomenon is that less SM molecules are available for interacting with cholesterol in the ordered domains. On one hand, ceramide gradually replaces SM in the preparation of the bilayer, so that less and less SM is engaged in an interaction with cholesterol. On the other hand, ceramide competes with cholesterol in the interaction with the remaining fraction of SM. The presence of cholesterol in the DOPC-rich phase would have two immediate consequences. First, a decrease of the diffusion coefficient in that phase, probably due to the ordering imposed by the rigid sterol rings on DOPC aliphatic chains (26,33,34). Furthermore, a transfer of cholesterol to the ld phase would cause, as already pointed out, a decrease of the height difference between the liquid-ordered and the liquid-disordered phase. As evident from Fig. 6, the sample containing 16% ceramide showed indeed a reduction of the RhoPE diffusion coefficient by 40% in the DOPC-rich phase, compared to bilayers prepared without ceramide. Similar reduction of diffusion coefficient was measured in DOPC/cholesterol giant unilamellar vesicles, when cholesterol content was increased from 0% to ∼40% molar (26). Fig. 3 shows that the height difference between the liquid-ordered and the lowest phase is reduced from ∼0.8 nm to ∼0.6 nm, already at 8% ceramide. These data, although not conclusive, strongly support the hypothesis of an increased presence of cholesterol in the DOPC-rich phase, as a consequence of ceramide-induced displacement from rafts.
Finally we studied the effect of the enzyme SMase on a lipid bilayer composed of SM/DOPC/cholesterol 1:1:1. Fig. 8 E shows that the enzyme localizes on the lo phase, and that the production of ceramide starts at the border of domains. The inhomogeneous distribution of the enzyme activity can be rationalized by the molecular packing disorder characterizing the interface between two lipid phases. In these areas of the membrane, the insertion of external molecules like proteins or drugs is energetically more favorable (35). Thus, in the case of SMase acting on SM/DOPC/cholesterol bilayers, the substrate (i.e., the choline moiety) near the boundary of lo domains might be more favorably exposed to the active site of the enzyme. The membrane structural features observed after enzyme addition are comparable to what is observed when ceramide is directly included in the preparation of the bilayer. In particular, beside the formation of holes induced by ceramide formation, three topographical levels can be distinguished in the sample (Fig. 8, G and H), being quantitatively comparable to those observed at 8% or 12% ceramide. It is worth noting that, if the enzyme action is stopped by strong dilution, structural rearrangements of the bilayer, monitored by fluorescence imaging and FCS in the disordered phase, keep taking place for at least 100–120 min (work in preparation), in line with previous observations by Holopainen et al. (29).
CONCLUSIONS
In this work, we have applied a combination of AFM and FCS to study model membranes of biological relevance. In particular, we were able to investigate simultaneously the fine structural features and the dynamic properties of supported lipid bilayer, which exhibit liquid-ordered, raft-like, domains. We showed that the presence of physiological quantities of ceramide severely affected the lipid spatial organization in domains, as a gel-like ceramide-enriched phase appeared in correspondence with raft-like domains. Furthermore, our data provide evidence of an increased concentration of cholesterol in the liquid-disordered phase, which support the hypothesis of cholesterol displacement from rafts induced by ceramide (18). Similar structural alterations of membrane microdomains may have crucial importance in regulating signal transduction or lipid-mediated cell signaling in vivo (8). These results show that the combined approach of AFM and FCS on supported membranes is a promising tool for elucidating the molecular mechanisms driving ceramide-induced lateral rearrangements of membrane components in living cells.
Acknowledgments
The authors thank Rachel Owen for useful discussion and reading of the manuscript. Avanti Polar Lipids is gratefully acknowledged for permission to use chemical structures of lipids shown in this article.
This work was partially financed by Europäischen Fonds für regionale Entwicklung (EFRE) grant No. 4212/0402.
References
- 1.Singer, S. J., and G. L. Nicolson. 1972. Fluid mosaic model of structure of cell-membranes. Science. 175:720–731. [DOI] [PubMed] [Google Scholar]
- 2.Barenholz, Y., and T. E. Thompson. 1980. Sphingomyelins in bilayers and biological-membranes. Biochim. Biophys. Acta. 604:129–158. [DOI] [PubMed] [Google Scholar]
- 3.Anderson, R. G. W. 1998. The caveolae membrane system. Annu. Rev. Biochem. 67:199–225. [DOI] [PubMed] [Google Scholar]
- 4.Mayor, S., and M. Rao. 2004. Rafts: scale-dependent, active lipid organization at the cell surface. Traffic. 5:231–240. [DOI] [PubMed] [Google Scholar]
- 5.Simons, K., and E. Ikonen. 1997. Functional rafts in cell membranes. Nature. 387:569–572. [DOI] [PubMed] [Google Scholar]
- 6.Simons, K., and W. L. C. Vaz. 2004. Model systems, lipid rafts, and cell membranes. Annu. Rev. Biophys. Biomol. Struct. 33:269–295. [DOI] [PubMed] [Google Scholar]
- 7.Kolesnick, R. N., F. M. Goni, and A. Alonso. 2000. Compartmentalization of ceramide signaling: physical foundations and biological effects. J. Cell. Physiol. 184:285–300. [DOI] [PubMed] [Google Scholar]
- 8.Cremesti, A. E., F. M. Goni, and R. Kolesnick. 2002. Role of sphingomyelinase and ceramide in modulating rafts: do biophysical properties determine biologic outcome? FEBS Lett. 531:47–53. [DOI] [PubMed] [Google Scholar]
- 9.Bollinger, C. R., V. Teichgraeber, and E. Gulbins. 2005. Ceramide-enriched membrane domains. Biochim. Biophys. Acta. 1746:284–294. [DOI] [PubMed] [Google Scholar]
- 10.Kolesnick, R., and Y. A. Hannun. 1999. Ceramide and apoptosis. Trends Biochem. Sci. 24:224–225. [DOI] [PubMed] [Google Scholar]
- 11.Hannun, Y. A. 1996. Functions of ceramide in coordinating cellular responses to stress. Science. 274:1855–1859. [DOI] [PubMed] [Google Scholar]
- 12.Veiga, M. P., J. L. R. Arrondo, F. M. Goni, and A. Alonso. 1999. Ceramides in phospholipid membranes: Effects on bilayer stability and transition to nonlamellar phases. Biophys. J. 76:342–350. [DOI] [PMC free article] [PubMed] [Google Scholar]
- 13.Ruiz-Arguello, M. B., F. M. Goni, and A. Alonso. 1998. Vesicle membrane fusion induced by the concerted activities of sphingomyelinase and phospholipase C. J. Biol. Chem. 273:22977–22982. [DOI] [PubMed] [Google Scholar]
- 14.Siskind, L. J., and M. Colombini. 2000. The lipids C-2- and C-16-ceramide form large stable channels - Implications for apoptosis. J. Biol. Chem. 275:38640–38644. [DOI] [PMC free article] [PubMed] [Google Scholar]
- 15.Holopainen, J. M., M. I. Angelova, and P. K. J. Kinnunen. 2000. Vectorial budding of vesicles by asymmetrical enzymatic formation of ceramide in giant liposomes. Biophys. J. 78:830–838. [DOI] [PMC free article] [PubMed] [Google Scholar]
- 16.Al-Makdissy, N., M. Younsi, S. Pierre, O. Ziegler, and M. Donner. 2003. Sphingomyelin/cholesterol ratio: an important determinant of glucose transport mediated by GLUT-1 in 3T3–L1 preadipocytes. Cell. Signal. 15:1019–1030. [DOI] [PubMed] [Google Scholar]
- 17.Ito, J., Y. Nagayasu, and S. Yokoyama. 2000. Cholesterol-sphingomyelin interaction in membrane and apolipoprotein-mediated cellular cholesterol efflux. J. Lipid Res. 41:894–904. [PubMed] [Google Scholar]
- 18.London, M., and E. London. 2004. Ceramide selectively displaces cholesterol from ordered lipid domains (rafts)—implications for lipid raft structure and function. J. Biol. Chem. 279:9997–10004. [DOI] [PubMed] [Google Scholar]
- 19.Alanko, S. M. K., K. K. Halling, S. Maunula, J. P. Slotte, and B. Ramstedt. 2005. Displacement of sterols from sterol/sphingomyelin domains in fluid bilayer membranes by competing molecules. Biochim. Biophys. Acta. 1715:111–121. [DOI] [PubMed] [Google Scholar]
- 20.Bjorkqvist, Y. J. E., T. K. M. Nyholm, J. P. Slotte, and B. Ramstedt. 2005. Domain formation ans stability in complex lipid bilayers as reported by cholestatrienol. Biophys. J. 88:4054–4063. [DOI] [PMC free article] [PubMed] [Google Scholar]
- 21.Saslowsky, D. E., J. Lawrence, X. Y. Ren, D. A. Brown, R. M. Henderson, and J. M. Edwardson. 2002. Placental alkaline phosphatase is efficiently targeted to rafts in supported lipid bilayers. J. Biol. Chem. 277:26966–26970. [DOI] [PubMed] [Google Scholar]
- 22.Schwille, P., J. Korlach, and W. W. Webb. 1999. Fluorescence correlation spectroscopy with single-molecule sensitivity on cell and model membranes. Cytometry. 36:176–182. [DOI] [PubMed] [Google Scholar]
- 23.Chiantia, S., N. Kahya, and P. Schwille. 2005. Dehydration damage of domain-exhibiting supported bilayers: an AFM study on the protective effects of disaccharides and other stabilizing substances. Langmuir. 21:6317–6323. [DOI] [PubMed] [Google Scholar]
- 24.Magde, D., E. Elson, and W. W. Webb. 1972. Thermodynamic fluctuations in a reacting system. Measurement by fluorescence correlation spectroscopy. Phys. Rev. Lett. 29:705–708. [Google Scholar]
- 25.Benda, A., M. Benes, V. Marecek, A. Lhotsky, W. T. Hermens, and M. Hof. 2003. How to determine diffusion coefficients in planar phospholipid systems by confocal fluorescence correlation spectroscopy. Langmuir. 19:4120–4126. [Google Scholar]
- 26.Kahya, N., D. Scherfeld, K. Bacia, B. Poolman, and P. Schwille. 2003. Probing lipid mobility of raft-exhibiting model membranes by fluorescence correlation spectroscopy. J. Biol. Chem. 278:28109–28115. [DOI] [PubMed] [Google Scholar]
- 27.Simonsen, A. C., and L. A. Bagatolli. 2004. Structure of spin-coated lipid films and domain formation in supported membranes formed by hydration. Langmuir. 20:9720–9728. [DOI] [PubMed] [Google Scholar]
- 28.Burns, A. R. 2003. Domain structure in model membrane bilayers investigated by simultaneous atomic force microscopy and fluorescence imaging. Langmuir. 19:8358–8363. [Google Scholar]
- 29.Holopainen, J. M., M. Subramanian, and P. K. J. Kinnunen. 1998. Sphingomyelinase induces lipid microdomain formation in a fluid phosphatidylcholine/sphingomyelin membrane. Biochemistry. 37:17562–17570. [DOI] [PubMed] [Google Scholar]
- 30.Maulik, P. R., and G. G. Shipley. 1996. Interactions of N-stearoyl sphingomyelin with cholesterol and dipalmitoylphosphatidylcholine in bilayer membranes. Biophys. J. 70:2256–2265. [DOI] [PMC free article] [PubMed] [Google Scholar]
- 31.Milhiet, P. E., M. C. Giocondi, O. Baghdadi, F. Ronzon, B. Roux, and C. Le Grimellec. 2002. Spontaneous insertion and partitioning of alkaline phosphatase into model lipid rafts. EMBO Rep. 3:485–490. [DOI] [PMC free article] [PubMed] [Google Scholar]
- 32.Filippov, A., G. Oradd, and G. Lindblom. 2003. The effect of cholesterol on the lateral diffusion of phospholipids in oriented bilayers. Biophys. J. 84:3079–3086. [DOI] [PMC free article] [PubMed] [Google Scholar]
- 33.Smaby, J. M., H. L. Brockman, and R. E. Brown. 1994. Cholesterol's interfacial interactions with sphingomyelins and phosphatidylcholines: hydrocarbon chain structure determines the magnitude of condensation. Biochemistry. 33:9135–9142. [DOI] [PMC free article] [PubMed] [Google Scholar]
- 34.Polson, J. M., I. Vattulainen, H. Zhu, and M. J. Zuckermann. 2001. Simulation study of lateral diffusion in lipid-sterol bilayer mixtures. Eur. Phys. J. E. 5:485–497. [Google Scholar]
- 35.Mouritsen, O. G., and K. Jorgensen. 1998. A new look at lipid-membrane structure in relation to drug research. Pharm. Res. 15:1507–1519. [DOI] [PubMed] [Google Scholar]


